|
Connect with Peter on LinkedIn!
I have been so tempted the last few weeks and months to call a bottom, going against my own firm belief "no one knows". I think I have saved some embarrassment by not doing what so many others do, attempting to predict.
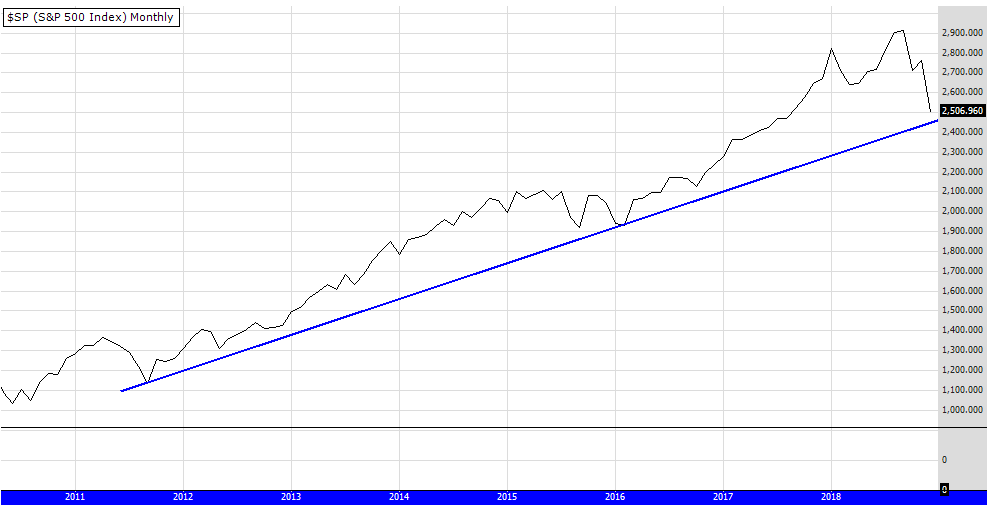
However the US market has reached an important line in the sand, a trend line that "should" give significant support to what now is looking like a very oversold and possibly irrational market. Those two conditions can lead to opportunity.

The chart above shows the influential US500. The bull market that really took off around 2012 (that I have written about in previous articles) is having a correction not a crash. If the market falls more that statement will change, but as we analyze what is in front of us NOW that is the logical conclusion. Any other conclusion peoples minds are creating is driven by fear of the unknown, a natural human emotion.
Another positive sign is volume. Although not shown on this chart volume is very high at the moment, an indication sellers are capitulating and "giving up". It's when many give up and sell from emotional exhaustion the markets turn and rise, causing even more exasperation for those suffering.
Remember every week I post the 52 week highs and some general comments about the market. I also post Peters Portfolio, this portfolio target average is 25% p.a. but this years been tough and it is currently sitting around 9%. Let's see what next year brings.
Merry Xmas and Happy New Year.
The links to the pages mentioned are below.
http://www.easysharetradingsystems.com.au/how-to-trade/52-week-highs
http://www.easysharetradingsystems.com.au/easy-share-trading-systems/peters-portfolio
About Peter
http://www.easysharetradingsystems.com.au/easy-share-trading-systems/about-the-author
|