
The methods I have been discussing and the results displayed on other pages have given no consideration to what a company does to produce earnings. Trading buy signals give no reasons “why” a share is performing as it is. Systems are often based on momentum of price and volume.
However, some people are deeply concerned about a company’s effect on the environment and the social impact of a company's policy. Our trading rules may trigger a buy in a gambling company - you may be passionately opposed to gambling. You may also feel strongly opposed to alcohol and consider it a social problem and do not want to support companies in this sector. If so you can do your own screening of stocks to suit your personal beliefs.
For example, for many years I traded the gold market particularly gold shares.
Mining is a controversial issue and I agree with the concerns of many. For example some years ago Newcrest Mining of Australia bought out Lihir gold of Papua New Guinea. Lihir has a horrid environmental record in that country in regard to polluting river systems and for that reason I would not buy it. Hopefully Newcrest is doing a better job.
As a child I lived in New Guinea and remember swimming in the rivers with children of that country. I don’t like the thought that no longer will those rivers be pollution free, because we in western economies support a company with little concern for social liberties.
This is my choice, we all need to make our decisions and live with them. It is possible to still make money and trade well by being a little selective.
Below is a guideline as to what to look for before deciding to invest in a company, more information can be found on the ASX website or by googling a companies website for its ethical protocol.
Ethical Criteria
|
Your trading needs to be easy, simple and as stress free as possible.
Reduce the stress, feel in control and you will trade well.
Trade well and you make money.
Follow the three sections of this site to learn more
- Have an Objective
- Its about YOU
- Keep it Simple
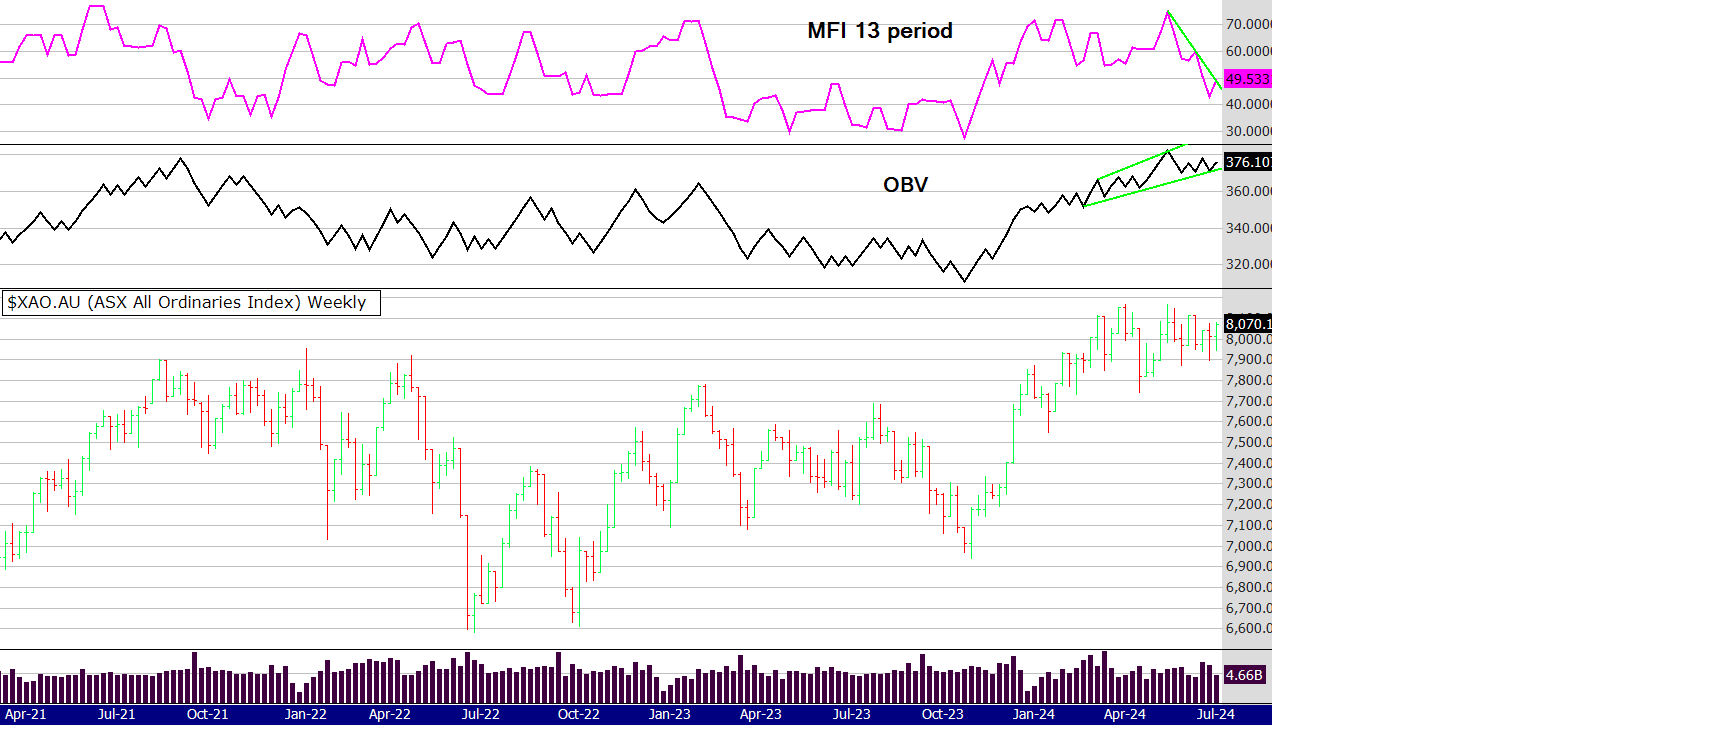
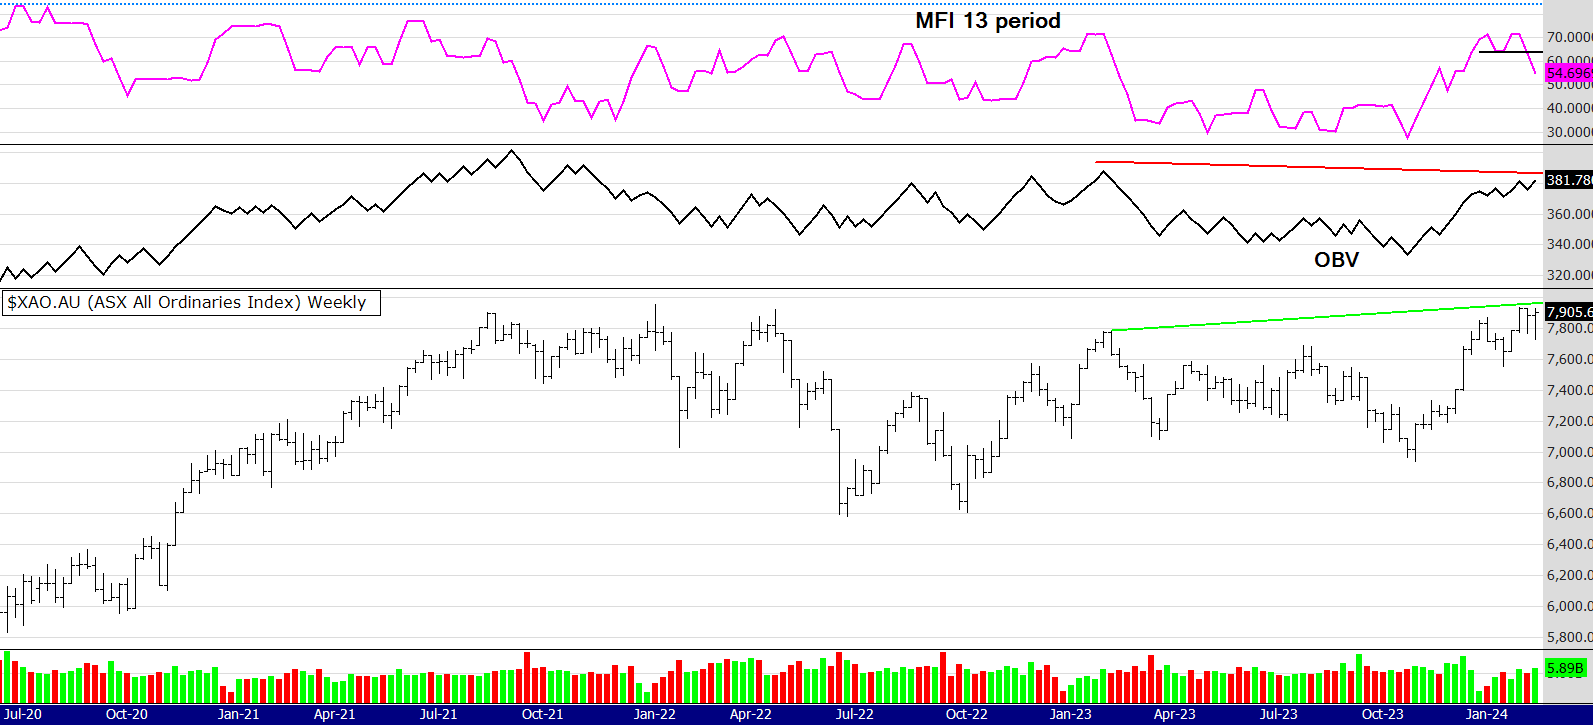
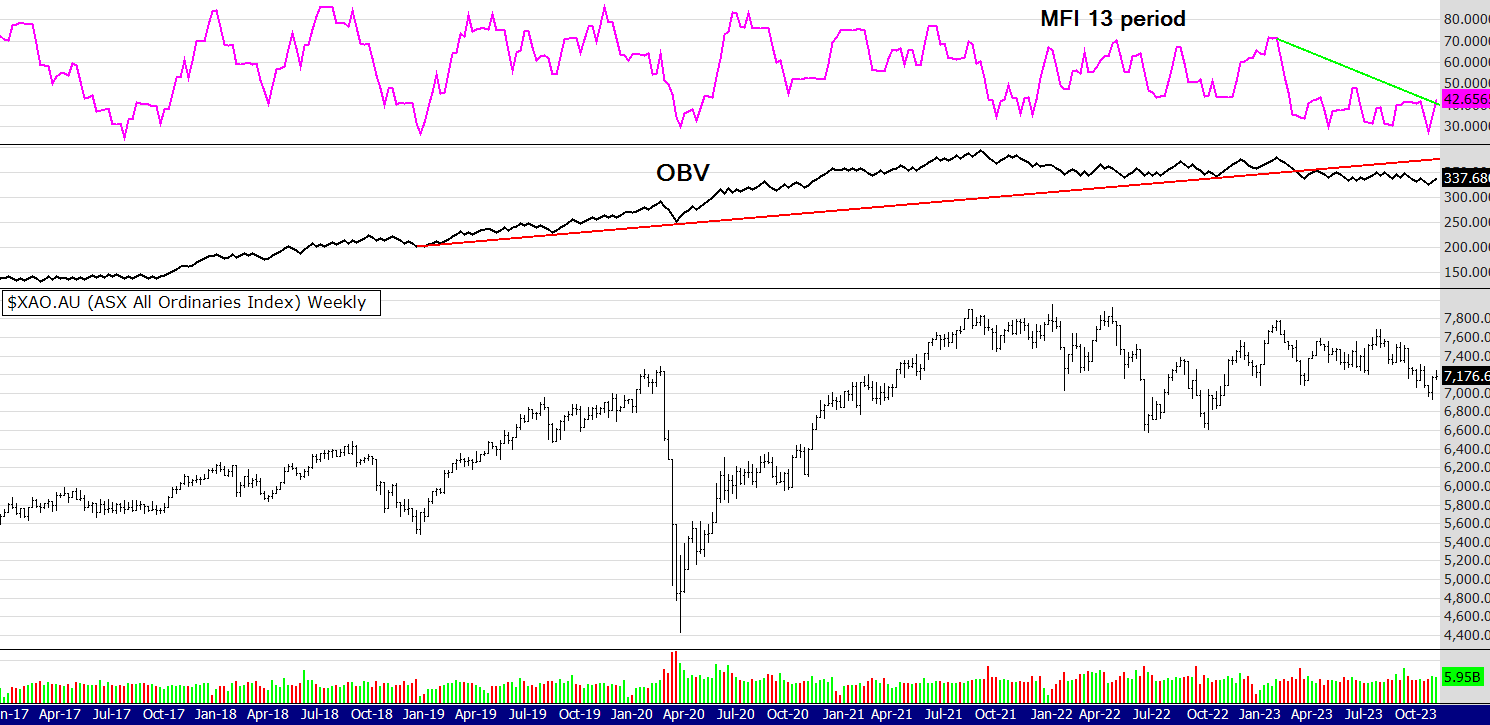
MARKET COMMENTS: As of the close on Friday 16/8/24: See charts below with an On Balance Volume indicator and the Money Flow Indicator using a 13 period

The big news this week is that after last week not having any 52 WH signals (for as long as I can remember - probably back to Covid 2020) this week there is eleven in the 300 and two in the 300 to 500. So the bulls went hiding last week and this week are back with a vengeance.
Moving to the chart above you can see the OBV still looking strong - it never really weakened signalling the probability the market was correcting not crashing. The MFI 13 period (one calendar quarter) looks a little hesitant by putting in a double bottom. However if the overhead down trend line breaks to the upside, which may happen as soon as tomorrow, this could give the bulls more conviction to keep buying. I would like to post something I said back on the 26/7/24.
My experience and intuition tell me this market is similar to the late 1990's. A period when the market produced gains beyond peoples wildest dreams. It's also a very difficult market to trade because moves up, and down, are fast and unsettling. Dips are to be bought (which takes nerve) and big gains after fast rises are to be sold. A strategy I have used over the years is to sell 50% of my holdings after a stock has risen 70% - by tightening the stop, after that I let the rest ride until my primary stop has been hit. I do not re-enter the trade, gnash my teeth over "what may have been" " I should have " "I could have" etc. Rather than re-enter I move on to the next trade. Like a pro tennis or golf player we play one shot at a time. One trade at a time. Let the bad trades and shots go.
I do think this volatility and rapid change in the market will continue for a while (maybe years). There is a lot at present to unsettle the markets, two weeks ago it was the Yen carry trade and the BOJ raising rates. Next it will be? Who knows.
As I have said repeatedly here over the last 13 years, one of the best ways to trade is to have a method and stick to it. Review often, work on your mindset, particularly the temptation to predict or need to know.
All the best in the coming weeks and months as this market deals with the many "what ifs?"
may the force of peace of mind be with you.
Peter
52 week closing highs as of the Fridays close 16/8/2024
Below are the alerts from a scan of the ASX 300 and the 300 to 500
300: AGL AMP CGF CPU EVN GPT IFL MFG PMV RMD VCX
300- DUG FID
Please note: in the eBook I wrote in 2016 (available for purchase on this website on the link below) I have made some changes to the system. If you have bought the eBook I am happy to email you a PDF explaining the changes I made, which from testing and trading does improve the system.
Here is the link to the eBook Mindful Trading using Winning Probability written in 2016 -
and the internationally published The Zen Trader (2022) - now in three languages, English, Spanish, German and in 2025 Traditional Chinese.
IMPORTANT POINTS TO CONSIDER
A new 52 week high for this system is classified when the stock price is at its highest close (or equal to the highest close) counting back 52 weeks.
If a stock continues to make new highs, for example in the 53rd and 54th week, they are now regarded as ROLLING highs, not NEW 52 week highs.To clarify again, the buy signal for THIS system discussed is a NEW 52nd week or 1 year closing high, not a rolling high as is often given elsewhere.
The signals provided are WITHOUT A BULL FILTER.
The exit used FOR THIS METHOD is the 5/12 EMA crossover. Therefore, some stocks will be re signalling a new high buy signal if they have been recently exited by using the 5/12 exit within the last 12 months. This is important and you need to understand this.
Of course the 5 EMA needs to be above the 12 EMA to make the 52 week high valid, (otherwise we would be selling straight away) nearly always this is the case, but rarely if a stock spikes it is not.
So to repeat, the rules are: USING WEEKLY PARAMETERS!
Entry:
Share price to make a 52 closing (or equal to) week high (when selecting a buy, favour the cheapest stock)
The 5 ema to be above the 12ema
Exit:
if the 5 ema crosses below the 12 ema
The above system contains no position sizing, bull or bear filters or fundamental stock selection, these are discussed and taught to private clients or at my courses.
MARKET COMMENTS: As of the close on Friday 9/8/24: See charts below with an On Balance Volume indicator and the Money Flow Indicator using a 13 period

This week I will keep it brief. The XAO had a reasonable week considering the big falls on Monday. Volumes are holding OK. It's a wait and see game now as to how next week trades and if buyers return to support the market.
A lot of that will depend on how the US markets perform on Friday their time.
I will update this page on the weekend.
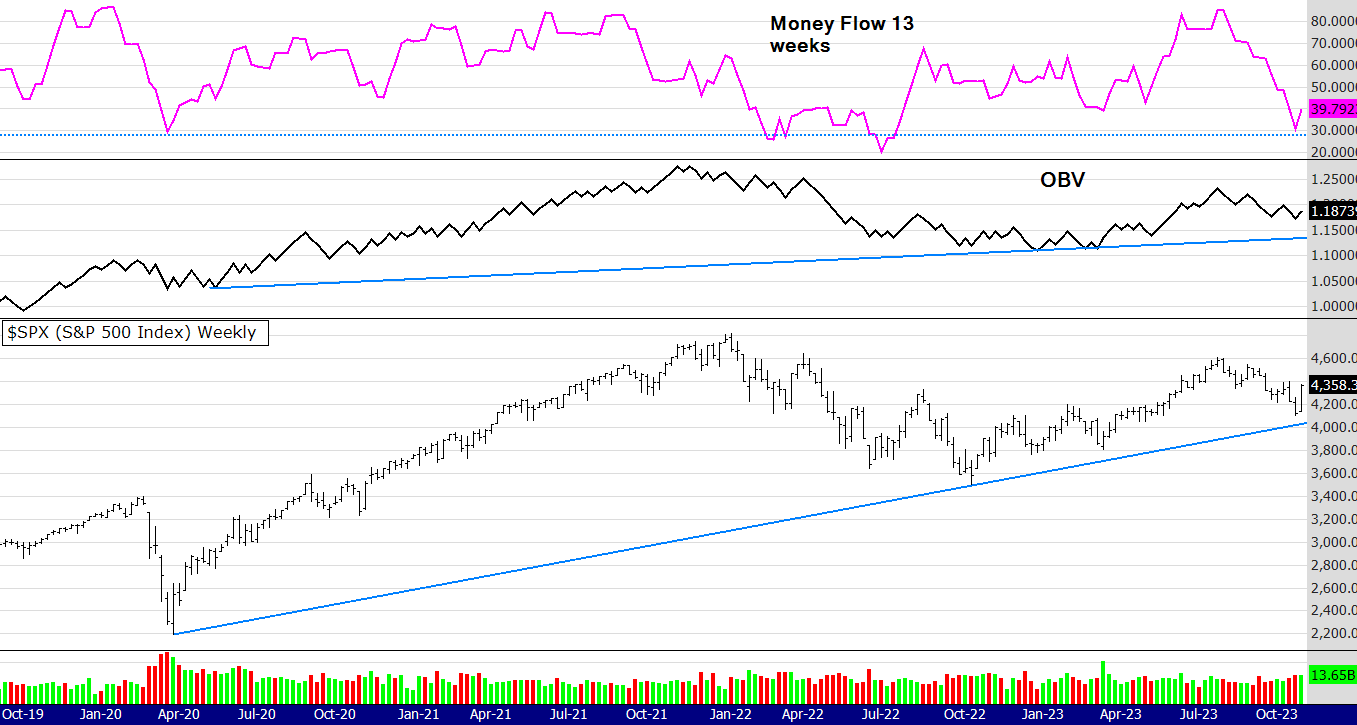
So I wrote the above on Friday night before US trading - and how did it go and how did the indexes close for the week? Below is a chart of the globally dominant SPX.
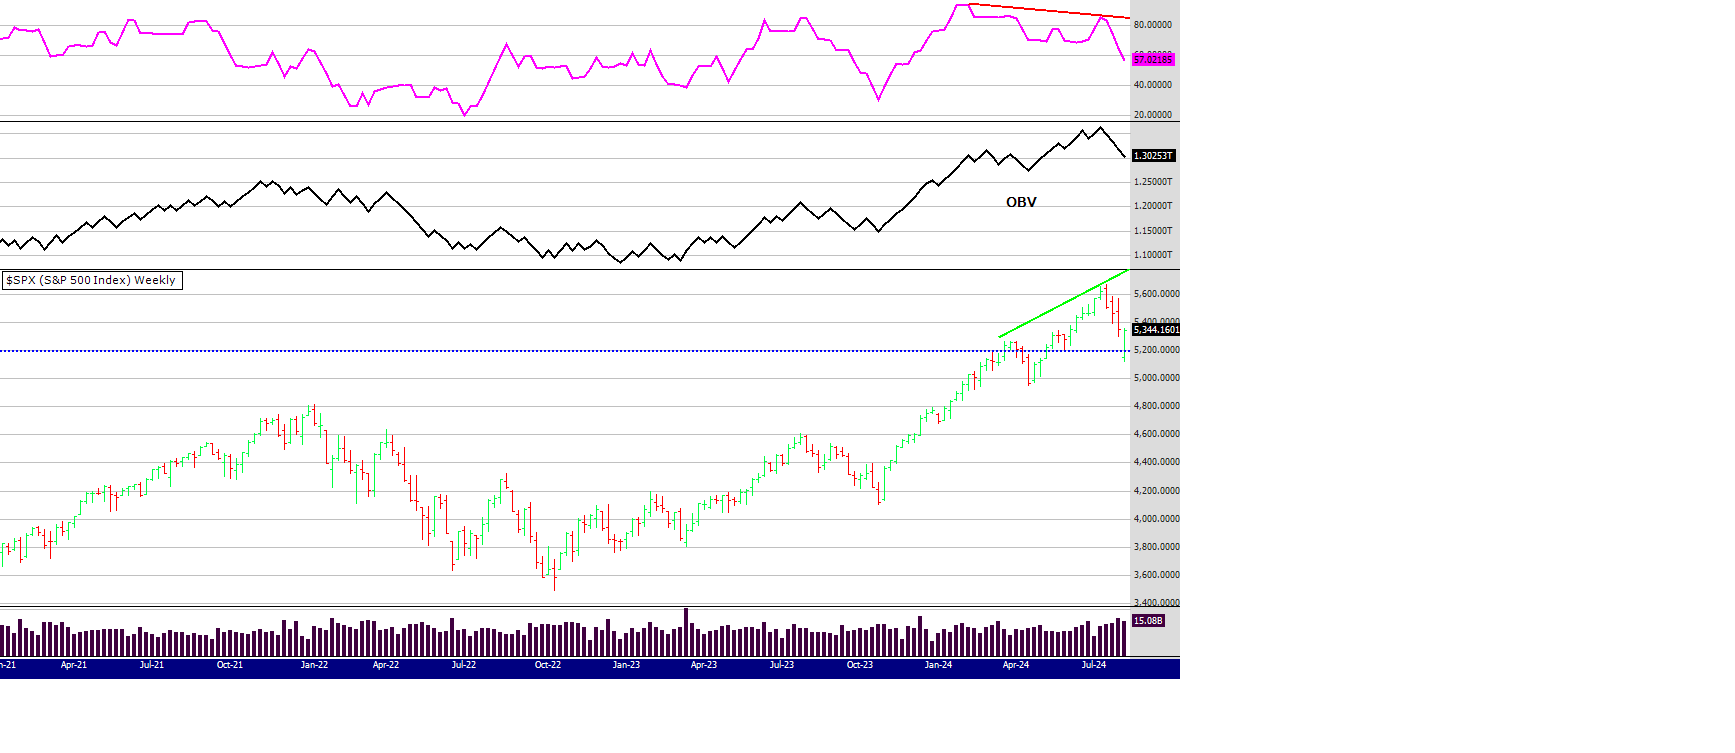
The MFI 13 period was showing a negative divergence, markets were nervous and all it was going to take for a fall was an event. Well we got one, the Japanese raising rates. However that is the past, what about the present? In my opinion until this index breaks below the low in April of 4953 it is still in a weekly uptrend. Others may disagree but that is the level I think is critical.
The MFI on the SPX is still pointing down but if you change it to a shorter time frame (6 weeks) it is in over sold territory. Also, I like to remind people that "one bar does not make a trend". Although this weeks bar is very positive, the index has more work to do to convince the bears and those nervous about the "what ifs".
Let's now turn our attention to the Russell.

Before this recent correction the focus of many was on the rotation from big caps to small and medium cap stocks. How quickly people forget the current narrative and move to the next! Looking at the chart above it appears that the rotation is still healthy and alive. Which will be good for the ASX as the Aus market is closely correlated with the Russell - as discussed many times here in these comments. (scroll below through previous weeks to find that)
Volume support on the Russell appears stronger that the SPX. This makes sense as the SPX contains the Gorilla stocks (Tesla, Nividia, Apple - the magnificent 7 etc) that were being sold off and funds rotated into the Russell. For example, compare the volume bars of this week between the SPX and the Russell. For every seller there is a buyer and there is obviously many buyers active in the Russell.
I notice too last night in the US that the futures for XJO (top 200) outperformed the US SPX -a sign of things to come? One bar does not make a trend :)
Gold: no chart today but the trend continues up. The GDX in the US was up another 1% last night and one would expect (be careful using that word) that the Aus gold stocks will rise again on Monday.
As you can see there were no 52 WH alerts this week - not surprising. Stepping aside when the market is not giving signals is a feature of that system.
Thats it! Have a great weekend and I am off to help organise a 21st birthday party.
Cheers!
Peter
MARKET COMMENTS: As of the close on Friday 2/8/24: See charts below with an On Balance Volume indicator and the Money Flow Indicator using a 13 period

Lets talk about the chart of the XAO. One bar does not make a trend IMO. Sure, its got a bearish look to it - this weeks bar, but I repeat, one bar does not make a trend so we need more information to make a bearish or bullish call. Probably the most difficult thing about being a market participant is uncertainty. All we really have is the present because no one knows what the future holds, there is probability and you can manage your portfolio around that, but no one knows whats going to happen. If you want to read a little about my thoughts of "what if" and "don't know" click on the link for a newsletter I wrote back in 2015.
https://www.easysharetradingsystems.com.au/products-and-services/archive/listid-1/mailid-79-what-if
So whats happening in the now? Coming back to the chart we can see its still trending up, volumes are holding and despite this weeks volatility, this weeks low and this weeks close, are still higher than the week before. Also there are 6 stocks making 52 week closing highs this week in the ASX 500, so some stocks are performing well.
Last week I said " Its also a very difficult market to trade because moves up, and down, are fast and unsettling.
And
"So! Have a plan in mind how you will manage your trades ............."
Speaking of plans here is the performance of the eBook system on the ASX 500 the last 12 months. 16% without dividends included.

I acknowledge its not knocking it out of the park, but its not losing either. I checked my recent 3 month portfolio performance last night, up 2 % since late May. It was up 7% , but this week it got knocked around. Its been a tough time and I admit to feeling exasperated as I am sure many are.
Lets look at arguably the most important index. Nasdaq 100.

You can see by looking at the negative divergence of the MFI that the index was overbought - nothing new, analysts have been discussing that for some time and charts don't lie. The price is on support and the OBV is yet to break into a downtrend, if that happens the chart will look weaker. However, in the present, IMO, we have a correction, not a crash. Price could fall to the next level of support and to the previous low on the OBV. Technically speaking the downtrend won't be in play until the low in April 24 is taken out, because that's the last pivot low when analysing a weekly chart. A little disclaimer here.........I am not the best T.A. analyst in the land, others may see it differently, but that's what I see.
One more chart and I am done for today..........

There has been more talk (by myself too) about rotation of stocks out of big caps to smaller caps. Looking at the chart above you can see the more dynamic MFI volume indicator was warning perhaps that theory had got ahead of itself, it was flashing a big divergence. However the OBV is in a solid uptrend and so is the price action. Yes, the chart has past price resistance to work against and it's going to take more belief from investors that the rotation philosophy has legs, that its not a "fly by night" event. The price has pulled back to a 2 year support level so it remains to be seen if it can hold.
Summary: if you don't have a solid system that you are committed to, its probably a good time to sit out for a while and see what happens over the next few weeks. Regroup and re-plan.
I said i was done but I will mention gold stocks.
Similar to the other indexes the GDX in Aus may have got a little ahead of itself, its flashing volume divergence - but the trend is up, the divergence is not that bearish and as I said a few weeks ago I hold core positions in gold stocks and I wouldn't be shorting them!
That's a long read, if you got this far congrats!
Until next week
Peter
MARKET COMMENTS: As of the close on Friday 26/7/24: See charts below with an On Balance Volume indicator and the Money Flow Indicator using a 13 period


Keeping with the theme of the last few weeks - which has been
1/ its a bull market.
2/ the top does not appear to be here.
3/ trading is about probability not prediction.
4/ historically there is a strong correlation between the Russell 2000 and the XAO.
5/ US stocks appear to be rotating from large caps into the Russell 2000 suggesting that stock market breadth in the US is widening - which is bullish.
6/ The XAO is lagging the Russell, as seen in the chart above, either the Russell will fall or the XAO will catch up - I think the latter is more probable.
Overall this appears to be a very strong market - a big rally or even a blow off top may be coming, who knows. If a blow off top eventuates we will deal with it at the time.
My experience and intuition tell me this market is similar to the late 1990's. A period when the market produced gains beyond peoples wildest dreams. Its also a very difficult market to trade because moves up, and down, are fast and unsettling. Dips are to be bought (which takes nerve) and big gains after fast rises are to be sold. A strategy I have used over the years is to sell 50% of my holdings after a stock has risen 70% - by tightening the stop, after that I let the rest ride until my primary stop has been hit. I do not re-enter the trade, gnash my teeth over "what may have been" " I should have " "I could have" etc. Rather than re-enter I move on to the next trade. Like a pro tennis or golf player we play one shot at a time. One trade at a time. Let the bad trades and shots go.
Otherwise they are all negative, soul destroying thoughts, often produced by the simple fact the trader had no strategy in mind to deal with the many possibilities the market may throw at us.
So! Have a plan in mind how you will manage your trades if the market rallies hard and even produces a blow off top from here * Also keep an eye on that correlation between the Russell and the XAO, it's an important one IMO. If the XAO plays follow the leader, there are going to be many opportunities in the Aus market, maybe starting as soon as Monday.
Until next time
Peter
* ATR trailing stops, active at all times in the market are an effective tool. At times they will whip you out - but save you if the market plummets suddenly.
MARKET COMMENTS: As of the close on Friday 19/7/24: See charts below with an On Balance Volume indicator and the Money Flow Indicator using a 13 period

Comments from last week: Trading is based around probability IMO. I think it's probable the XAO will consolidate here for a while, do some "backing and filling" as many readjust their portfolios for the rotational change that has just occurred. That change being a rotation from some bigger overbought stocks into the smaller and midcap stocks that have not been a part of this rally - yet.
The market rallied up fast but then fell to exactly where it opened as consolidation and readjusting of portfolios and the new paradigm took hold. What new paradigm? Probably mostly Trumpanomics, as traders and investors moved money to stocks and sectors that may benefit from a Trump win.
However, looking at the chart it now looks even more bullish than last week. Volumes have increased and the OBV has made an all time new high suggesting price will catch up to volume - that means higher prices.
Back on the 14th June I talked about the correlation between the Russell 2000 in the US and the XAO in Australia. You can scroll down on this page to see the chart and my comments on that date.
Looking at the present price action you can see the XAO is correlating nicely to the Russell as it has often done - except for the extreme times during Covid, but the XAO still went up, just not as much. I know there is a lot of fear and uncertainty at the moment, the main fear being that this bull market can't last much longer and the sell off (reallocation of funds) from the Nasdaq will create a bear market. Well, that's not what I think when I look at longer term price and volume charts of the Russell, but that's another discussion and perhaps next week I will post some charts showing what I mean.

Have a great week
Peter
MARKET COMMENTS: As of the close on Friday 12/7/24: See charts below with an On Balance Volume indicator and the Money Flow Indicator using a 13 period

Last week I said this
"However the Russell 2000 still drags the chain making me wonder what will it take for that index to come to life? Definite, not just rumoured rate cuts perhaps......... the chart above does seem to be improving - and perhaps building for another leg up"
Well what a week! The Russell surged around 6%, the continual expectations of rate cuts in the US encouraged traders and investors to buy the index. I have spoken many times of the correlation between the Russell and the XAO, and this time the correlation again proved itself.
Looking at the chart above you can see clearly the 13 period money flow Index has broken its down trend line, however the less dynamic OBV has some work to do. Trading is based around probability IMO. I think it's probable the XAO will consolidate here for a while, do some "backing and filling" as many readjust their portfolios for the rotational change that has just occurred. That change being a rotation from some bigger overbought stocks into the smaller and midcap stocks that have not been a part of this rally - yet.
Gold exploded again, however some of the gold stocks look a little overbought, but I wouldn't be shorting them. I did lighten up a little on gold stocks this week taking some money off the table - I may have that wrong and they could keep surging but I still hold core positions.
Alerts below and have a good week.
Regards,
Peter
MARKET COMMENTS: As of the close on Friday 5/7/24: See charts below with an On Balance Volume indicator and the Money Flow Indicator using a 13 period
Well wasn't that an interesting week! On the 1st July money poured into the resources, energy and commodities sectors and made me wonder what do others know that I don't? I found out in a few days as hopes and expectations of a rate cut in the US fueled a rally in the oversold commodities sectors. Gold went along for the ride and had another strong day on Friday in the US. However the Russell 2000 still drags the chain making me wonder what will it take for that index to come to life? Definite, not just rumoured rate cuts perhaps.
The financial sector also had a strong week and what will that sector do if we don't get a rate rise? We will have to wait until the 17th July when the June quarter CPI figures are released and maybe the Aus market will plod sideways until then. Who knows, I am just writing my thoughts about what may happen but we need to stay open minded to possible "good" news as well as "bad" news.
I am a regular listener to the Fear and Greed podcast. Recently they were discussing that banks now made up 31% of the market cap in the All Ords and resource stocks 23%. So 54% of the Aus market is banks and finance. If those two sectors rally, the index rises.
So, looking at the chart above it does seem to be improving - and perhaps building for another leg up. The price action is a little ahead of the OBV, but the MFI is in oversold territory and starting to move up. The 52 WH system is still producing regular buy alerts (five this week) indicating that the market has some strength. A sector that continues to surprise here in Aus and the US is the Consumer Discretionary sector. It seems it takes a lot to stop people spending and the RBA must be wondering what to do next.
Many have there theories about inflation. In 2022 the Australia Institute released a research paper claiming 70% of inflation in Australia was caused by excess corporate profit. It was initially slammed. In 2023 the OECD released a similar finding about Europe! Now this year in 2024 we have the following, claiming US company profits are responsible for over 50% of inflation. See the link below.
Raising rates wont fix the problem if the authors of the three papers are correct. We need fiscal policy not the blunt tool of rate rises in my opinion.
https://www.theguardian.com/business/2024/jan/19/us-inflation-caused-by-corporate-profits
Thanks for reading and until next week
Peter
MARKET COMMENTS: As of the close on Friday 28/6/24: See charts below with an On Balance Volume indicator and the Money Flow Indicator using a 13 period

Not much to say this week. It's a game of wait and see. Obviously the thought of higher rates from the RBA in August did not help the sentiment this week. Price dropped down to the blue dotted support line and then bounced back up. There is a glimmer of hope from the U.S. as the Russell 2000 continues to show some support. I talked about that over the last few weeks - and this week the trend continues of the Nasdaq falling but the Russell rising. Anomally? Or rotation from big tech to the broader market?
If the XAO tracks the Russell as it historically does we may have a better week but sentiment is waning.
I remain positive until the charts show a clear breakdown. At the moment they are hanging in there.
Regards
Peter
MARKET COMMENTS: As of the close on Friday 21/6/24: See charts below with an On Balance Volume indicator and the Money Flow Indicator using a 13 period

I am going to get a little technical this week so you are either going to love it or hate it :)
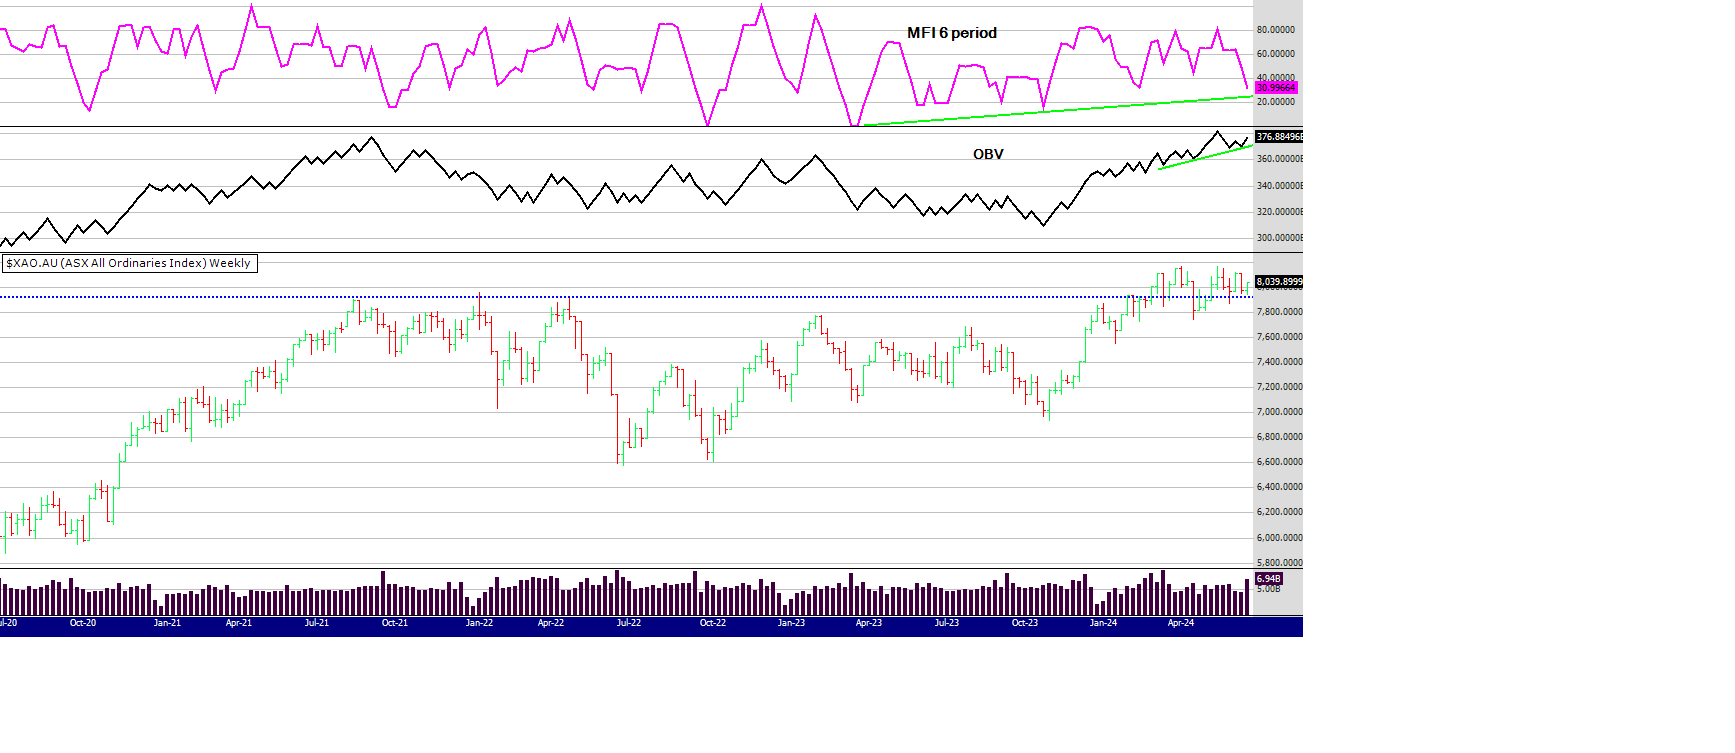
The MFI is a more dynamic indicator because of the way its calculated - see here https://www.investopedia.com/terms/m/mfi.asp
Sometimes the MFI can give strange signals - so sometimes (not often) it can help to change the time period of the indicator - to help analyse probability. In the top chart you can see that OBV is looking strong but MFI 13 week period is breaking down, what's that about? In my opinion its because of the big volume bar this week skewing the look of the indicator.
Moving down to the 2nd chart using the 6 period MFI you can see it's in oversold territory. I chose a six period (6 weeks) because that's the time frame (some say 7 weeks) markets or stocks often move up and down, before either taking a pause or reversing. Here is another link here for you to read up about that https://www.tradingview.com/script/kDC1dFjU-7-Week-Rule/
I think this market is still strong - despite the worry and bearishness expressed by some. This week there are 7 new 52WH signals and that is not the sign of a weak market. Of course prediction is not the aim here, but we are trying to glean from the stats and charts the probabilities of market direction.
As often mentioned I am keeping an eye on the Russell in the US. You can see on the chart below how closely corelated the XAO is with the US index. At the moment the XAO is outperforming and it's going to be interesting to see what happens if the Russell picks up the pace. Will the XAO continue to follow its bedmate - or is the XAO overbought? Is the Russell telling the XAO its got ahead of itself?
Or, is the XAO (Aus economy) now the stronger index?
I don't think we will have long to find the answer,
until next week
Peter
MARKET COMMENTS: As of the close on Friday 14/6/24: See charts below with an On Balance Volume indicator and the Money Flow Indicator using a 13 period


You either love trading and investing, find it interesting and challenging or it really frustrates you. This week I admit falling into the latter mindset as the market went through its "normal" ups and downs. Normal as in indecision, worry, fear and uncertainty. That mindset is reflected in the fact of only two 52 week highs this week for the Mindful system.
Taking a step back from all the emotion continually surrounding us - is the fact the chart above still shows a strong uptrend. Price has come back to horizontal support of around 8,000 and the volume indicators are hanging on also at supportive trend lines. You can see that the market has gone up and down now for 12 weeks, between 8150 and 7800.
Fears over the direction of interest rates continue and the commodity stocks took a hit as prices in most underlying commodities fell. On Friday night in the US some commodity prices and stocks recovered a little, so we may get a better start to the week on Monday.
Until the market gets some positive news the probability is it will drift sideways to lower. Unless of course the US indexes continue to rally and pulls our indexes along for the ride. Strength still appears to be in the Tech sector - as much as I want to see the Russell in the US perform, it wont happen until it does.
Until next week
All the best
Peter
MARKET COMMENTS: As of the close on Friday 7/6/24: See charts below with an On Balance Volume indicator and the Money Flow Indicator using a 13 period

Strong price action this week on low volume. This week the top 200 performed well and the Small Ords (100-300) was flat. Also this can be seen not just by looking at the charts, but the 52 week highs confirming. Just one alert in the 300-500 but six in the ASX 300. Three of those six alerts being in the ASX 100, ALL CAR CBA.
Last night the gold price was sold off heavily, perhaps my comments on the 24/5/24 were correct - scroll down to see the chart of the GDX that I posted a few weeks ago and here is a repeat of my concerns.
"Looking at the Monthly chart of the GDX below I would like to see more volume. May is nearly over, the volume is down a lot compared to April and next week in the US is only a 4 day trading week because of Memorial day on Monday. The OBV is hitting overhead resistance and the 3 period (3 months) MFI is at the top of its range. There is no doubt price is in an uptrend, but to make the price continue its uptrend it needs more love, and the language of love in the markets is money - volume."
So people lie and we all suffer from cognitive bias, but charts do not lie - no doubt some knew about the Chinese factor.
However that comment back in late May, did not stop me getting sucked into the short term rally we had before the Chinese announcement (they bought no gold in May) as I added to some gold stocks on Thursday, but thankfully only a little. We have a holiday here on Monday for Kings Bday so who knows what the market will do when it opens on Tuesday.
Uncertainty prevails around interest rates (not helping gold and commodities) and it seems the debate will continue for the rest of 2024 - until clear data emerges its appears most central banks will play the waiting game - interesting that the ECB bit the bullet and cut last week (which made gold bounce before China stomped on it)
One more chart and a focus on divergences, something I regard as a powerful technical signal. You can see clearly the divergence between price and volume on the gold chart below. The MFI is a faster moving signal than the OBV. It's pointing down quickly and more falls would not surprise me, price could come down a lot more - even as far as major support around 2000. Never forget anything is possible in the markets.
The longer term trend line of the OBV could still hold and price fall a lot more.

I read an article yesterday claiming the first 2 weeks in July is normally the strongest fortnight in the market - data dating back to 1928. Looking at the price action last week we need one hell of a rally for that record to be maintained.
Enjoy the long weekend and that's all till next week.
Regards
Peter
MARKET COMMENTS: As of the close on Friday 31/5/24: See charts below with an On Balance Volume indicator and the Money Flow Indicator using a 13 period

I will discuss the chart above before moving to the one below. The correction from over bought territory continues but volume support remains. Next week will be crucial to see if volumes break to the downside. I suggest you read the last 2 weeks comments about what I think is happening in the markets. Please scroll to the chart below.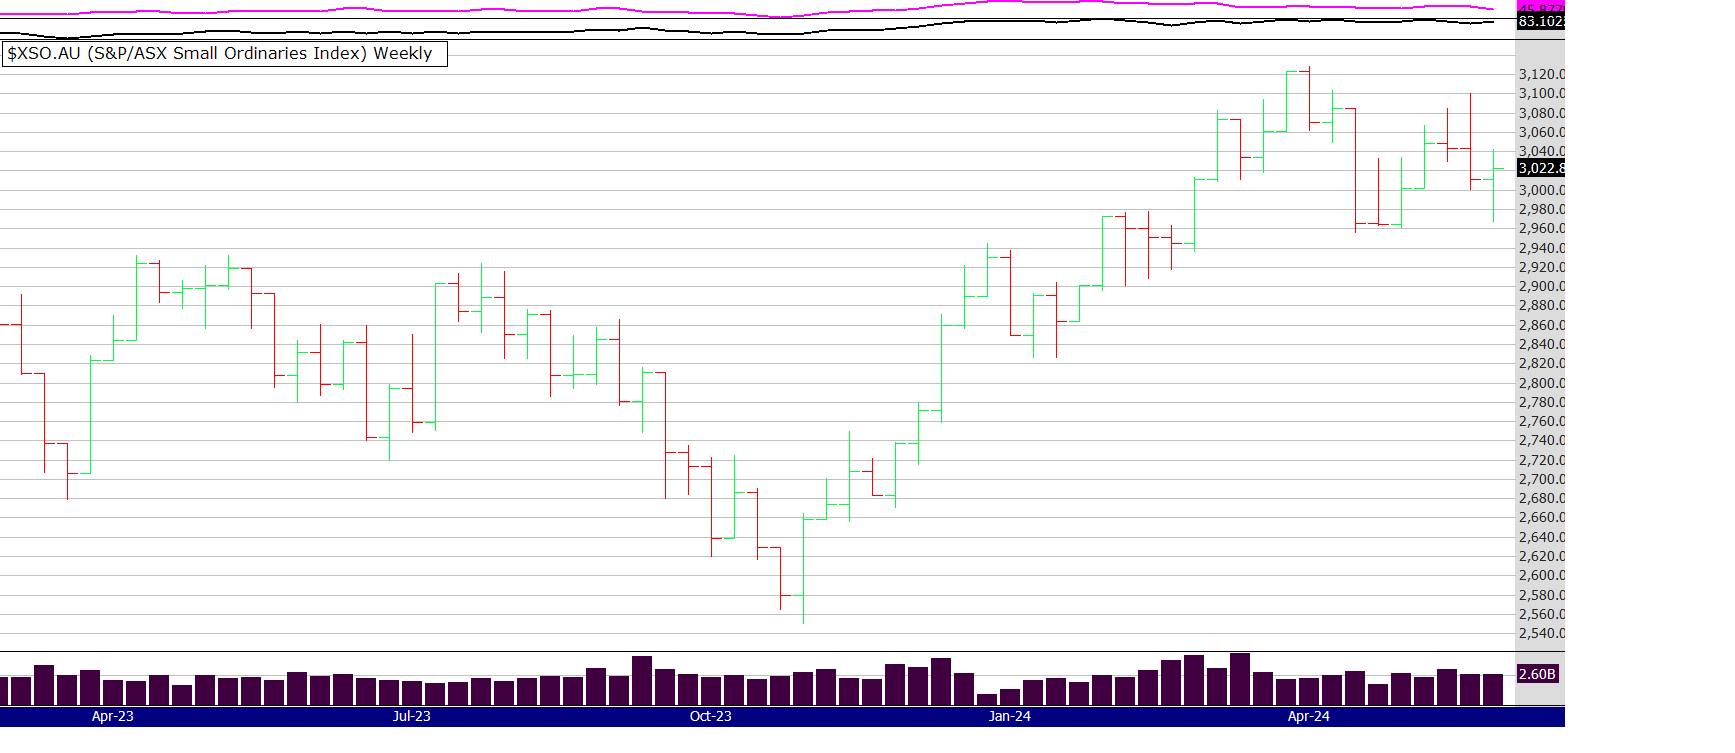
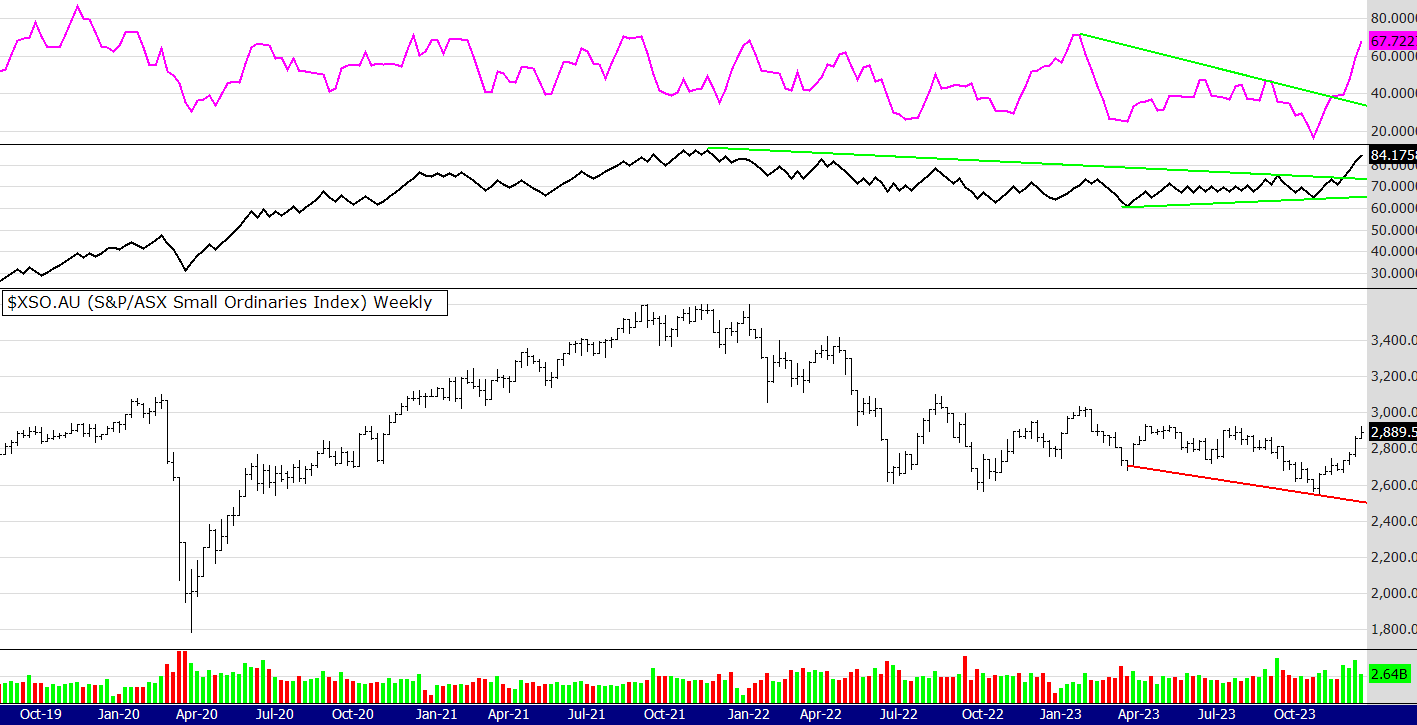
This is a chart of the Small Ords, the index represents stocks in the 100 to 300 range of the ASX. A similar grouping to the Russell 2000 in the US, that index represents stocks in the 1000 to 3000. Note the last bar, its green and the close is up, as opposed to the XAO (that contains the top 100) where the bar is red and the close is down.
This price action shows to me that interest in the smaller stocks is increasing, traders are rotating out of large caps looking for opportunity elsewhere. Also the market remains strong with eight 52 week closing highs. For more detail on my thinking re read the last 2 weeks comments, nothing has changed - yet.
Short and sweet this time
Have a great week
Peter
MARKET COMMENTS: As of the close on Friday 24/5/24: See charts below with an On Balance Volume indicator and the Money Flow Indicator using a 13 period

Looks like I jinxed the market saying last week it looked over bought with the 13 period MFI at the top range of the chart. The market is nervous at the moment, interests rates , inflation, sell in May cyclical theory, low growth, strained consumers etc. The market does climb a wall of worry so it's all nothing new. However the chart above still looks healthy IMO. It could correct down a bit more but until price and volume break down more - I see last weeks price action as a normal correction after 4 strong weeks.
I notice this week the 300-500 has generated four 52WH signals and the top 300 just two. Is this a sign that the market is rotating into the smaller caps? If so its a good sign and indicates market breadth.
Last week I said I had a flat week. This week my portfolio did well on the back of gold stocks, although the rally faded late in the week and it remains to be seen what happens this coming week. Actually, looking at long term charts of the US GDX and the Aussie XGD (the gold sectors for US and Aus) I have doubts as to the longevity of the gold stock rally (for the time being) The hype in the sector is often a warning sign that a correction is near. Lets hope I am not jinxing all those gold stock holders out there!
Looking at the Monthly chart of the GDX below I would like to see more volume. May is nearly over, the volume is down a lot compared to April and next week in the US is only a 4 day trading week because of Memorial day on Monday. The OBV is hitting overhead resistance and the 3 period (3 months) MFI is at the top of its range. There is no doubt price is in an uptrend, but to make the price continue its uptrend it needs more love, and the language of love in the markets is money - volume.
Perhaps fund managers will support the gold indexes with the end of month shenanigans that sometimes happens...........
Until next week
Peter

MARKET COMMENTS: As of the close on Friday 17/5/24: See charts below with an On Balance Volume indicator and the Money Flow Indicator using a 13 period

This week I have changed the chart for the candle stick devotee's. Looking at the chart above you can see the OBV has blasted to new all time highs, (blue dotted line). However the MFI is in overbought (OB) territory , again see the blue dotted line. I dont see a problem with that. As often mentioned the MFI is a more dynamic indicator and it can stay in OB territory for some time before correcting. EG: look at July 2021.
My week was interesting. I hold mostly small and mid cap stocks and my portfolio went sideways. It was a week for the Gorilla stocks, Gorilla stocks mainly in Resources and Materials. Other sectors seemed reluctant to join the rally so perhaps some disbelief about the market amongst investors still prevails. Even gold stocks, despite the recovery in the gold price, seemed reluctant to join in.
However!
I notice a big rally in gold stocks (lithium, copper and uranium too) last night in the US so Monday on the ASX will be interesting. Those stocks should take off like an Elon Musk rocket - but we all know sometimes those rockets fail :) Some more comments on Gold below.

I have reposted above, an updated version of the gold chart that I posted last week. Also here are my comments from last week...
"Looking at the chart above I have included the Fibonacci - taken from the breakout at long term resistance at 2050. I am not particularly a fan of any dead Italian mathematician, but it does show something important.
The amount of pull back the trend has. Also, it's a line chart, so much easier to read are they not?
As you can see the price has hardly retraced and this is important - for it shows how keen the buyers are, not wanting to wait (FOMO) for more falls before getting in.
Why?
They are AFRAID the price will rally without them so they do not let the price dip much at all. So, I intend to add to my gold stock positions next week, wish me luck!"
So, FOMO did not really kick in for many of the gold stocks last week, lets see if it does this week. The reason I am focusing on the gold price is that when gold rallies, often does the resource sector in general - as seems to be happening now. Also, many gold stocks also mine copper and I would be surprised if you have not heard the constant talk about copper demand.
So much happening at the moment I could write a lot more but soccer duty calls (as I write on a Sat morning),
have a good week and see you back here next week!
PS: The book Zen Trader has been offered a Taiwanese publishing contract to be printed in Traditional Chinese. This means the book will now circulate through all Chinese speaking countries except the mainland (which may still happen as a result of this offer). Of course it's still a huge market without the mainland and I am pleased to announce this is now the 3rd other language (the others being Spanish and German) apart from English that the book is now produced.
Thanks again to all who have purchased the book to make this possible.
Regards
Peter
MARKET COMMENTS: As of the close on Friday 10/5/24: See charts below with an On Balance Volume indicator and the Money Flow Indicator using a 13 period

I often say trading is about probability not prediction, however I did stick my head on the chopping block last week and say I thought the correction was over - why? There was so much volume coming into the market and perhaps more importantly, the volume was not dropping off with the price, creating a bullish divergence. So we got a rally this week, now what?
If you have ever read the book about Jesse Livermore there is a character in the book called "old Mr. Partridge". He used to hang around the brokers office never seeming to do a lot. When asked by younger traders what he was doing, he would reply "well its a bull market!"
What he was attempting to teach the younger traders was this: in a bull market try not to panic, buy the dips, stick to the trend and your method. Let others lose their heads but you keep your cool.
Easier said than done I know.
It does appear this market will continue up. The ASX is primarily a commodities based index (BHP alone represents around 12% of the top 200) and commodities are on a tear. Speaking of being on a tear, the gold price is on one. Looking at the chart below I have included the Fibonacci - taken from the breakout at long term resistance at 2050. I am not particularly a fan of any dead Italian mathematician, but it does show something important.
The amount of pull back the trend has. Also, it's a line chart, so much easier to read are they not?
As you can see the price has hardly retraced and this is important - for it shows how keen the buyers are, not wanting to wait (FOMO) for more falls before getting in.
Why?
They are AFRAID the price will rally without them so they do not let the price dip much at all. So, I intend to add to my gold stock positions next week, wish me luck!
Until next week,
Peter

MARKET COMMENTS: As of the close on Friday 3/5/24: See charts below with an On Balance Volume indicator and the Money Flow Indicator using a 13 period

In my opinion the correction is over. When I wrote that statement I thought "hang on Pete, you don't make predictions". However based on the probability of the price action in the chart above, it appears that price has found support at the long term blue dotted line and volumes are clearly breaking up. Price should now follow. Particularly now that the US markets had a strong close to the trading week.
Over the last 2 weeks the signals for the 52 week highs have slowed, that's understandable considering the recent market price action. The alerts for this week and last week are below. I was busy with school holiday commitments the previous week and I plain forgot about the updates!
The graph below shows the performance of the 52 week high system on the ASX 300 for the last 12 months. Before the recent correction it peaked at 25% return but now its around 16%. In the last year its done 56 trades (around one a week) and has a 42% win rate. Those results do not include dividends but also do not take into account brokerage costs - so it would pretty much even out. The biggest winner was AD8 (chart below) and it was only just stopped out last week. The win rate and return percent p.a., can be improved if trading a stock list with strong fundamentals.
For example, the same 52 week high method used on a list of stocks with high ROE and EPS growth has returned 28% (peaked at 37% before the recent pullback) and has a 60% win rate. It also did less trades with 45 compared to 56.
No rocket science, trade trending stocks with good fundamentals and the bull market does the heavy lifting. You just need to get out of the way.


Have a good week, it should be a good one - unless we get another economic curve ball,
All the best
Peter.
MARKET COMMENTS: As of the close on Friday 19/4/24: See charts below with an On Balance Volume indicator and the Money Flow Indicator using a 13 period

Despite the falls in price, the OBV and MFI are showing support. The price has come back to the longer term support line (blue dotted line). A very interesting development in the US is the sell off on the Nasdaq (driven by AI stocks) yet price support in the Russell 2000.
There are many reasons for the market volatility and uncertainty, I am sure you know them all. The most important things to watch in my opinion is price and volume on the charts. At the moment the chart above still looks quite strong, sure, its had a sell off buts its been on a tear for some time and markets do not go up in a straight line.
The commodities are rallying and Australia is a commodity based economy. Its going to be interesting to see how it responds to the rotation of funds (Tech to other industries) affects the Aussie market and economy.
Have a good week
Peter
PS: I used candles in the chart for a change, I am aware many people use candles now rather than bars, let me know what you think at This email address is being protected from spambots. You need JavaScript enabled to view it.
MARKET COMMENTS: As of the close on Friday 12/4/24: See charts below with an On Balance Volume indicator and the Money Flow Indicator using a 13 period

The first full 5 day trading week after Easter and volumes understandably increased. This weeks trading produced an "inside bar" which indicates uncertainty. Will the market continue up or fall down? An inside bar suggests that is the question on traders and investors minds.
The OBV continues going up but the MFI is hitting its overhead resistance line, you can see I have drawn that overhead down trend line on the chart. This MFI has been suggesting for a few weeks now that uncertainty prevails, well tell us something we don't know! :)
On Friday in the US the market fell across all indexes, including gold and crypto. Gold appears to have indicated a blow off top and the probability is - it will fall to support. How much that fall is and what support it respects (near or far) will be a big indicator as to the real strength of the gold rally. Below is a chart of the Gold miners ETF in the US (which the Aus market follows closely). You can see the big reversal bar and massive volume indicating a change of mind from traders. If it can hold support around 32.00 that will be a good indicator of strength. The less the fall before going back up, the stronger the market IMO. One to watch with interest but not prediction.

Anyway, that's it for this week. 52 week high alerts are below
Have a great week
Peter
MARKET COMMENTS: As of the close on Friday 5/4/24: See charts below with an On Balance Volume indicator and the Money Flow Indicator using a 13 period

A down bar, but one bar does not make a trend. The rally in commodities, particularly gold continued. Bear in mind it was another 4 day trading week being post the Easter break. Not much to say except let's see what next week and a full 5 days trading can show. This week was one of uncertainty and positioning as money continues to rotate around the sectors looking for the best opportunities (which appears to be commodities).
In the US on Friday, the markets recovered a little of their losses from earlier in the week. The markets are still trending strongly and it wouldn't surprise me to see more upside from here, even though the markets look over bought. One would expect fireworks in some of the junior gold and resource stocks next week as they play catch up to a rampaging gold and copper price. The gold price also looks over bought, but if FOMO kicks in - and I have a feeling it may - then it's probably the sector to look at for continuation set ups. Be careful though as many gold stocks have already rallied 30% or so and when they reverse they do so very quickly. Control risk and perhaps set wider stops, as gold stocks swing around more than others. You need to preserve capital and sanity.
ps: its probably worthwhile reading last weeks comments regarding the resources rally
Until next week
Peter
MARKET COMMENTS: As of the close on Friday 28/3/24: (Easter Thursday 28th was the last trading day of the week)See charts below with an On Balance Volume indicator and the Money Flow Indicator using a 13 period

Inflection point that I discussed for the last 2 weeks was clearly resolved this week. The price of the index went up. There was low volume, no doubt some of the reason was the 4 day trading week, and people shooting through early from work on Thursday for the holiday break. However it could also be a lack of conviction? A concern the market is overbought?
The true and steady (although at times lagging) OBV is clearly up, however the more dynamic (yet not always accurate) MFI is still pointing down and showing a negative divergence compared to the price. Is that a worry? It's too early to tell, also as I mention often, this index at times is not a true reflection of whats happening amongst sectors within the market. Money appears to be rotating back into resources, you can see that with the rally in the big mining stocks like BHP, RIO, FMG etc. Some sectors such as I.T. , Health and Consumer Discretionary are either taking a break or slowing as money rotates back into Materials, Resources, Utilities, Oil, Copper and Gold. Since the Covid rally stalled in late 2022 Consumer staples has performed poorly as people return to "normal" and risk on takes over risk off.
So it's a very interesting time, if the markets globally are overbought and there are concerns about growth - then why the rotation into stocks that supply the basics of growth? One of the biggest bull markets we had on the ASX was when miners rallied hard between 2003 and 2008 (before the famous GFC crash) . See chart below of the benchmark miner - BHP

After rallying from $10 in 2003 to $25 and then falling to $20 in 2007, many thought it was all over for the big Australian, but then it rallied to nearly $40 before the GFC. Many believe we are in the final stage of a bull market - Stage 3. The final and most aggressive move up. So over the final stage can BHP almost double again from around 40 to 80? Also what will that do to the small and mid cap miners? If you were trading around the early 2000's you will remember the explosive returns that some of those stocks achieved.
As mentioned last week keep an eye on the Russell 2000 in the US, also the GDX - the gold miners index, if these continue to rally and FOMO kicks in we could be having a repeat (to some degree) of 2003 to 2006, or more likely 2006 to 2008. A two year rally will take us to 2026, the year that many believe will be the end of the long term 18 year cycle that started in 2008. See link below for more info about that.
https://propertysharemarketeconomics.com/18-point-6-property-share-market-economics/
Food for thought (and research)
Happy Easter
Until next week
Peter
MARKET COMMENTS: As of the close on the 22/3/24: See charts below with an On Balance Volume indicator and the Money Flow Indicator using a 13 period

This recent weeks price action on the XAO (All Ords) resulted in what is called an "Inside Bar" - when the current bar or candlestick is neither higher or lower than the bar before. You can google if you like but it means indecision or consolidation in the minds of market participants. Makes sense when you think that traders and investors are not sure if to push the market higher or lower, a bit like a Mexican standoff where no one is prepared to shoot first!
Last week I said.... "Inflection point! I have been saying for a few weeks now (reread previous comments) the MFI 13 period was not behaving in a bullish manner, it was pointing down whilst price and OBV were pointing up"
That situation remains, this week the price did bounce up from the longer term dotted blue support line. I am still bullish on this chart, the All Ords is still producing regular 52 week closing highs ( see below) and it appears to be a broad based rally with many stocks performing well, not just the big gorillas that often dominate the Aussie market index ( big banks, big resources, big health etc).
Another bullish sign coming from the US, is the support for the Russell 2000. A concern from some, has been the fact that the bull market is driven by the gorillas in the US too - being a handful of stocks in the Nasdaq. Very interesting is the look of this chart below when comparing to the XAO. The price and OBV are clearly trending up but the MFI shows some uncertainty for the time being. In my opinion the chart below could be the most important one of all. If this index - representing a much broader reflection of the US economy (which affects the world) continues to strengthen, this bodes well for the All Ords here in Australia.

Until next week
Peter
MARKET COMMENTS: As of the close on the 15/3/24: See charts below with an On Balance Volume indicator and the Money Flow Indicator using a 13 period

Inflection point! I have been saying for a few weeks now (reread previous comments) the MFI 13 period was not behaving in a bullish manner, it was pointing down whilst price and OBV were pointing up. Now we have the small correction many were talking about. The price has pulled back to the support of the the previous highs - going back nearly 3 years. There was a huge red volume bar last week, but for every seller is a buyer and some will see this as a buy opportunity, betting that this is a small pullback in a larger move up.
A bullish fact is the OBV sitting on its trend line. As often mentioned here the OBV is a slower indicator, but often more reliable than its faster moving cousin the MFI. I dont predict but I do attempt to gauge the probability of the next move. Price is on long term support and the OBV is on short term support. The MFI has not taken out its previous low. This bodes well for a pause in the price falling more, while the market waits for more news and data. A big one being interest rates and the other the fortunes of China. The Shanghai index has bounced up around 15% in the last 5 weeks. It is still in a solid down trend but early signs of recovery are evident. One would think this will imbue the western markets with more confidence. An interesting space to watch IMO.
Until next week,
Peter
52 week closing highs as of the Fridays close 15/3/2024
Below are the alerts from a scan of the ASX 300 and the 300 to 500
300: COE RDX RED VCX
300-500: EML LGI MAH NXL
Please note: in the eBook I wrote in 2016 (available for purchase on this website on the link below) I have made some changes to the system. If you have bought the eBook I am happy to email you a PDF explaining the changes I made, which from testing and trading does improve the system.
Here is the link to the eBook Mindful Trading using Winning Probability written in 2016 -
and the internationally published The Zen Trader (2022) - now in three languages.
IMPORTANT POINTS TO CONSIDER
A new 52 week high for this system is classified when the stock price is at its highest close (or equal to the highest close) counting back 52 weeks.
If a stock continues to make new highs, for example in the 53rd and 54th week, they are now regarded as ROLLING highs, not NEW 52 week highs.To clarify again, the buy signal for THIS system discussed is a NEW 52nd week or 1 year closing high, not a rolling high as is often given elsewhere.
The signals provided are WITHOUT A BULL FILTER.
The exit used FOR THIS METHOD is the 5/12 EMA crossover. Therefore, some stocks will be re signalling a new high buy signal if they have been recently exited by using the 5/12 exit within the last 12 months. This is important and you need to understand this.
Of course the 5 EMA needs to be above the 12 EMA to make the 52 week high valid, (otherwise we would be selling straight away) nearly always this is the case, but rarely if a stock spikes it is not.
So to repeat, the rules are: USING WEEKLY PARAMETERS!
Entry:
Share price to make a 52 closing (or equal to) week high (when selecting a buy, favour the cheapest stock)
The 5 ema to be above the 12ema
Exit:
if the 5 ema crosses below the 12 ema
The above system contains no position sizing, bull or bear filters or fundamental stock selection, these are discussed and taught to private clients or at my courses.
MARKET COMMENTS: As of the close on the 8/3/24: See charts below with an On Balance Volume indicator and the Money Flow Indicator using a 13 period

Price and OBV look good, the only concern is that bearish divergence on the 13 period MFI. As I said last week strong bull markets are a mixture of extreme optimism, FOMO and fear. Pullbacks can be sharp but they are often quick, then the market takes off again. Everyone (well not all but many) are trying to pick the top. That's bloody impossible.
The best thing is to manage risk by either taking some profit off the table but leaving a bit on to run. You can tighten stops too, if you are really getting nervous. The best thing of course (here we go again Pete you think) is to have a system and stick to it.
Until next week, I hope you enjoyed the news letter about divergences, here it is
https://www.easysharetradingsystems.com.au/products-and-services/archive
Peter
MARKET COMMENTS: As of the close on the 1/3/24: See charts below with an On Balance Volume indicator and the Money Flow Indicator using a 13 period

Because the US market is flying so is ours. One of the challenges we have of analysing the chart above is that at times it may not be the best indicator of how the Aus market is really performing. The Index above is dominated by a few sectors, mainly resources and banking so if those two sector rise so does this index. For example, the last 9 weeks BHP (and many other resource stocks) have been in a short term down trend. That price action in one of the biggest sectors - affects the look of the Index above.
If you consider that over the last few weeks (probably months) the Mindful system has been giving many buy signals across other sectors apart from the two big ones mentioned above. This indicates a broad based rally not being shown in the XAO Index.
Last week I mentioned I could see a rotation perhaps occurring. Last night in the US and UK there was a big rally in commodity stocks. Gold, Uranium, Lithium, Oil, Copper and others - all rose, one of the few laggards was Iron ore. One would "expect" a rally in those stocks on Monday, bearing in mind we should not expect anything, as anything can happen in the market. Your focus needs to be on probability and risk control not expectations and predictions.
So, the chart above. Well I often say price is the ultimate indicator - and in this case its leading the volumes. I suspect the indicators on the chart above will look a lot stronger after Mondays close.
Alerts below - lots of em.
Cheers
Peter
MARKET COMMENTS: As of the close on the 23/2/24: See charts below with an On Balance Volume indicator and the Money Flow Indicator using a 13 period

I have been mentioning the volume indicators for a few weeks now - they still look indecisive. Traders and investors are still deciding what to do, buy, sell or hold. There could be a rotation on in my opinion, as money looks for the best place to be. There is weakness in the Materials and Energy sectors which are some of the biggest sectors, its dragging down the XAO. Even Health had a fall this week but that was probably largely impacted by PME. But there is huge strength in other sectors like Tech, Discretionary, Industrials and Finance. This "rotational" strength is reflected in the number of 52 week closing highs this week.
PME: well I mentioned it last week and it bounced well rising over 12% this week. In my opinion it shows the value of learning to read oversold bullish divergences like PME was showing last week. I think I should write a paper on it for those interested - let me know if that's a good idea by writing to me here....
This email address is being protected from spambots. You need JavaScript enabled to view it.
Apologies: to those who logged in last week to Go Markets seminar to hear me present. A combination of technical and family occurrences made it impossible for me to attend. Mike Smith from Go Markets has kindly organised a special "catch up" conference this coming Wednesday night at 8pm. Below is the seminar link for Wednesday night
https://register.gotowebinar.com/register/8843010719428854103
Until next week, 52 week closing high alerts below - lots of them.
Peter
MARKET COMMENTS: As of the close on the 16/2/24: See charts below with an On Balance Volume indicator and the Money Flow Indicator using a 13 period
This week we have a conflicting signal on the volume indicators. You can see the MFI is coming down, but the OBV still looks strong. Also the ultimate indicator, which is the price, has finished the week strongly. So "two out of three ain't bad".
This week the Russell 2000 in the US was strong, although it looks a little overbought the rally is one to notice. Last night the US indexes slowed a little but commodities had a strong night, even lithium and gold rallied a bit, giving some hope to the suffering traders holding some of those stocks.
It's been another strong week for 52 week closing highs, they are listed below.
The chart below is PME, it's one of the feature charts in my presentation tomorrow. It took quite a hit, breaking decisively through the first line of support being the horizontal green line. It's very difficult emotionally when this happens, particularly if you have been disciplined and riding the trend since the entry. As you can see the moving average exit from the Mindful Trading book has not signaled a sell. You can see an older trade where it did around May 2023. Technically the MFI looks bearish but the more robust OBV looks ok, in fact it is showing a bullish divergence. The black EMA on the chart is the 24 (or 120 daily), price can often bounce off this level so for shorter term traders this is a stock to watch, in my opinion. This is not financial advice.

A reminder about my presentation, here is the link - I am on at 1pm
https://www.gomarkets.com/au/trading-mastery-2024/
Until next week!
Peter.
MARKET COMMENTS: As of the close on the 9/2/24: See charts below with an On Balance Volume indicator and the Money Flow Indicator using a 13 period

Not a lot of change from last week. The rally has slowed a bit while the market (traders and investors) take a breath. Money flow and OBV has pulled back as stops are tightened and some selling has happened, traders becoming more cautious. The indicators last week did suggest there could be a reversal or either some consolidation. It can be a tough time when markets are strong but fear kicks in, many sell too early to lock in profits, to then see the market rally again. That experience then results in frustration and FOMO, traders jump back in and then get caught with buying the top.
The answer? Have a method and stick to it, know your exit and your risk (trade sizing) should have been pre-planned BEFORE you bought. It will be interesting to see what happens this week, if the market kicks up again, consolidates (like this week) or falls. Speaking of dealing with emotion etc, please read the note below and check out the link.
Until next week!
Peter
PLEASE NOTE: I have been invited to be a presenter, with four other traders for a free webinar on the 17th Feb. The conference is sponsored by Go Markets and runs between 11am to 4pm and I will be speaking at 1pm. Registrations can be made on the link below and my talk is "Trading with a Zen Mind" a talk I gave at the ATAA National Conference last year and also in Shanghai (online) last weekend.
https://www.gomarkets.com/au/trading-mastery-2024/
MARKET COMMENTS: As of the close on the 2/2/24: See charts below with an On Balance Volume indicator and the Money Flow Indicator using a 13 period

Hi all, I am back. Well what a month its been. The talk was bullish, then bearish, now uncertain. Crikey! If ever there was a good example to ignore the news and follow your process its been the last month!
I said in my comments a month ago that the MFI could rally all the way up to the 80 reading, it still looks strong at the moment. However the OBV is showing a bearish divergence and price is hovering around old resistance, so it's a probability that there will be a pullback or some consolidation soon. Despite those things, the market is certainly still bullish and it is good to see the markets going up. There are 15 buy alerts this week for the eBook system Mindful Trading using Winning Probability. Wow, that is a lot, so the market certainly is raging.
PLEASE NOTE: I have been invited to be a presenter, with four other traders for a free webinar on the 17th Feb. The conference is sponsored by Go Markets and runs between 11am to 4pm and I will be speaking at 1pm. Registrations are not yet open but when they do I will post the link here. I will also send an email soon with more details. Hope to see you online.
Until next week, all the best
Peter
Hello folks, I am way on holidays for all of January. I will return to posting 52 week highs and market comments on my return.
Good luck with your trading and investing , Regards Peter
MARKET COMMENTS: As of the close on the 29/12/23: See charts below with an On Balance Volume indicator and the Money Flow Indicator using a 13 period

When we look at longer term charts (which very few people do) and take a moment to reflect, one could be entitled to ask the question "what was all the fuss about?
During Covid the OBV remained in an uptrend, it did so again 2 months ago when the market hovered around 7,000. At that time the MFI was deeply oversold and now it is approaching an over bought level. However, it could easily stretch up to the 80 level. Then the price could continue more and the MFI might then show a negative divergence as it has in the past (April 2019 and July 2020) . Of course that is all conjecture, although its worth remembering that nothing goes up in a straight line and at some point buyers will take a breather as they start to believe the market is too extended in the short term.
Only 2 months ago the talk was doom and gloom and recession - now its bull market into 2024 and beyond! I agree at the moment the chart looks strong, price and volumes are up and there appears to be no weakness. Volume last week was low as it was only a 3 day trading week and the same will happen for this coming 1st week in January. The low volume hasn't stopped a strong performance from the 52 week high system, registering another twelve this week. They are listed below.
Only one chart this week, hey its holiday time! Speaking of holidays I am overseas for most of January and Cynthia has told me I am not allowed to trade or be on the computer :)
I will do my best to post the weekly charts but if I don't, you know why!
Happy New Year
Peter
52 week closing highs as of the Fridays close 29/12/2023
Below are the alerts from a scan of the ASX 300 and the 300 to 500
300: ADT BHP BKW CBA CIA NXT PMV QUB SFR
300-500: BLY GQG QOR
Please note: in the eBook I wrote in 2016 (available for purchase on this website on the link below) I have made some changes to the system. If you have bought the eBook I am happy to email you a PDF explaining the changes I made, which from testing and trading does improve the system.
Here is the link to the eBook Mindful Trading using Winning Probability written in 2016 -
and the internationally published The Zen Trader (2022) - now in three languages.
IMPORTANT POINTS TO CONSIDER
A new 52 week high for this system is classified when the stock price is at its highest close (or equal to the highest close) counting back 52 weeks.
If a stock continues to make new highs, for example in the 53rd and 54th week, they are now regarded as ROLLING highs, not NEW 52 week highs.To clarify again, the buy signal for THIS system discussed is a NEW 52nd week or 1 year closing high, not a rolling high as is often given elsewhere.
The signals provided are WITHOUT A BULL FILTER.
The exit used FOR THIS METHOD is the 5/12 EMA crossover. Therefore, some stocks will be re signalling a new high buy signal if they have been recently exited by using the 5/12 exit within the last 12 months. This is important and you need to understand this.
Of course the 5 EMA needs to be above the 12 EMA to make the 52 week high valid, (otherwise we would be selling straight away) nearly always this is the case, but rarely if a stock spikes it is not.
So to repeat, the rules are: USING WEEKLY PARAMETERS!
Entry:
Share price to make a 52 closing (or equal to) week high (when selecting a buy, favour the cheapest stock)
The 5 ema to be above the 12ema
Exit:
if the 5 ema crosses below the 12 ema
The above system contains no position sizing, bull or bear filters or fundamental stock selection, these are discussed and taught to private clients or at my courses.
MARKET COMMENTS: As of the close on the 22/12/23: See charts below with an On Balance Volume indicator and the Money Flow Indicator using a 13 period

Well the rally continues! A pause was not what we got but a continuation. Another example of how difficult it can be to pick tops or bottoms and "going with the flow" is the most profitable but also the most difficult psychologically.
The price price blew through that overhead dotted trend line (producing twelve new 52 week closing highs) and dragged the volume indicators along for the ride. With no divergences to speak of the next resistance seems higher up the chart, perhaps around 6900. Next, let's look at the Small Ords index.
My trading friends will know I watch this index closely. That is because I tend to trade this sector more than the large caps as I think that is where more opportunities are - but I have been wrong so don't take my word for it! This sector was showing a strong bullish divergence around 9 weeks ago and its been straight up since then. It is a good sign to see this sector rally as it indicates a broad based rally in the market, something that has taken a while to happen. Next, the Russell 2000 in the US.

The Russell has finally broken above the 18 month resistance indicated by that dotted trend line, however it does appear over stretched to me with some negative divergence showing on the volume indicators - but I said that last week and the price just blew up past the neg divergence. However the SP500 (chart not shown) in the US looks like it could be double topping so we still need to be mindful that this rally has been strong and nothing is permanent. One more chart!
I did say last week I wanted to see more volume in this index of the gold stocks in Australia. The OBV has obliged and broken its down trend line but it's not the most convincing price and volume action. However during the Xmas trading season volumes in the spot gold market are thin because many traders are on holidays. This can result in some big moves in the gold price and also this sector, so I will be watching closely.
Merry Christmas,
Until next week
Peter
MARKET COMMENTS: As of the close on the 15/12/23: See charts below with an On Balance Volume indicator and the Money Flow indicator

Last week was quite a rally. I wont go into details as to why as I am sure many of you have read or heard the reasons. Focusing on the now it appears the index is approaching some resistance. The OBV is trending up well but it has not reached the high it made it January. Last week I mentioned a slight divergence between the price and the MFI. That divergence still exists and considering the rally the question needs to be asked "will we get a pause?" If market prediction is about probability I would think the answer is yes. Gold stocks.........

I often get questions about the gold stocks and I too find this an interesting sector. The price recovered strongly this week from an earlier pull back. The MFI is back testing the trend line, but - I would really like to see that OBV get stronger. Until that gets a clear break to the upside I think gold stocks will remain in a sideways pattern. Gold stocks do not always respond to a rising gold price, it depends on other factors such as general market strength, interest rates, the US dollar, inflation and others. It remains to be seen if the stars align for a Xmas gold stock rally.
Until next week
Peter
MARKET COMMENTS: As of the close on the 15/12/23: See charts below with an On Balance Volume indicator and the Money Flow indicator

MARKET COMMENTS: As of the close on the 8/12/23: See charts below with an On Balance Volume indicator and the Money Flow indicator
I often say trading is not about being right, but sizing risk, exits and sticking to a method. However it is nice to get a call correct now and again. Last week I said...
"With the recent rally in the Russell the XSO is playing follow its leader. I suggest you keep a close eye on the Russell for it may well tell us if the spec end of the Aus market will finally rally. Or has it started with the 14 buy signals?"
This week I have posted 2 charts, the XAO and the XSO. I will start with the XAO - you can clearly the volume coming into the index which is a bullish sign, stocks can't go up without buyers. There is a slight bearish divergence between the MFI and the price, however it is slight and to be expected after a big rally.
Moving on to the spec end of the market and the XSO, well it did follow the Russell up but the price is still in a technical down trend, however the volumes look very bullish particularly the OBV which has been trending up for a while and has now broken the down trend line I have drawn. Volumes in this index look even stonger than the XAO.
This week was another strong performance in the 52 week closing high system with 11 alerts.
Have a great week
Peter
MARKET COMMENTS: As of the close on the 1/12/23: See charts below with an On Balance Volume indicator and the Money Flow indicator

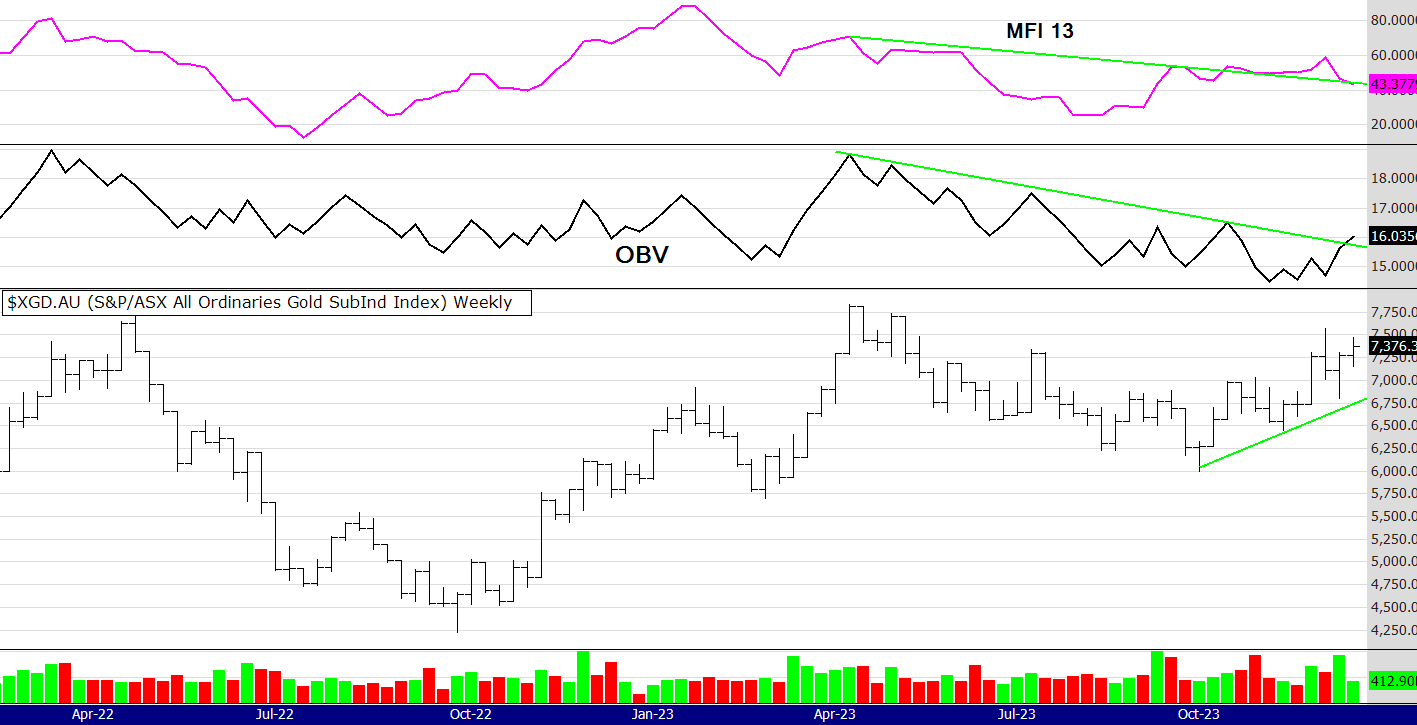
Well, I like to say "keep a mind of interest" not judgement. It certainly was an interesting week. The XAO above looks strong and it appears that the bull market is becoming more broad based. I say that because below you can see fourteen, yes 14, new 52 week closing highs. Last week I mentioned gold and so let's look at the Aussie gold index the XGD.

The reason I use the money flow index is that it is a more dynamic (faster) indicator than the slow old OBV. You could see a break up about 6 weeks ago signalling perhaps (no indicator is completely right or wrong) something was afoot. What I see now is a lack of follow through comparing the MFI to the price. Also a bearish divergence on the OBV when comparing that indicator with the price. You can see I have drawn those lines on the chart. Therefore some consolidation or even a pullback in the XGD would not surprise me.
One more opinion this week and its about the Russel 2000 in the US compared to the Aus Small Ords (XSO).
There has been much gnashing of teeth as to why the mid caps and small end of the Aussie market have not responded to the recent rally, so here is my reasoning. The Russell in the US has not joined in the rally and its been lagging the SPX, Nasdaq and the DOW. But! the correlation between the Russell and the XSO is obvious. Below is the chart of the Russell and the XSO
With the recent rally in the Russell the XSO is playing follow its leader. I suggest you keep a close eye on the Russell for it may well tell us if the spec end of the Aus market will finally rally. Or has it started with the 14 buy signals?
Until next week, Peter
PS: the Russel versus the XSO chart

MARKET COMMENTS: As of the close on the 24/11/23: See charts below with an On Balance Volume indicator and the Money Flow indicator

What stood out to me about this chart was the OBV. After breaking up over its down trend line it has now retraced back to it. The Money Flow Index indicator looks very similar to last week. There were six 52 week closing highs this week in the ASX 500 - see below. Considering the index had a flat week, six alerts is promising showing there are stocks moving up even though the broad based index may not be reflecting that. Bear in mind, and I repeat, the index is driven by resource stocks and banks, if they have a flat week then so does the index. I does not mean to say there are not opportunities in other areas.
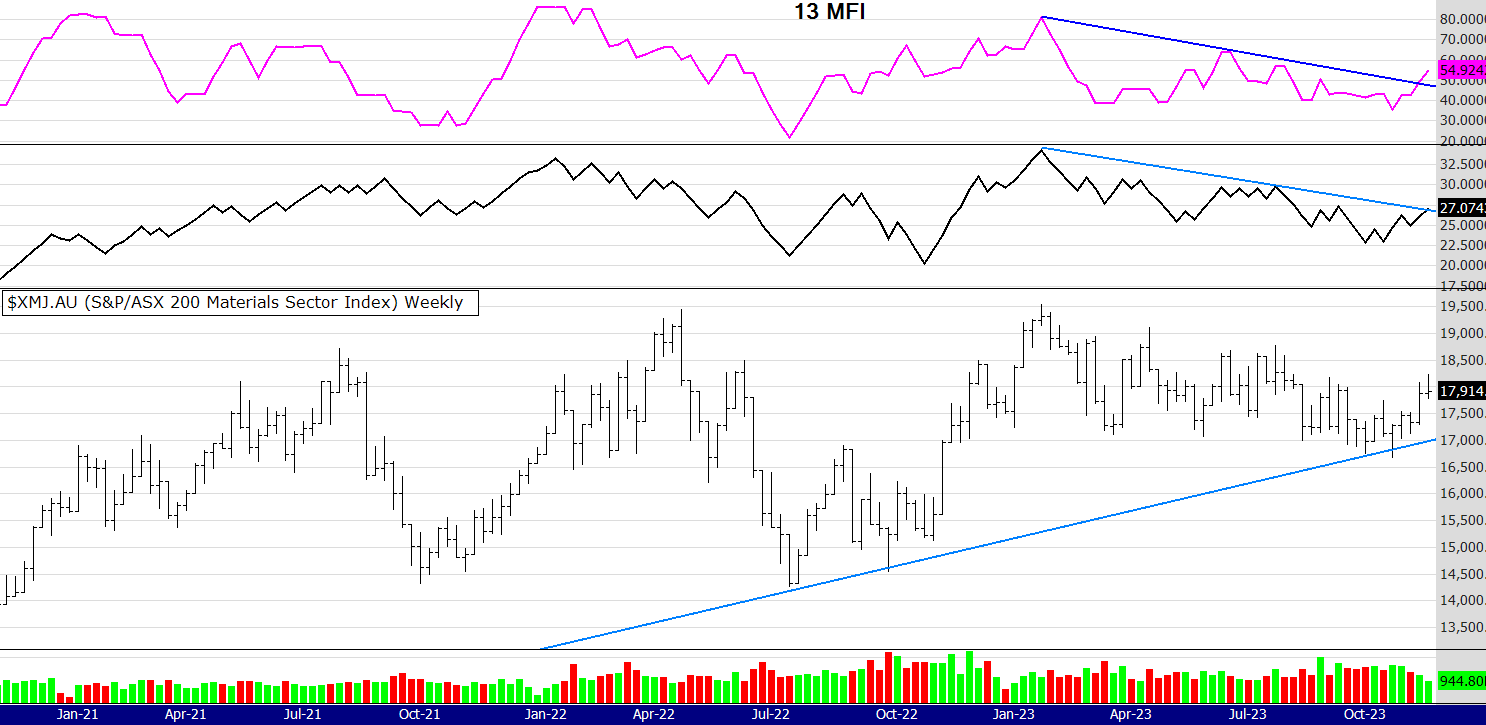
As I said in my video (link below if you have not seen it) the broad based rally appears elusive. I checked the Small Ords chart this morning (not shown here) and it is still struggling to show any conviction. However there has been some good price action in some small resource stocks, perhaps because the XMJ is showing strength. I also mentioned in the video that the XMJ was looking very interesting and could help support and even rally the All Ords. Looking at the chart below you can see that is the case.
What will it take for gold shares to rally? Some had a strong week but others not. Last night in the US gold rose above 2000 yet the gold share indexes went "ho hum". Look at the chart below. It shows the correlation in price between the gold price and the XGD, which is the gold share index in Australia. As you can see it normally correlates closely but recently it has not. now, whats happening? Well either the gold price is overbought or Aussie gold shares are oversold. If the sector decides to play catch up I think there is a quick 10% profit opportunity in the majors and perhaps a lot more in the juniors - so I am watching this space closely.
The other sector also dragging the chain versus its commodity price is uranium. Some of the Aussie uranium miners are not following the commodity price and it is possible that they also play the catch up game.

So that's all a bit to digest and if you find it overwhelming remember the Zen advice of observing and looking with a mind of interest, rather than trying to work it all out. By having a "mind of interest" and not trying to get it all right all the time takes the pressure off. This is a game of probability not right or wrong and your trading plan needs to reflect that philosophy.
I mentioned the video discussing the markets in more detail, its about 2 weeks old now but they are long term charts discussed and still relevant.
Have a great week
Peter
MARKET COMMENTS: As of the close on the 17/11/23: See charts below with an On Balance Volume indicator and the Money Flow indicator

Well it was an interesting week for sure! Price continues to rise and the volumes look strong, in fact both the volume indicators are leading price - as you can see from the fact they are both breaking their down trend lines to the upside. Also there are 5 new 52 week closing highs this week, see below.
I notice some strength too in the lower end of the market, namely the Small Ords. Mind you it is still in a downtrend but volumes are increasing and it looks promising. Will we finally get a broad based rally? Too early to say but the bears have certainly been pushed back into their caves for the time being.
I have recorded a video discussing the markets in more detail, if you want a look click here.
Have a great week
Peter
MARKET COMMENTS: As of 10/11/23: See charts below with an On Balance Volume indicator and the Money Flow indicator
Its been an interesting two weeks on the XAO. First of all we had the "perfect storm" of the US Fed not raising rates and higher commodity prices - the Aus market loved that combination. Then we had the RBA raise rates and commodity prices fell - the Aus market hated that combination and stock prices fell.
Last night in the US the Nasdaq again rose and dragged up the other indexes. The rally in the US is not yet broad based, for example the Nasdaq rose over 2% yet the Russell 2000 could only manage a little over 1%.
Here in Aus the trend is sideways to down - yet the MFI is showing some promise. I think we need a rally in commodity prices and other sectors to to push this index up. Gold and gold shares remain uncertain, as does copper and oil. Its going to be an interesting week.
Until next week stay well.
Peter
MARKET COMMENTS: As of 4/11/23: See charts below with an On Balance Volume indicator and the Money Flow indicator
This week I have again decided to focus on the SP500 in the U.S.
I also think its worth repeating last weeks comments.
"You may get bored of me repeating the same thing - we live, trade and invest in the present, not the Armageddon of the future that many believe is inevitable. Keeping that philosophy in mind you can see that there is a strong trend line supporting the price. The OBV also has a trend line and if you look closely you can see a slight (but small) bullish divergence between price and OBV volume at the right edge of the chart.The more dynamic money flow is still trending down but is in over sold territory - the same it was during the Covid crash. It remains to be seen what happens to the above index, 4,000 points seems like a magnet and its not far away. In my opinion if it reaches that level the probability would be for a bounce, I notice some fundamental analysts are starting to call sectors of the market good value.These market corrections can be very difficult psychologically, something I wrote extensively about in my book The Zen Trader (link below). Have a good week and try and keep a mind of interest and observation, not one of panic and despair"
Well what a difference a week can make. After the Fed meeting in the US many now think interest rate rises have peaked there, also they have a strong labour market and inflation is falling. Sounds like Goldilocks economy stuff and the market responded accordingly.
Here in the land of OZ it got pretty good too. Of course we correlate with the US index but with commodity prices rising, banks following the US lead and the $A rising the XAO rallied hard. One could ask, what was all the worry about?
Of course there are still concerns Michelle Bullock and Australian Reserve Bank board will raise interest rates on Tuesday - however it's impossible to predict (as was proven last week) so let's carry on and do our best. Doing our best is having some methodology and doing the best we can at sticking to it.
In saying that there are five 52 week closing highs in the All Ords this week and they are listed below.
All the best,
Peter
MARKET COMMENTS: As of 27/10/23: See charts below with an On Balance Volume indicator and the Money Flow indicator

This week I decided to focus on the SP500 in the U.S.
You may get bored of me repeating the same thing - we live, trade and invest in the present, not the Armageddon of the future that many believe is inevitable. Keeping that philosophy in mind you can see that there is a strong trend line supporting the price. The OBV also has a trend line and if you look closely you can see a slight (but small) bullish divergence between price and OBV volume at the right edge of the chart.
The more dynamic money flow is still trending down but is in over sold territory - the same it was during the Covid crash. It remains to be seen what happens to the above index, 4,000 points seems like a magnet and its not far away. In my opinion if it reaches that level the probability would be for a bounce, I notice some fundamental analysts are starting to call sectors of the market good value.
These market corrections can be very difficult psychologically, something I wrote extensively about in my book The Zen Trader (link below). Have a good week and try and keep a mind of interest and observation, not one of panic and despair.
All the best, Peter.
https://www.easysharetradingsystems.com.au/products-and-services/e-books
MARKET COMMENTS: As of 20/10/23: See charts below with an On Balance Volume indicator and the Money Flow indicator
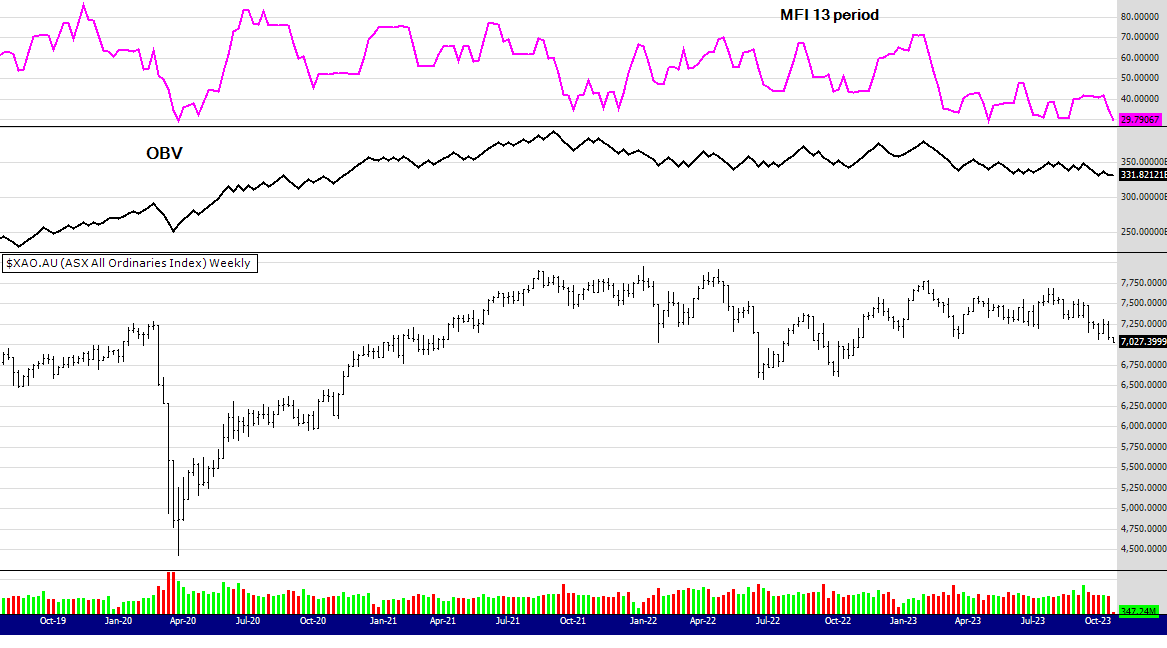
I dont use many indicators on my chart except price and volume. As you can see price and volume are trending down so it looks quite bearish. The SP500 in the US does appear to have some short term support so it may help this index get a bounce. Despite the bearish mood here, there were two 52 week closing highs in the XAO and I have listed them below.
I need to mention too this chart was posted midday Monday 23rd, so the last bar on the chart shows Monday mornings price action - as I have live data.
Please note the dates on the following comments, there is a big gap in the timeline as I took a break to complete and promote my book The Zen Trader.
MARKET COMMENTS: As of the close 20/1/23: See charts below with an On Balance Volume indicator, a bar chart and a 12 EMA.
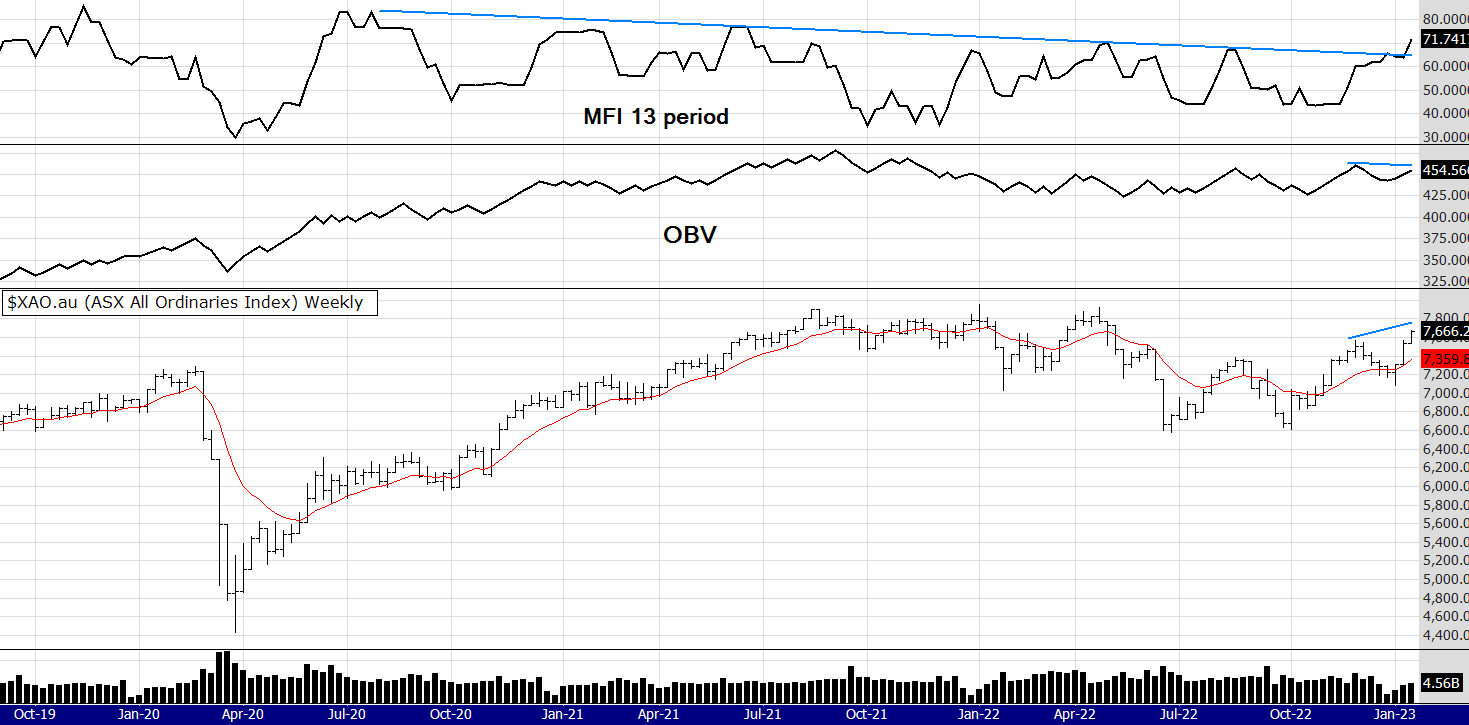
This is a very interesting chart. You can see I have included two volume indicators. The more dynamic Money Flow breaking a 2.5 year down trend line yet the more conservative OBV lagging a little (I think due to low holiday volumes).
Overall I think this is as positive as it gets, although some doubt remains about the global picture this chart is suggesting there are few problems in the Australian market. One would expect considering probability (do not expect anything) the above index to pause around the old highs of 7800 to 7900 or even reach 8000. At those levels the volume indicators will be at over bought areas, then depending on the global situation will push through or take a breather.
We just "don't know" at what levels the market will reach, pause or fall. What we do know is what is happening NOW. The index is up and there appears to be good breadth in this rally. If you want to learn more about market breadth I have posted a link below.
Until next week,
Regards
Peter
https://www.investopedia.com/terms/m/market_breadth.asp
MARKET COMMENTS: As of the close 13/1/23: See charts below with an On Balance Volume indicator, a bar chart and a 12 EMA.

"This coming week will be the real test to see if the positivity continues. I think it will. That is not a prediction but a statement based on probability - by looking at the OBV indicator. It is rising and looking strong, a bullish sign"
Well that is what I said last week - sometimes during the week when I get caught up in the noise (yes I still do that) I remind myself to go back and read what I wrote here. Often it is right! Of course trading is not about being right or wrong but having a method and managing risk, but we are all human and sometimes forget that simple equation.
So my comments this week? Looks like more of the same doesn't it? The mood seems to have flipped to bullish. I will show you one more chart. The eBook system I wrote back in 2016 has turned up. The graph below shows a test over 3 years (simulation only) and you can clearly see it was a terrible time to start the system just before Covid.
The point I am making here (more so than the result of the method) is that the equity is turning up - and the system is fully invested in the market holding no cash. I see that as a positive for this market in general.
Thanks for reading, Peter

MARKET COMMENTS: As of the close 6/1/23: See charts below with an On Balance Volume indicator, a bar chart and a 12 EMA.

Happy New Year! The market recovery continues with volume support as well. However volume was low this week with reduced trading holiday hours. This coming week will be the real test to see if the positivity continues. I think it will. That is not a prediction but a statement based on probability - by looking at the OBV indicator. It is rising and looking strong, a bullish sign.
Alerts listed below.
MARKET COMMENTS: As of the close 16/12/22: See charts below with an On Balance Volume indicator, a bar chart and a 12 EMA.

It is still a waiting game on the XAO. Uncertainty is dominant. The resources sector is holding the XAO up at the moment, if that falls we will see a fall in the index.
Merry Xmas to you all.
Regards
Peter
I was away this weekend on a meditation retreat - with no internet service. So these updates were posted on Tuesday 13th and are valid for last weeks close of the 9/12/22.
MARKET COMMENTS: As of the close 9/12/22: See charts below with an On Balance Volume indicator, a bar chart and a 12 EMA.
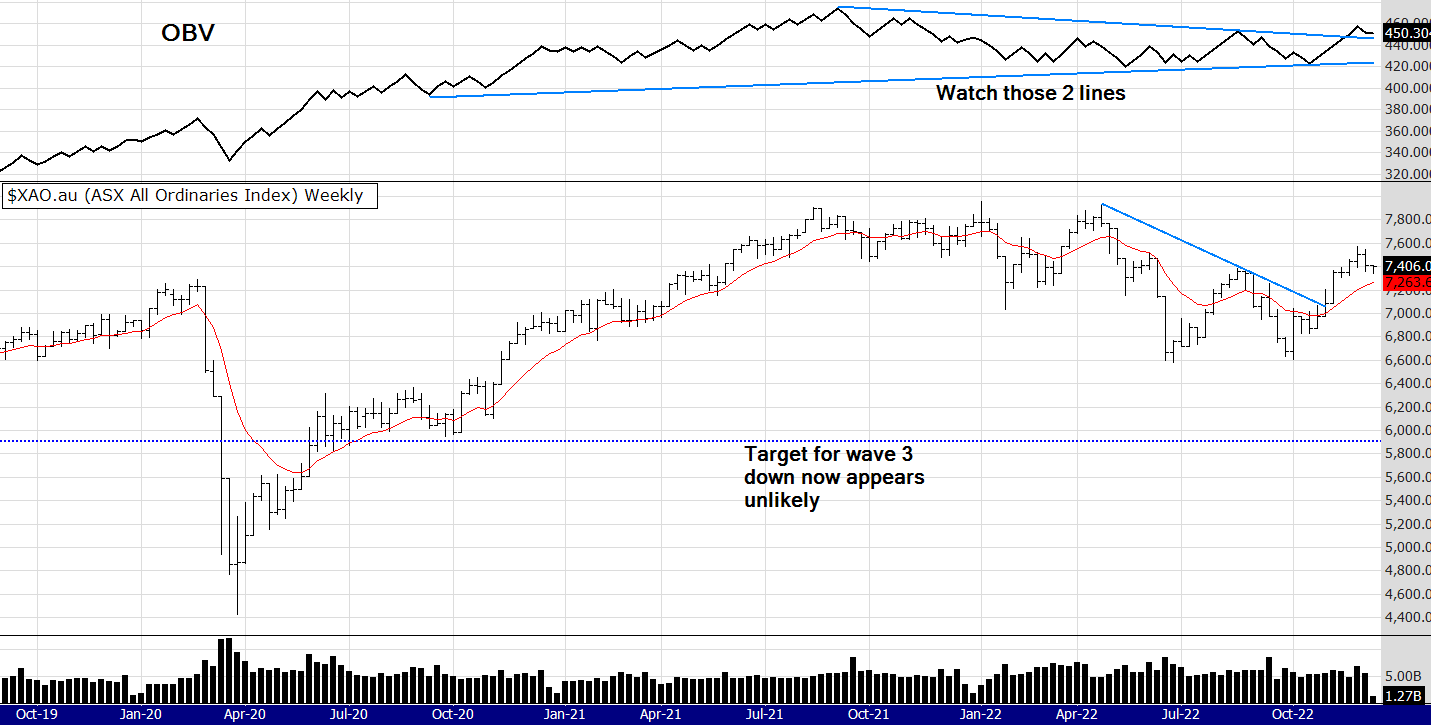
Not much change this week from last week, in that the XAO is trending up on a medium term time frame. We did get the pullback that I mentioned was possible (in last weeks post). It's now a wait and see game at the moment. The volumes are looking good, however as we know concerns remain about interest rates and inflation.
Short and sweet comments this time - as we wait to see how the markets react to announcements later this week (CPI and interest rates)
Have a good week.
Regards
Peter
MARKET COMMENTS: As of the close 2/12/22: See charts below with an On Balance Volume indicator, a bar chart and a 12 EMA.

The XAO powers on and up. Resource stocks driving the index, although a scroll through the Aussie indexes this week shows strength in other sectors too. A strong rebound in tech, banks going up, consumers index had a rebound and interestingly the energy sector falling. Is that a sign energy costs will fall? - if the market is selling off energy stocks.
Gold of course had a strong 2 weeks. As I write it's hovering around the 1800 mark. However the $US dollar looks oversold in the short term and if it rebounds it will put pressure on gold and gold stocks.
The markets have been on a tear since the rebound 6 weeks ago. On a daily chart the XAO is looking a little over bought - as can be seen on the chart below using the Money flow Index (10 period or 2 weeks) . Indicators are just that, indications. This price could tear on, however its an early warning sign (along with the $US) to think that it is unlikely for this mini bull to keep charging.
Until next week
Peter
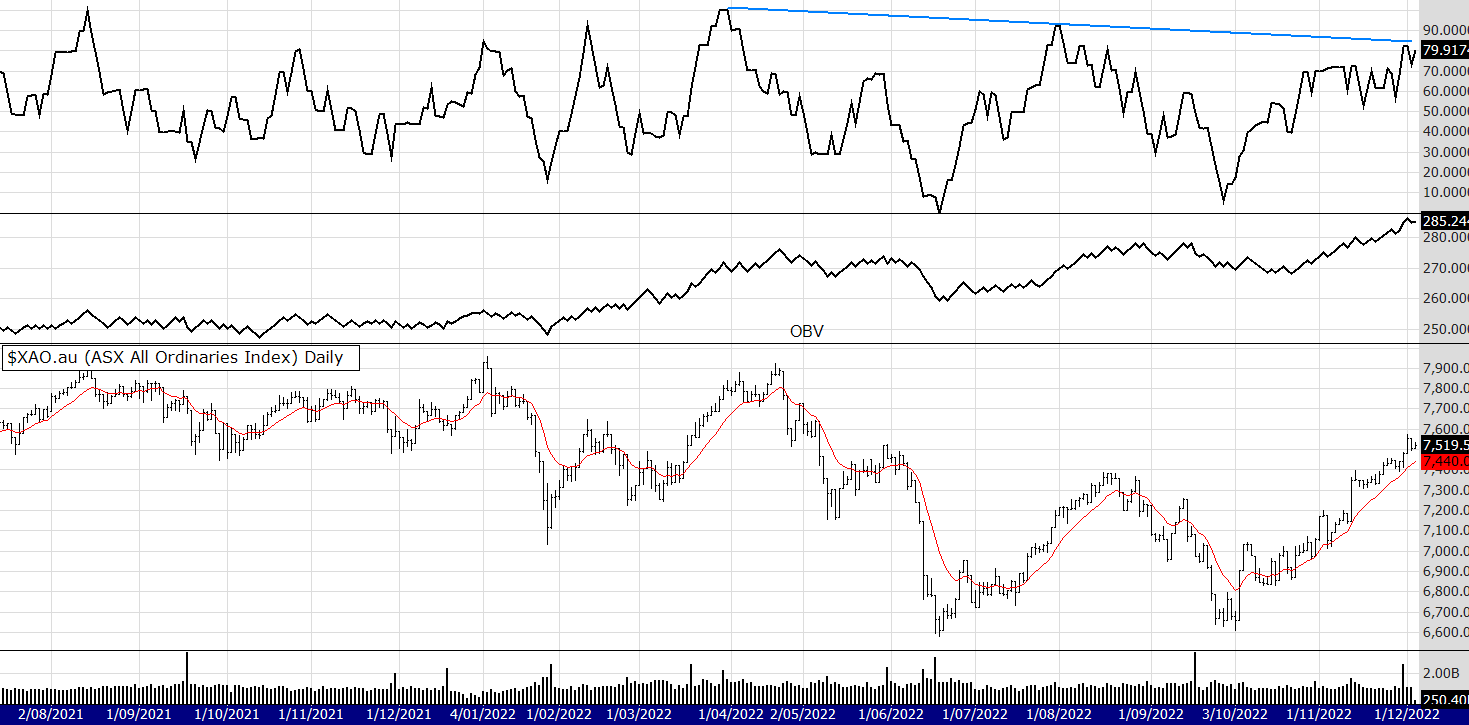
52 week closing highs as of 2/12/22
A new 52 week high for this system is classified when the stock price is at its highest close (or equal to the highest close) counting back 52 weeks.
If a stock continues to make new highs, for example in the 53rd and 54th week, they are now regarded as ROLLING highs, not NEW 52 week highs.To clarify again, the buy signal for THIS system discussed is a NEW 52nd week or 1 year closing high, not a rolling high as is often given elsewhere.
The signals provided are WITHOUT A BULL FILTER.
The exit used FOR THIS METHOD is the 7/12 EMA crossover. Therefore, some stocks will be re signalling a new high buy signal if they have been recently exited by using the 7/12 exit within the last 12 months. This is important and you need to understand this.
Of course the 7 EMA needs to be above the 12 EMA to make the 52 week high valid, (otherwise we would be selling straight away) nearly always this is the case, but rarely if a stock spikes it is not.
So to repeat, the rules are: USING WEEKLY PARAMETERS!
Entry:
Share price to make a 52 closing (or equal to) week high (when selecting a buy, favour the cheapest stock)
The 7 ema to be above the 12ema
Exit:
if the 7 ema crosses below the 12 ema
The above system contains no position sizing, bull or bear filters or fundamental stock selection, these are discussed and taught to private clients or at my courses.
Remember these scans are not using a Bull filter. The signals are for the simple 52 week CLOSING high entry and 7/12 EMA crossover exit system only.
ASX 300
BGL CMM GOR AIA
ASX 300-500
A4N ARX
52 WEEK HIGHS for the eBook system: (That does use a Bull filter) If you are confused about the use of filters, I suggest you read well the comments about that above.
BGL CMM GOR AIA
MARKET COMMENTS: As of the close 18/11/22: See charts below with an On Balance Volume indicator, a bar chart and a 12 EMA.
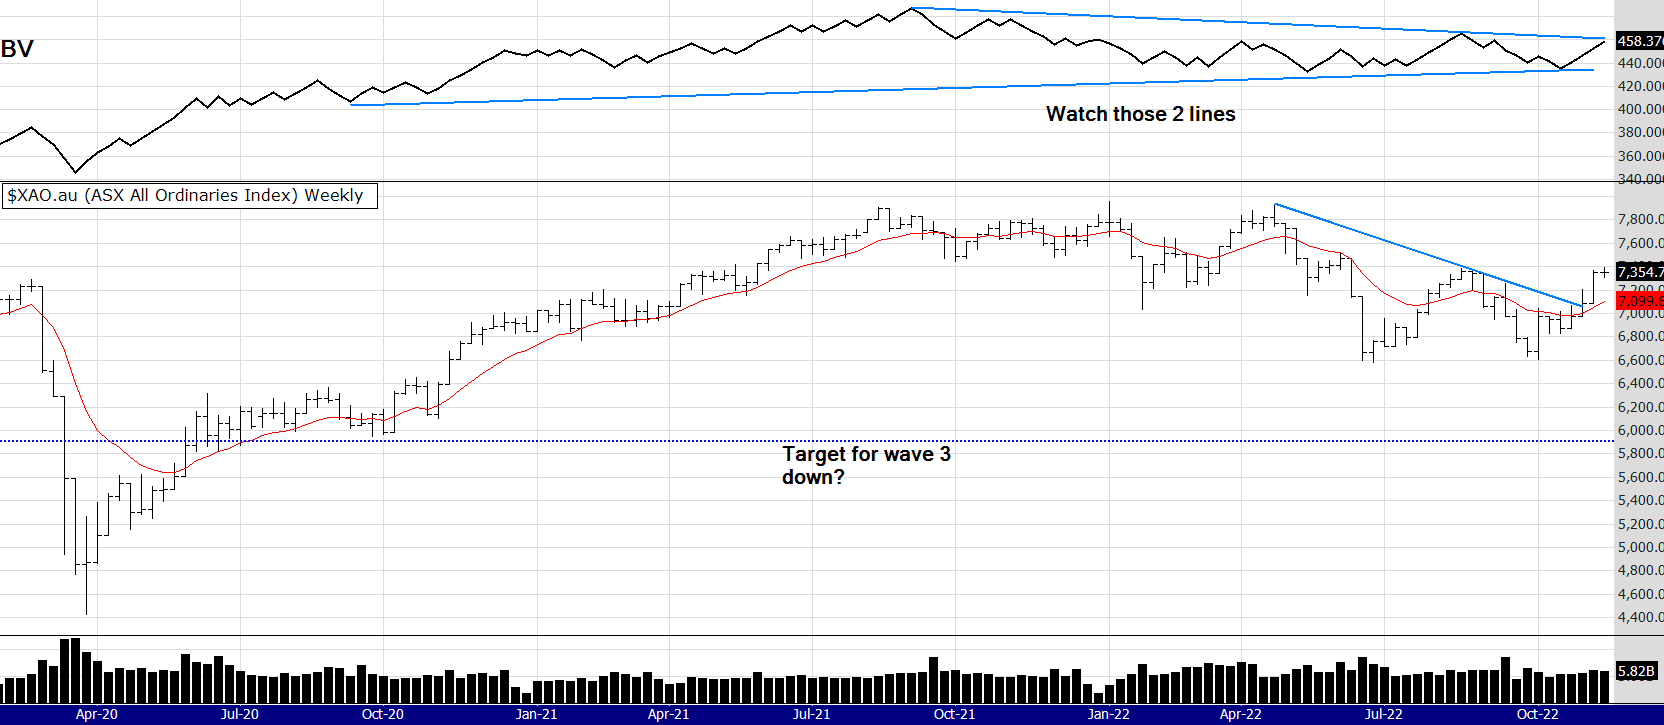
It would seem the chance of a wave 3 down is unlikely? If the OBV breaks above the overhead trend line it could be off to the races. Things have changed quickly, it is just another reminder to keep an open mind, not to be caught up in the thinking of the herd. A herd that reacts anxiously to every piece of news - thinking the worst.
The index has now "double topped" with its high 13 weeks a go. The OBV has a slight negative divergence between those 2 tops.
Also gold has paused but remains to be seen if it holds its levels or pulls back a little more.
Have a great week and good luck with your investing or trading.
Peter
MARKET COMMENTS: As of the close 11/11/22: See charts below with an On Balance Volume indicator, a bar chart and a 12 EMA.
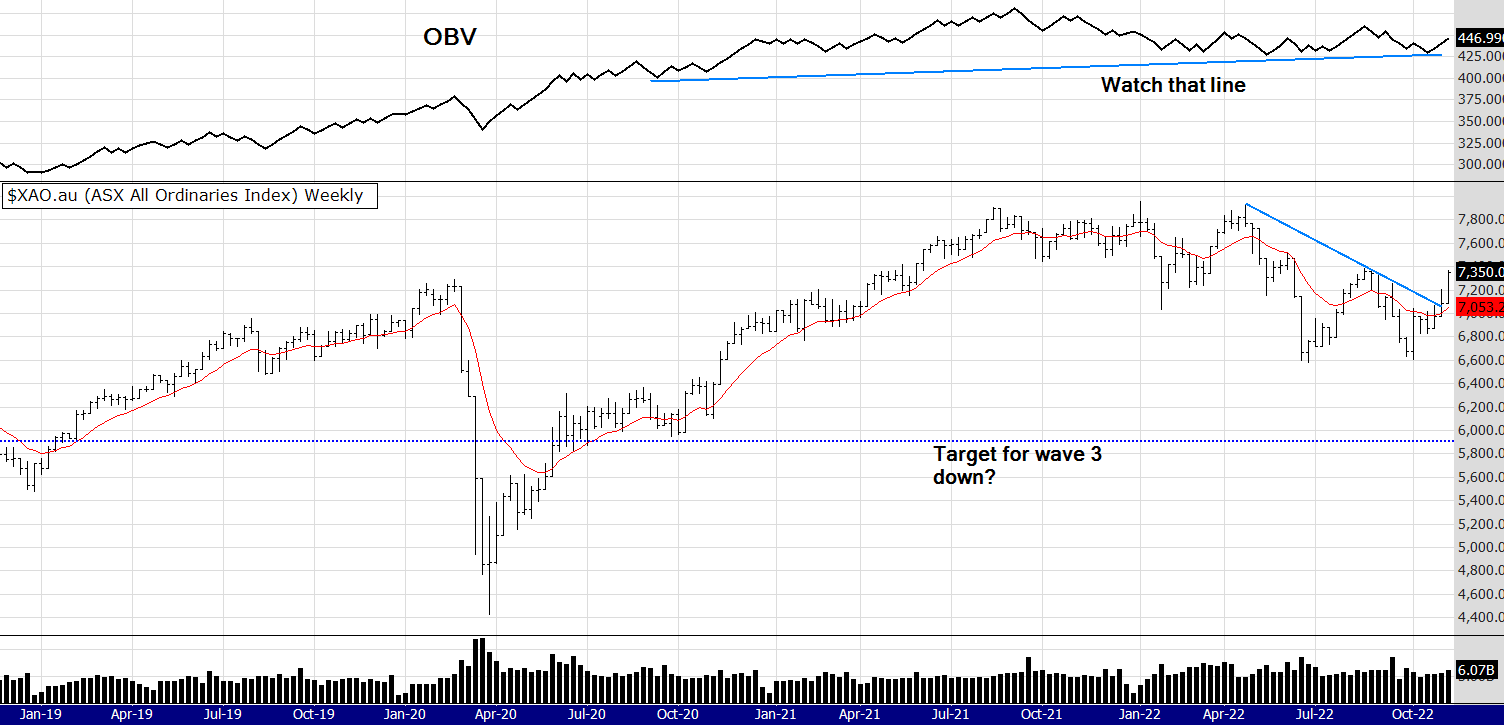
Not a lot to say, just look at that chart and perhaps read what I wrote last week.
"Well, this is a significant situation we are now in......
The bull filter is now in positive territory.....
Of course the question is "is this just a bear market rally", for those of you that have been following for some years and have also read my book The Zen Trader will know the answer. Don't Know. So what is the course of action? If you are choosing to play the game of trading the answer is, 1/ invest an amount you are comfortable with 2/ make sure you know your exit"
I will mention the gold rally, gold is difficult to trade, it does things like it did this week, explode into a rally. You really have to be in the gold market BEFORE it does that or act very quickly. Gold can also have quick and hard pullbacks. Many gold stocks are now extended well above their mean average moving averages, a pull back would not surprise. If that happens I would be buying or adding to gold stocks - favouring the ones with the strongest fundamentals.
Peter
MARKET COMMENTS: As of the close 4/11/22: See charts below with an On Balance Volume indicator, a bar chart and a 12 EMA.
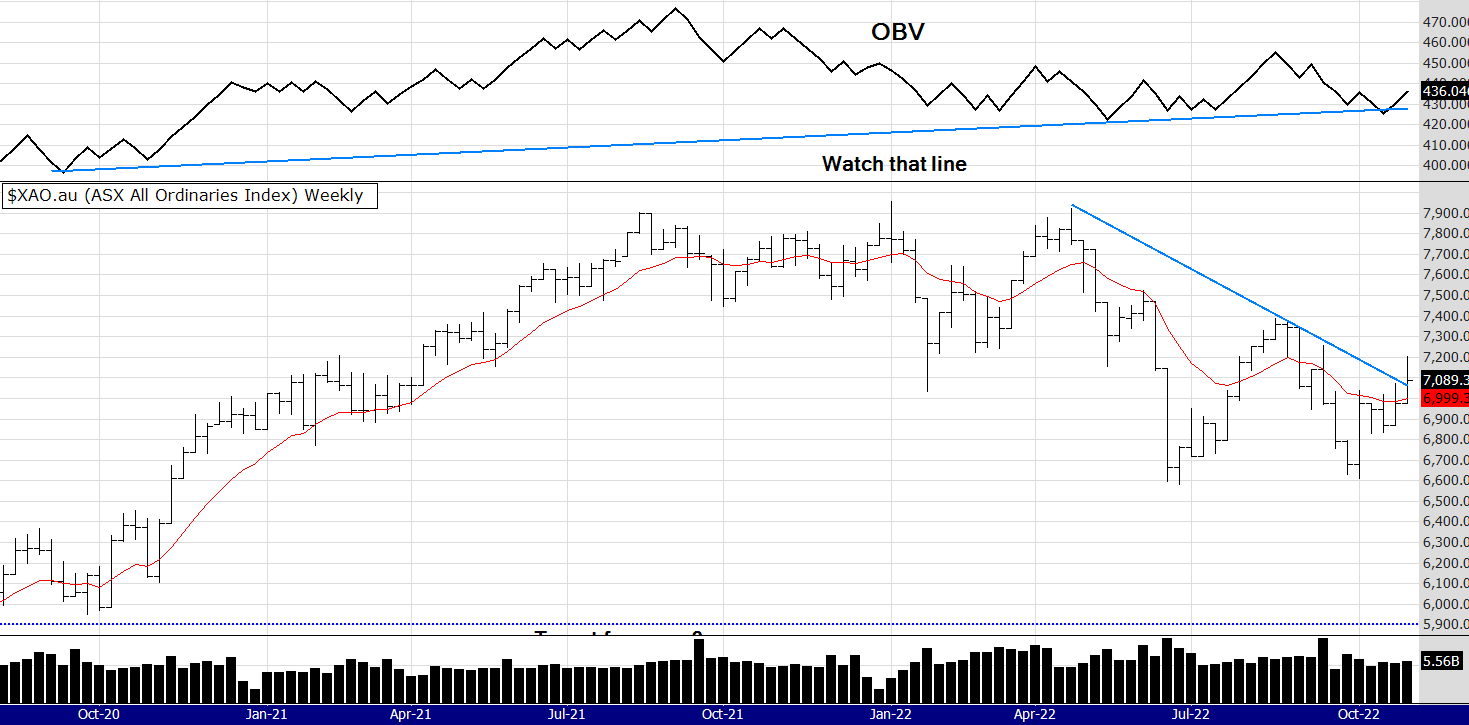

Well, this is a significant situation we are now in. I have posted 2 charts above, one of he XAO and the bull filter for the eBook system and the other chart showing the performance of the system over the last 2 years. You can clearly see it has been in a pullback phase and is about 50% in cash.
The bull filter is now in positive territory and there are 9 buy signals in the ASX 300 this week, they are posted below but here they are again ARN CRN DBI IAG KAR LOV PWH QAN SYR.
Of course the question is "is this just a bear market rally", for those of you that have been following for some years and have also read my book The Zen Trader will know the answer. Don't Know. So what is the course of action? If you are choosing to play the game of trading the answer is, 1/ invest an amount you are comfortable with 2/ make sure you know your exit.
Last week I posted a chart of the eBook system trading only stocks with set fundamental criteria. In this current market the growth stocks are giving way to stocks that have better fundamentals, as investors concern themselves about companies just surviving - not the sometimes false promise of thriving. Of course we want both! - but the emphasis has shifted to the former in these cautious times.
See you next week
Peter
MARKET COMMENTS: As of the close 28/10/22: See charts below with an On Balance Volume indicator, a bar chart and a 12 EMA.

It was looking dire last week as the OBV trend line was broken, and the index has some work to do. It needs to break the over head down trend line, and volume needs to show more strength in my opinion. The bull filter from the eBook system has not yet triggered but gee - it was close.
Some of my shorter term weekly systems (with quicker bull filters) have signaled to buy. Also stock lists with good fundamentals are out-performing the market. So it's not all doom and gloom, is it? Is the world panicking again? Do we have a similar situation when Covid hit - or are things more serious? Most would probably say it is more serious - too many headwinds. However, there are opportunities in this market - this Australian market, which is performing much better than OS markets.
Below: the original eBook system (on the products and services page of this site) on a group of fundamental stocks the last 2 years!
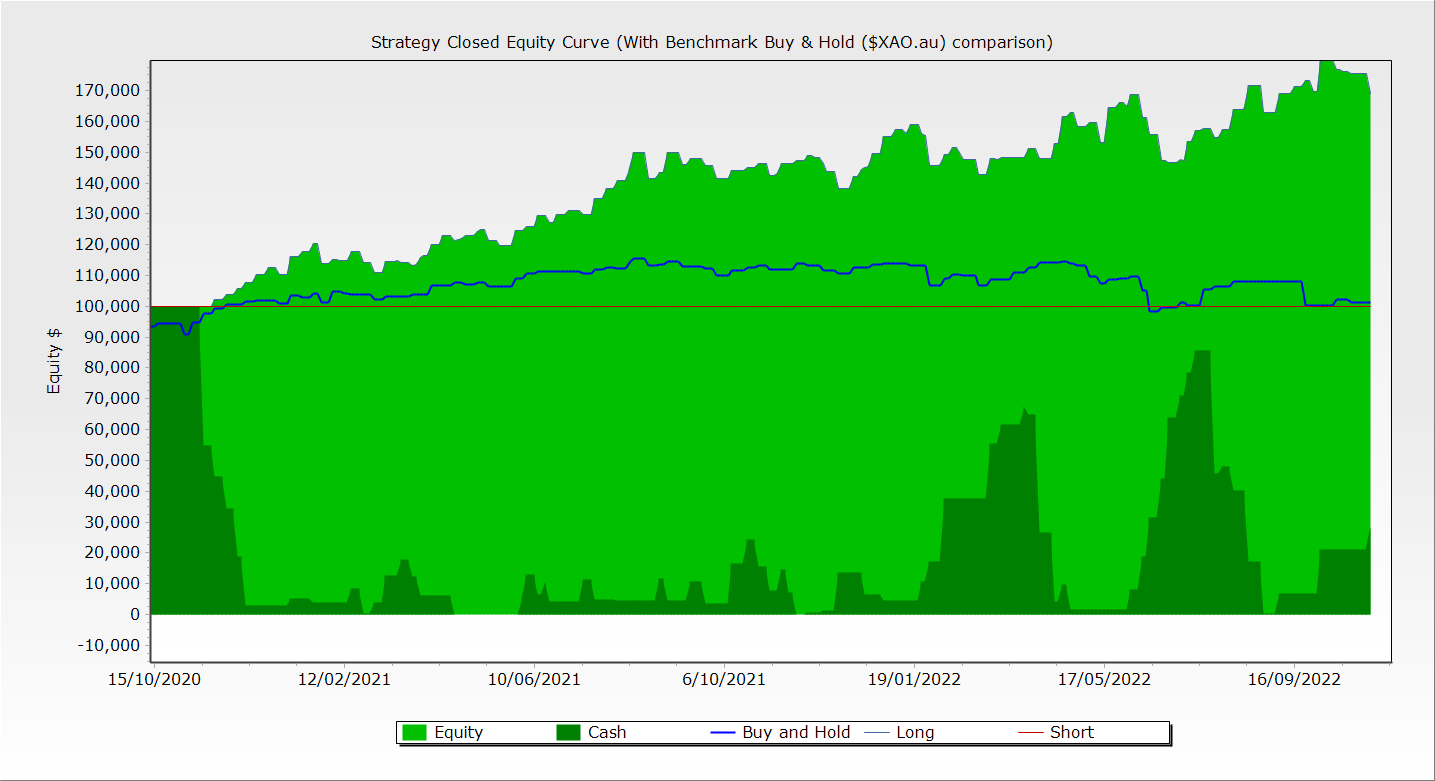
Peter
MARKET COMMENTS: As of the close 14/10/22: See charts below with an On Balance Volume indicator, a bar chart and a 12 EMA.

Apologies I missed updating the alerts last week. For your information there was one just alert for the ASX 300 last week and it was KAR.
The XAO is showing amazing resilience compared to OS markets. I read a great article last week (unfortunately I cant find it) explaining that it was the resources sector holding up the Aus market. However the general trend is still down and as I mentioned some weeks ago if that OBV line on the chart above breaks to the downside it will be an ominous sign. The target line of wave 3 down may will be reached.
If you are mostly out of the market its a good time to do some more study, review, work on your mindset and prepare for better times.
Until next week
Peter
MARKET COMMENTS: As of the close 30/9/22: See charts below with an On Balance Volume indicator, a bar chart and a 12 EMA.

The XAO continues to look to breach that OBV line. Markets world wide had a small bounce on the news of the Bank of England buying bonds. Is it a pivot? The pivot theory has been touted for a while - that the Fed will not persevere inflicting pain upon the markets. Well, if you have read my book and the chapter "Don't Know", you will realise that attempting to know is a waste of time.
In the meantime I hope you have a system, are sticking to it to the best of your ability or are out of the market. Let's see what happens this week!
To get more regular comments about the markets I am posting often on twitter, here is my link
Until next week
Peter
52 week closing highs as of 30/9/22
A new 52 week high for this system is classified when the stock price is at its highest close (or equal to the highest close) counting back 52 weeks.
If a stock continues to make new highs, for example in the 53rd and 54th week, they are now regarded as ROLLING highs, not NEW 52 week highs.To clarify again, the buy signal for THIS system discussed is a NEW 52nd week or 1 year closing high, not a rolling high as is often given elsewhere.
The signals provided are WITHOUT A BULL FILTER.
The exit used FOR THIS METHOD is the 7/12 EMA crossover. Therefore, some stocks will be re signalling a new high buy signal if they have been recently exited by using the 7/12 exit within the last 12 months. This is important and you need to understand this.
Of course the 7 EMA needs to be above the 12 EMA to make the 52 week high valid, (otherwise we would be selling straight away) nearly always this is the case, but rarely if a stock spikes it is not.
So to repeat, the rules are: USING WEEKLY PARAMETERS!
Entry:
Share price to make a 52 closing (or equal to) week high (when selecting a buy, favour the cheapest stock)
The 7 ema to be above the 12ema
Exit:
if the 7 ema crosses below the 12 ema
The above system contains no position sizing, bull or bear filters or fundamental stock selection, these are discussed and taught to private clients or at my courses.
Remember these scans are not using a Bull filter. The signals are for the simple 52 week CLOSING high entry and 7/12 EMA crossover exit system only.
ASX 300
NONE THIS WEEK
ASX 300-500
NONE THIS WEEK
52 WEEK HIGHS for the eBook system: (That does use a Bull filter) If you are confused about the use of filters, I suggest you read well the comments about that above.
None this week. The Bull filter is negative.
MARKET COMMENTS: As of the close 23/9/22: See charts below with an On Balance Volume indicator, a bar chart and a 12 EMA.

As I mentioned last week I regard the OBV volume lines the ones to watch. At my talk in Adelaide on Wednesday 21st I discussed the ability of some stocks to make 52 week closing highs, a good example of that is the stock IGO, making a 52 week closing amidst a strongly down trending market.
At that talk I discussed the possibility of a wave 3 down to around the 6000 level. I did notice in the audience - a few shaking of heads and disbelief. One of the most important things whilst trading or investing is to keep an open mind. One analysts view is just that - one view. Anything can happen in the markets and we really should attempt to embrace all possibilities.
It looks like Monday will be another big down day, after the US markets falling hard on Friday night.
Until next week
Peter
MARKET COMMENTS: As of the close 16/9/22: See charts below with an On Balance Volume indicator, a bar chart and a 12 EMA.

The chart above shows a few possible targets for this down trending market - despite many stocks making new 52 week closing highs (see below) the major index is slipping. You can see the fib retracement, not something I normally use but many do, so it may be worth considering. Also a blue dotted line for the Elliot wave fans, is that the 3rd red wave down level? - could be, notice it is around the same level as the Fib 61.8%.
I personally think that OBV line is the one to watch, if that up trend in volume breaks down it will be a negative sign.
I will be discussing this chart and many others at my talk in Adelaide on Wednesday 21st Sept. Hope to see you there!
Peter
MARKET COMMENTS: As of the close 9/9/22: See charts below with an On Balance Volume indicator, MFI 13, a bar chart and a 12 EMA.

One of the things I talk about in the book The Zen Trader is the ability to look at the market (and your trades) with a mind of interest, not worry, judgement, stress etc. Looking at the chart above with that state of mind, can you see how fascinating it really is? Despite all the doom and gloom, in this present moment (which is all we really have) the XAO is showing some strength - particularly the volume indicators.
Another testamant to the stength of certain parts of the market are the 52 week closing highs, listed below. Trading and investing is a combination of taking measured risk, detaching from outcome and staying present. Of course things can change very quickly - a reason most traders use stop loss orders or targets.
The eBook system (written and published in 2016) is still performing, although not as well as it has. This is something I will be discussing (along with suggested improvements) at my upcoming presentation at the Adelaide branch of the ATAA. Below is a link for you to read more about the content of the presentation. Hope to see you there.
Until next week
Peter
52 week closing highs as of 9/9/22
A new 52 week high for this system is classified when the stock price is at its highest close (or equal to the highest close) counting back 52 weeks.
If a stock continues to make new highs, for example in the 53rd and 54th week, they are now regarded as ROLLING highs, not NEW 52 week highs.To clarify again, the buy signal for THIS system discussed is a NEW 52nd week or 1 year closing high, not a rolling high as is often given elsewhere.
The signals provided are WITHOUT A BULL FILTER.
The exit used FOR THIS METHOD is the 7/12 EMA crossover. Therefore, some stocks will be re signalling a new high buy signal if they have been recently exited by using the 7/12 exit within the last 12 months. This is important and you need to understand this.
Of course the 7 EMA needs to be above the 12 EMA to make the 52 week high valid, (otherwise we would be selling straight away) nearly always this is the case, but rarely if a stock spikes it is not.
So to repeat, the rules are: USING WEEKLY PARAMETERS!
Entry:
Share price to make a 52 closing (or equal to) week high (when selecting a buy, favour the cheapest stock)
The 7 ema to be above the 12ema
Exit:
if the 7 ema crosses below the 12 ema
The above system contains no position sizing, bull or bear filters or fundamental stock selection, these are discussed and taught to private clients or at my courses.
Remember these scans are not using a Bull filter. The signals are for the simple 52 week CLOSING high entry and 7/12 EMA crossover exit system only.
ASX 300
AKE CXO LOV MIN PLS WTC
ASX 300-500
MYR PPC STA
52 WEEK HIGHS for the eBook system: (That does use a Bull filter) If you are confused about the use of filters, I suggest you read well the comments about that above.
None this week. The Bull filter is negative.
MARKET COMMENTS: As of the close 2/9/22: See charts below with an On Balance Volume indicator, a bar chart and a 12 EMA.
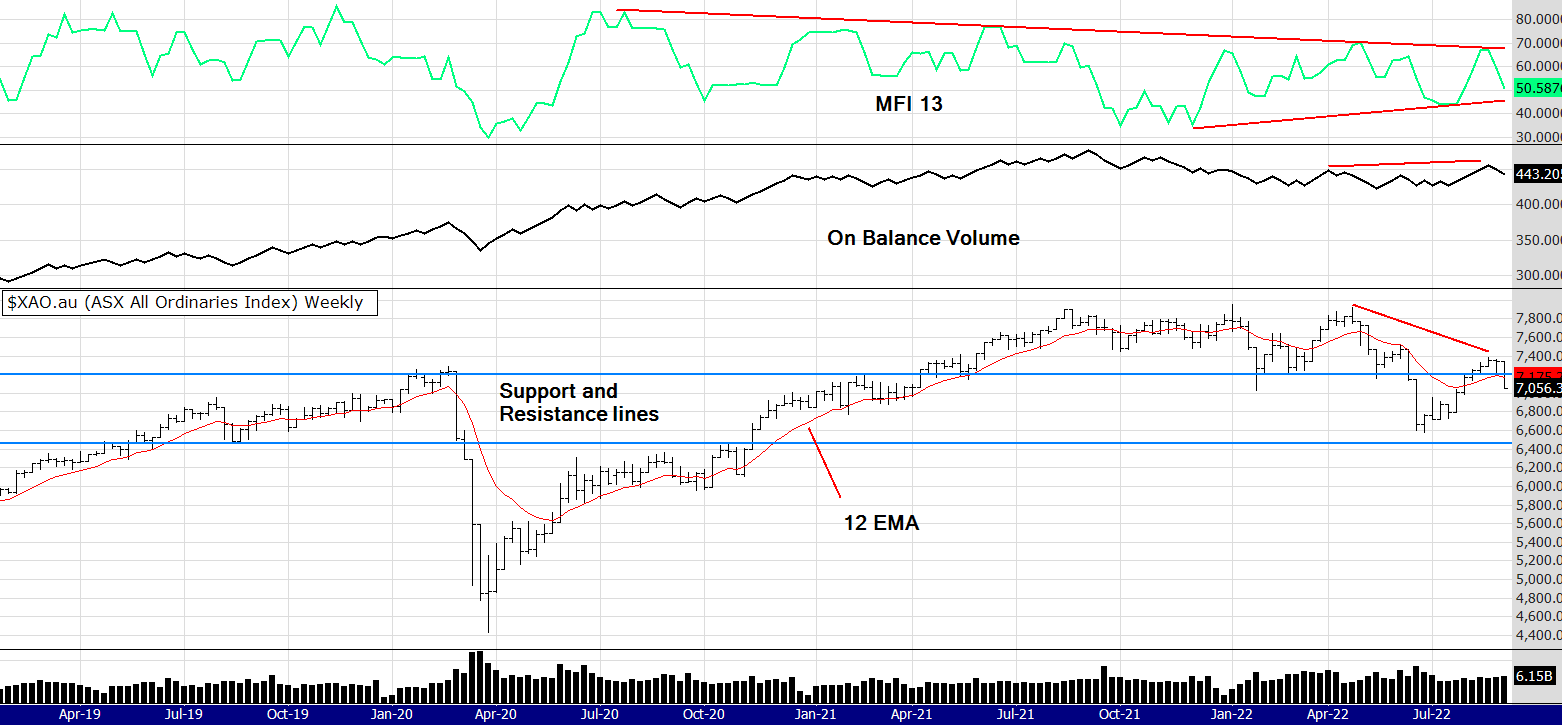
I hope there are not too many lines and indicators on the chart above. I have never been one for too many indicators, however this week I have added the Money Flow Index (13 period - one calendar quarter) in an attempt to gauge how strong or weak this market is. The MFI can give a different and alternate guide to the flow of volume in the market. As we know "volume is the steam that makes the choo choo go" (Joseph Granville).
What I find most interesting is the medium term (2 years) downtrend of the MFI indicating volume was losing steam. It would seem a level to watch is the lower trend line, which signaled a healthy bullish divergence between Dec 22 and July 22, that bullish MFI signal preceded the rally we had the following 9 weeks which ended just recently.
The Bull filter for the eBook system is below the 12 EMA, so for that system it is stand aside, do not buy, monitor existing trades.
I read an interesting article recently about down waves in bear markets. The premise was that there are 3 waves (Elliot wave fans will be nodding) down. The main point was - that historically the 3rd wave was double the 1st or 2nd wave. Looking at the chart below you can see we had around 10% falls in both the 1st and 2nd wave, before the recent 9 week rally. If we are to then have a 20% fall it would bring the market down to around the 5900 level. There is a lot of longer term support at 5900 drawn with the dotted - again, seen on the chart below.
As I have often said here, I am not one for predictions however we need to keep in mind possibilities. You can see from the Covid falls in early 2020 how quickly the market can change and the overall mood is very bearish at the moment. I personally think the Australian market is in a stronger position that the U.S. and the falls here may not be as severe, but who knows!
Be prepared for crisis AND opportunity.
Peter.

MARKET COMMENTS: As of the close 26/8/22: See charts below with an On Balance Volume indicator, a bar chart and a 12 EMA.
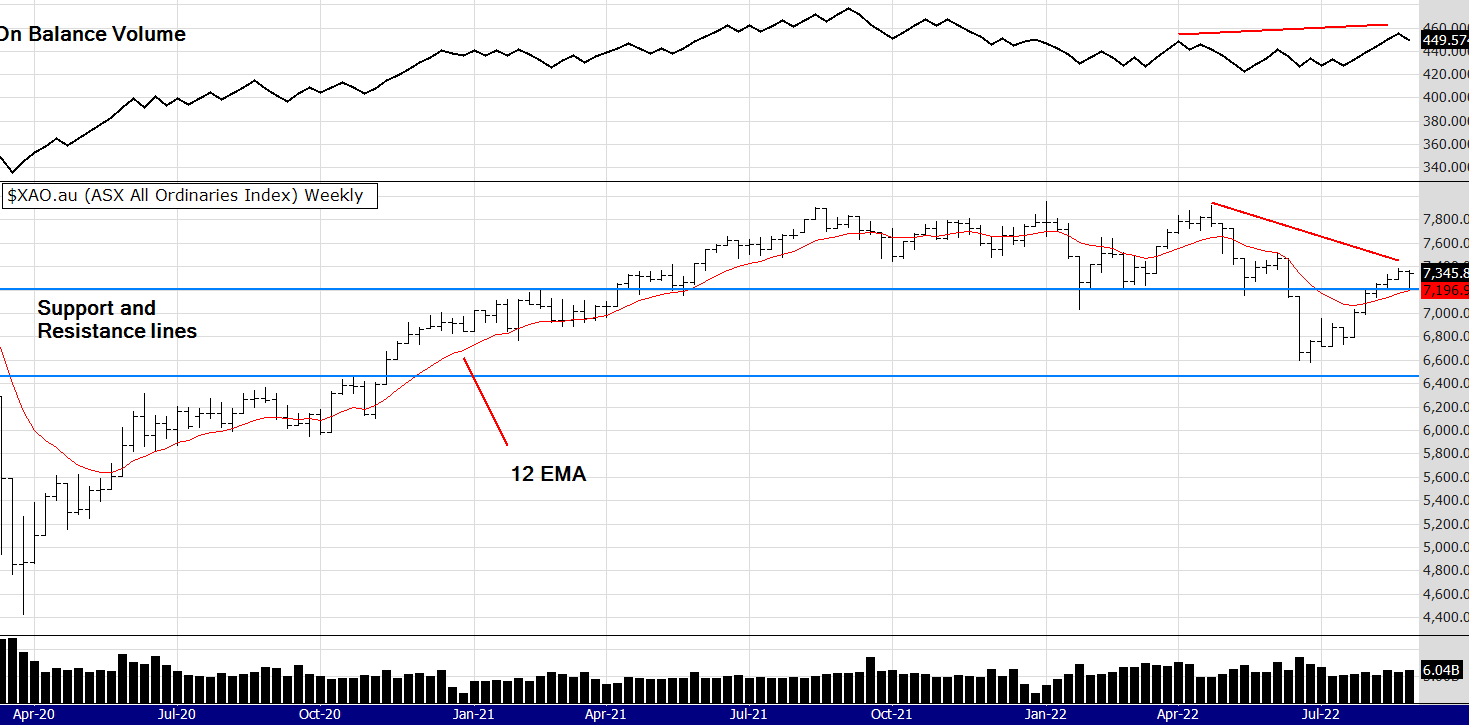
I don't have a lot to say about the chart above this week. That is because on Friday the US market closed significantly down on indication the Fed have no intention of slowing interest rate rises. Our market closed up on Friday looking strong, however we all know global markets follow the US lead and it is hard to see how the XAO will not be affected in a negative way this week.
In saying that there are alerts this week with some stocks exceptional strength. As usual they are listed below. I will save more comments until next week.
Regards
Peter
MARKET COMMENTS: As of the close 19/8/22: See charts below with an On Balance Volume indicator, a bar chart and a 12 EMA.
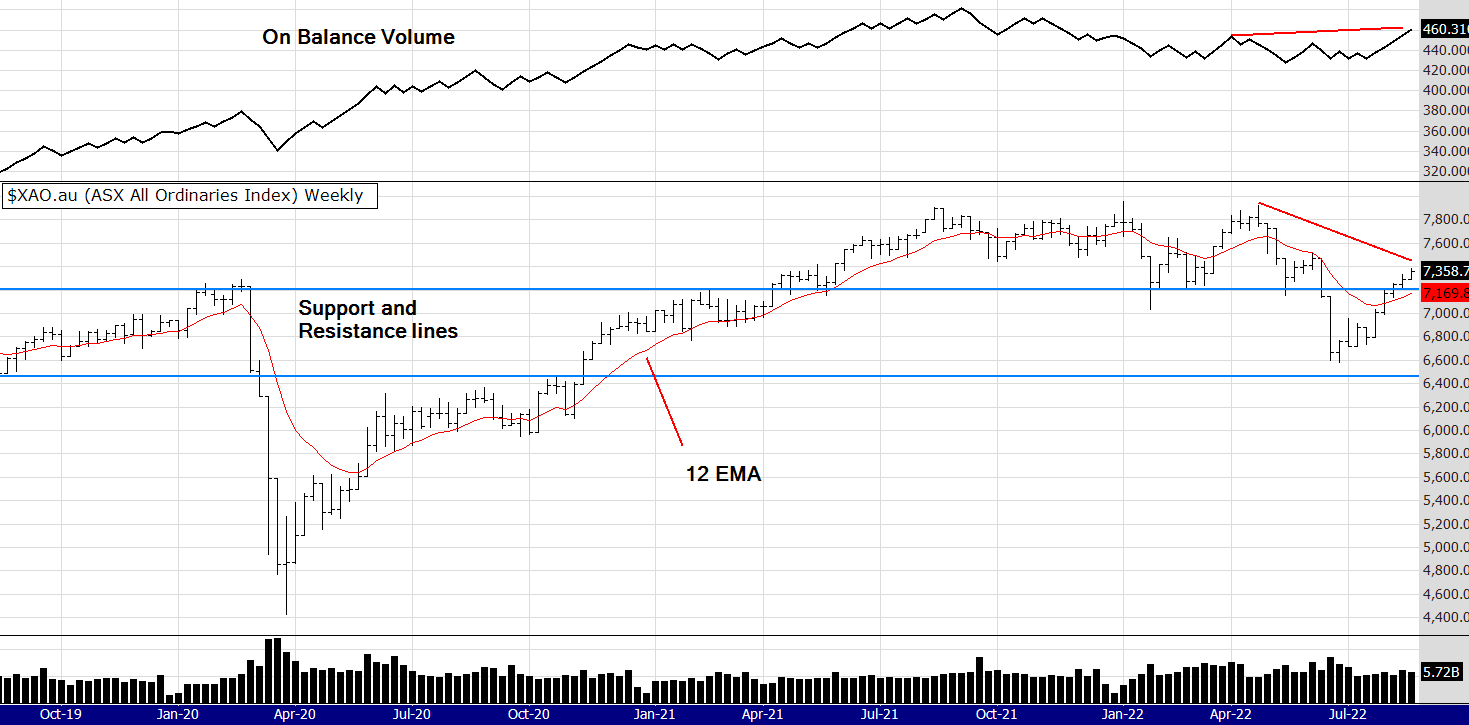
We now have a slight positive divergence between price and the OBV (as opposed to the negative divergence we had in May) . This divergence IS NOT a predictive tool, however it suggests the strength of volume in this recent rally. It would be quite a feat for the highs around 7800 to be reached or taken higher. I have noticed how strong the XAO index is compared to the US Indexes (namely the Nasdaq). That is because we are not a tech economy but of course a resource one. Stellar results like the one from BHP this week certainly help the XAO.
Historically September is the weakest month of the year as can be seen on the chart below of the 67 years between 1950 to 2017. In my opinion Covid has altered some cycles and cycles do not repeat with accuracy all the time. However considering the recent rally it is a consideration. The good news is after the September pullback the markets rallies into Xmas.

Until next week
Peter
MARKET COMMENTS: As of the close 12/8/22: See charts below with an On Balance Volume indicator, a bar chart and a 12 EMA.
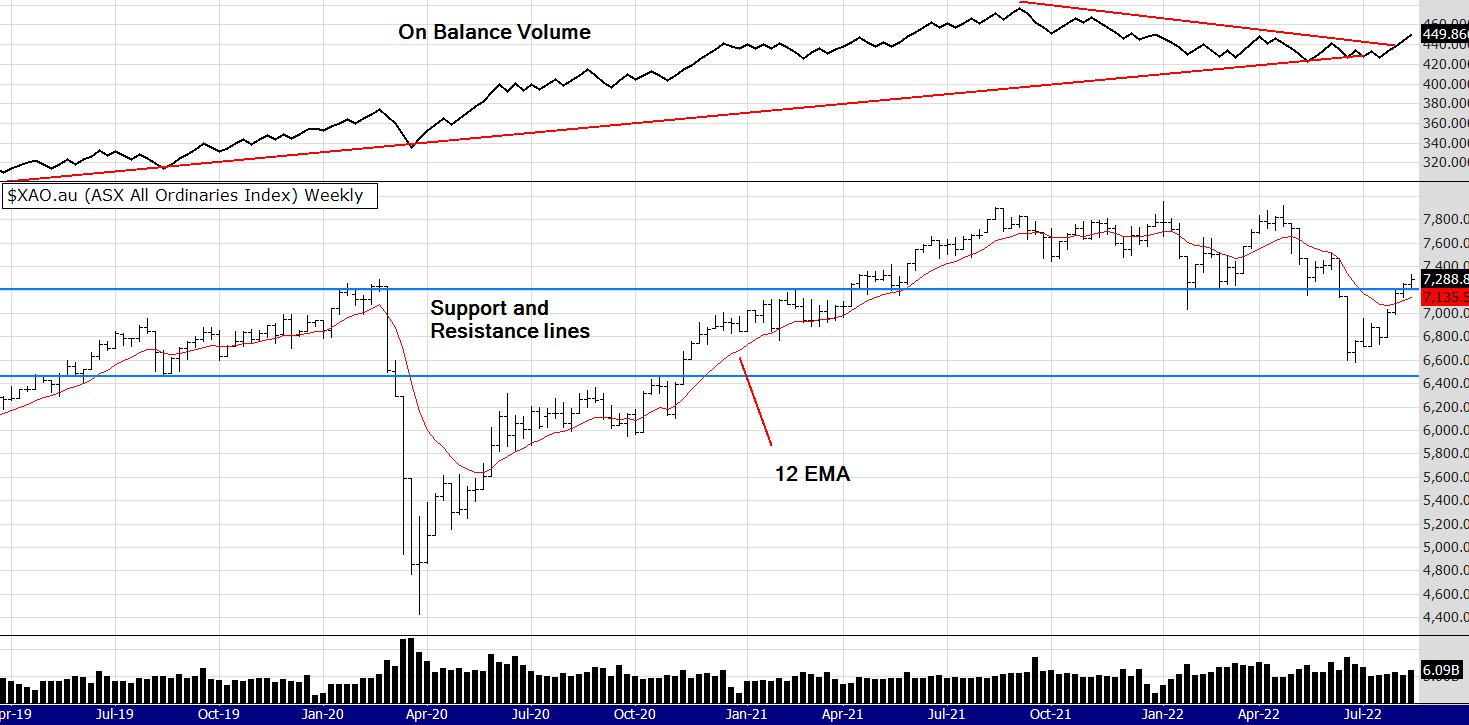
Well, it's still going up. Despite the fears of a China collapse, inflation, interest rates, property collapse etc....the market is climbing the wall of worry. The small caps are ON FIRE. I am not sure what to make of that but if you are trading that sector you should have had a good week.
As you can see the chart above is bullish - what's going to stop the party? Maybe the cyclical factor. Late August and September is historically a weak time, but since Covid, cycles seem to be changing or being ignored.
I know one cycle that is working, the rally of gold stocks between August and December, it could be "hang on to your hat" time.
Until next week, alerts below
Peter
MARKET COMMENTS: As of the close 5/8/22: See charts below with an On Balance Volume indicator, a bar chart and a 12 EMA.

Strength. I suppose that is how you could describe the chart above. Very impressive breakout of the overhead down trend line of the OBV. Also the weekly closing price has stuck its head above the resistance line - but that is only a line I drew on the chart, resistance could be anywhere around that area. The daily chart (not posted) does look over bought. Remember the chart above is the Bull Filter for the eBook system, we are not attempting to time the market for a daily system, unless of course you have a daily system with a shorter time frame.
The other comment I will make is the gold sector, it finally rallied after a long and testing down trend. See chart below and more comments below that.

I posted this chart on twitter a week or two ago, noting the divergence between price and volume, a rally was probable with extreme divergence as above. If you want to follow me on twitter just search The Zen Trader. The price has closed above the weekly downtrend line, however, like the XAO the gold price is hitting resistance and could pullback or consolidate. Who knows! Its so difficult to predict - that is why you need a method to follow and then monitor the system - and of course YOURSELF.
Until next week
Peter
MARKET COMMENTS: As of the close 29/7/22: See charts below with an On Balance Volume indicator, a bar chart and a 12 EMA.

Well the big news this week is the eBook system has triggered a buy, see alerts for the stocks below. You can see clearly the XAO is well above the Bull filter 12 EMA. If your following a method like that, monday is buy time. It is never easy psychologically is it? Looking at the chart above the XAO is sitting on resistance and one would expect a pullback.
Is this a bear market rally, is it the start of a new bull market? Maybe. Normally new bull markets are not in the same stocks and sectors of the last bull market. Where will this one be?
Next week I will do a sector break down to see what we can find. Until then stay well.
Peter
MARKET COMMENTS: As of the close 22/7/22: See charts below with an On Balance Volume indicator, a bar chart and a 12 EMA.
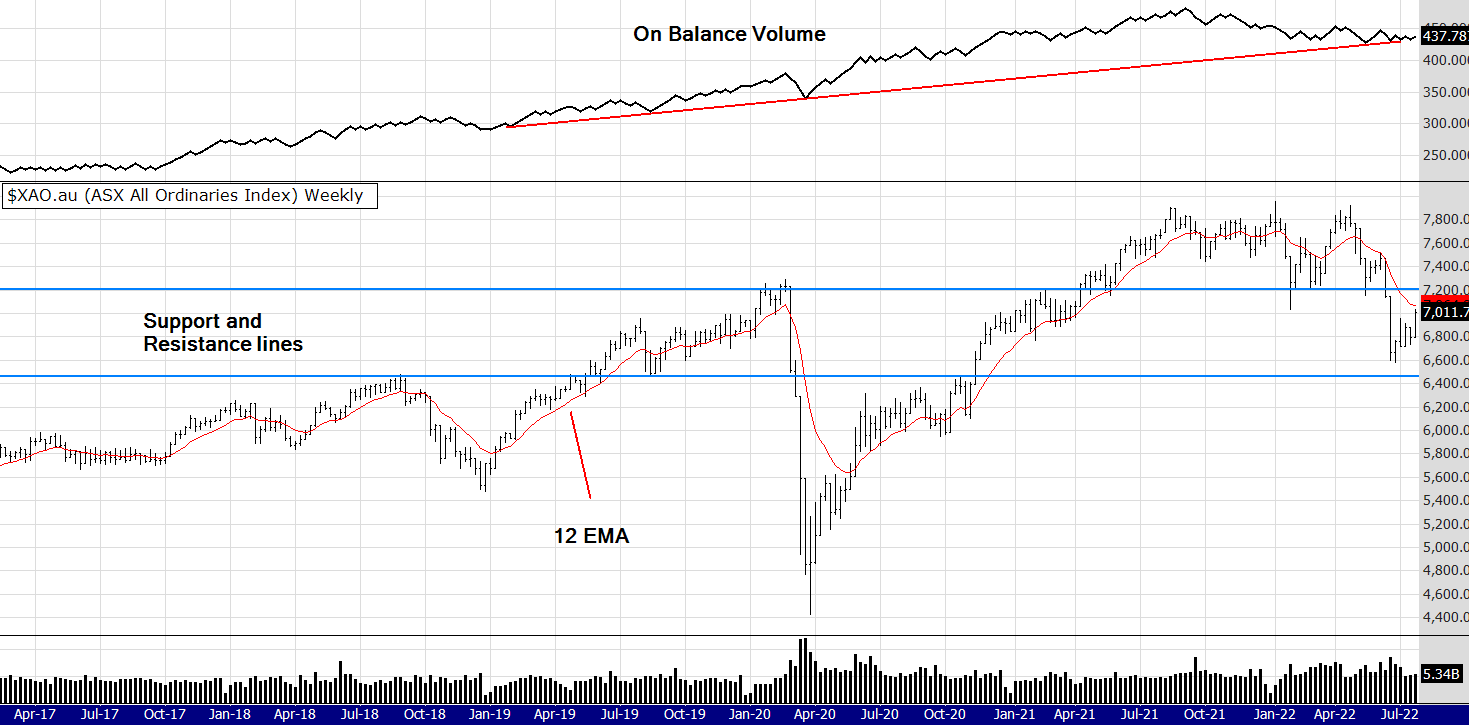
The XAO looking better isn't it? Apologies for skipping last week. About a month ago I had serious car accident and then followed it up with catching Covid. Perhaps a weakened immune system response from the trauma/stress. Anyway it was good to have a break and have the chance to plan some changes. I am often telling others to stop, think, re-assess etc., and after the last few weeks I can highly recommend it!
We are not out of the woods yet, but do you feel like the mood is changing? Are people accepting the financial changes thrust upon them? Is there a feeling things are not really that bad so lets get on with it?
I think so. I said to some colleagues a few weeks ago I thought the mood was worse than the technicals but the mood could be changing. For example company reports coming out of the US are not as negative as feared.
Looking at that chart above the ideal scenario is for it to pull back a little, consolidate and then move up again, or at least churn sideways until the economy recovers. Some short term systems are signalling re-entry into the market. Not yet though the medium term eBook system.
Peter
MARKET COMMENTS: As of the close 8/7/22: See charts below with an On Balance Volume indicator, a bar chart and a
12 EMA.
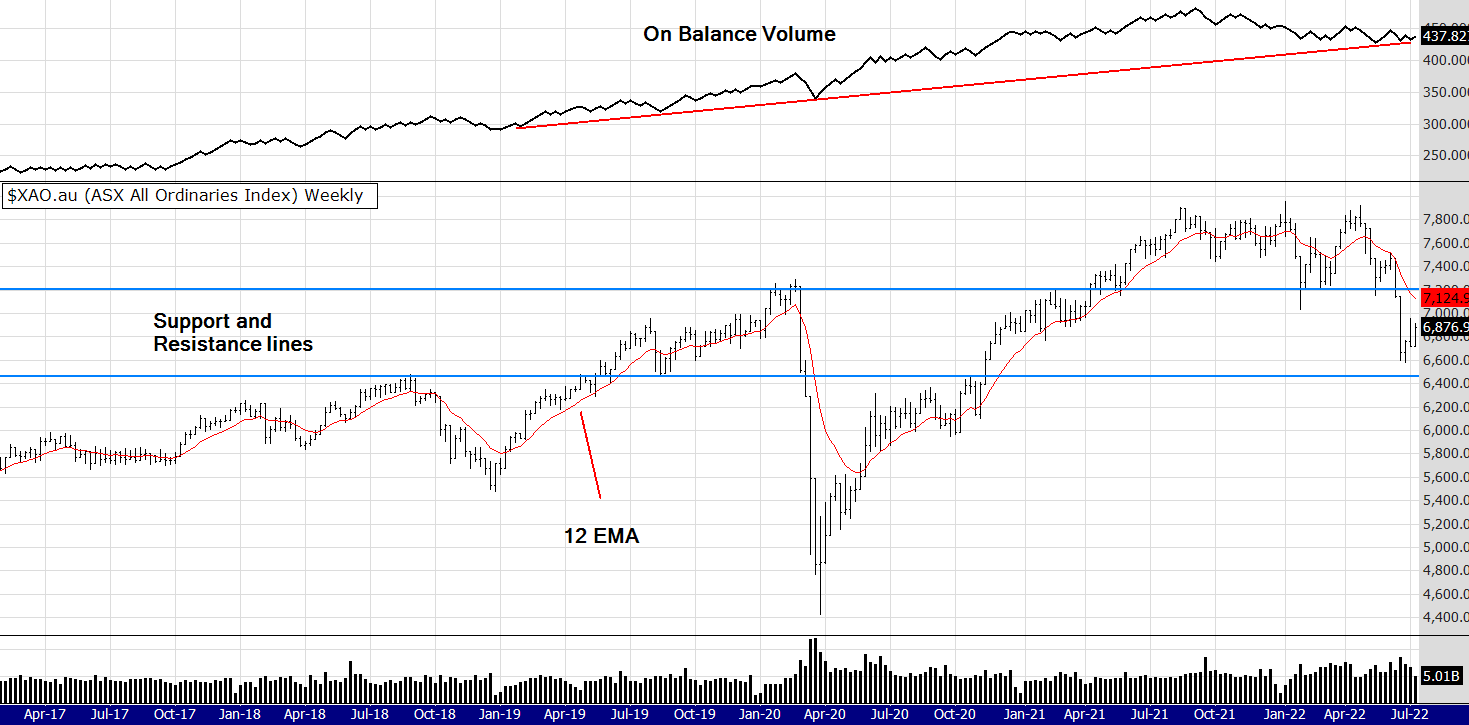
Is that a better week? Yes, it went up, but on low volume. Nothing to do but wait and watch as far as the eBook system goes. The bull filter is still negative but there are 3 alerts in the 52 week closing system that does not use a bull filter. Amazing how there is often a stock breaking new long term highs even in this market. Short and sweet this week, I have a dose of the big C.
MARKET COMMENTS: As of the close 1/7/22: See charts below with an On Balance Volume indicator, a bar chart and a 12 EMA.
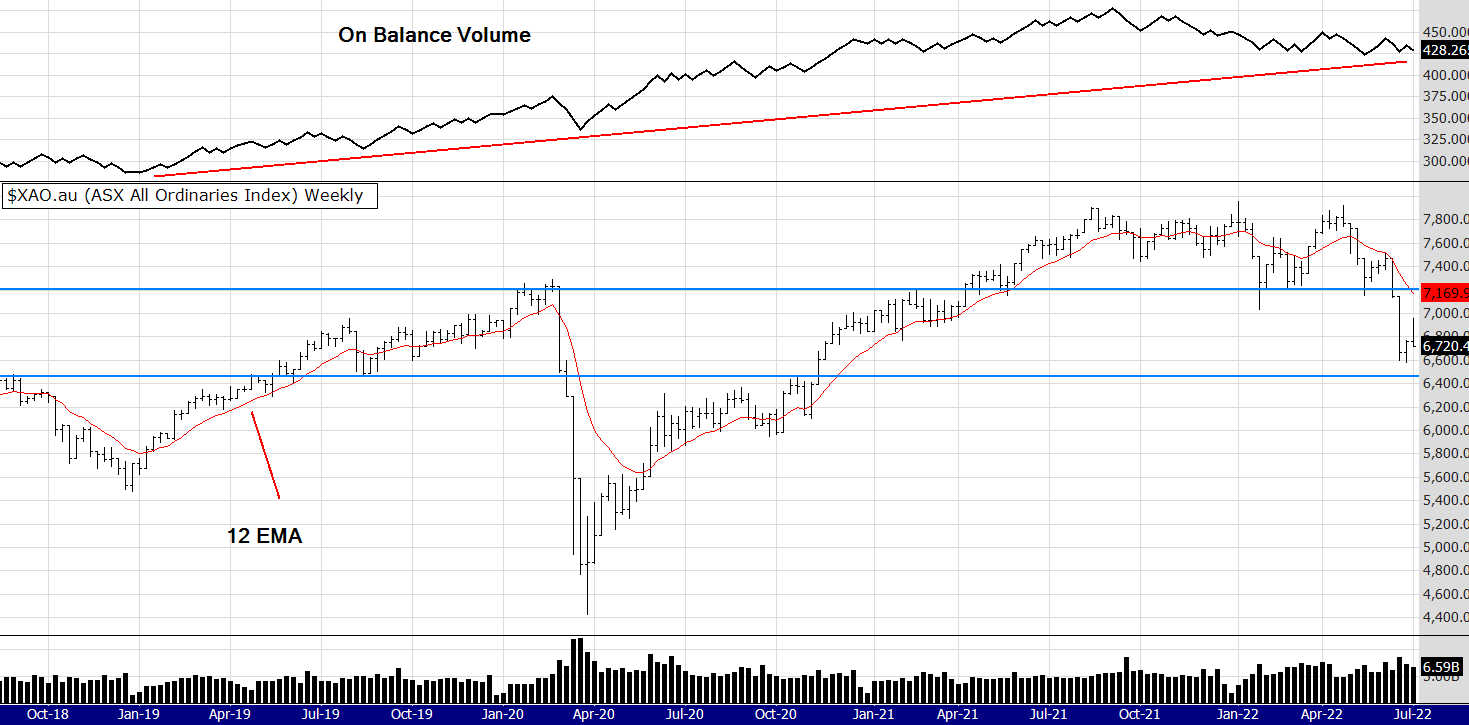
It was a bearish week this one, the index went up early in the week but closed down. With a week like that one nothing to do but wait and see what this week produces. Cash is a good option at the moment with so much uncertainty around.
Gold stocks were sold off a gain with the gold price falling. Interestingly gold is down around 11% from its high of 2,000 yet gold stocks are down 50%. Now THAT is an anomaly and something has got to give. Either gold goes a lot lower or gold stocks rally.
Till next week
Peter
MARKET COMMENTS: As of the close 24/6/22: See charts below with an On Balance Volume indicator, a bar chart and a 12 EMA.

I said 2 weeks ago we could fall another 25%. The market fell nearly 10% since then - breaking decisively through the upper support line on the chart above. That line now becomes a resistance line if we get a rally, at it seems we may. Is Australia in a bear market? What determines a bear market? Lower lows on the chart? However where do we pick the lows? Was that just one huge move up from the covid low of March 2020? If so, is that the last low? Is a bear market a 20% fall from previous highs? If so it needs to fall below 6200 so we can use that measurement. It isn't there - yet. Will it get there - "don't know". There is a chapter on the Zen and trading philosophy of "don't know" in my book the Zen Trader.
https://www.easysharetradingsystems.com.au/products-and-services/e-books/zen-trader
Why hasn't the OBV fallen? Is that a useful indicator? It's all enough to drive you crazy. The answer? Have a method and stick to it.
I went back into the market with a shorter term system about a month ago, nearly all stocks have been stopped. I use conditional sell orders placed in the market. I don't have to think about selling, it happens for me if the price is hit. It's not a perfect method, nothing is.
I often talk about Gold, well here is an interesting chart.
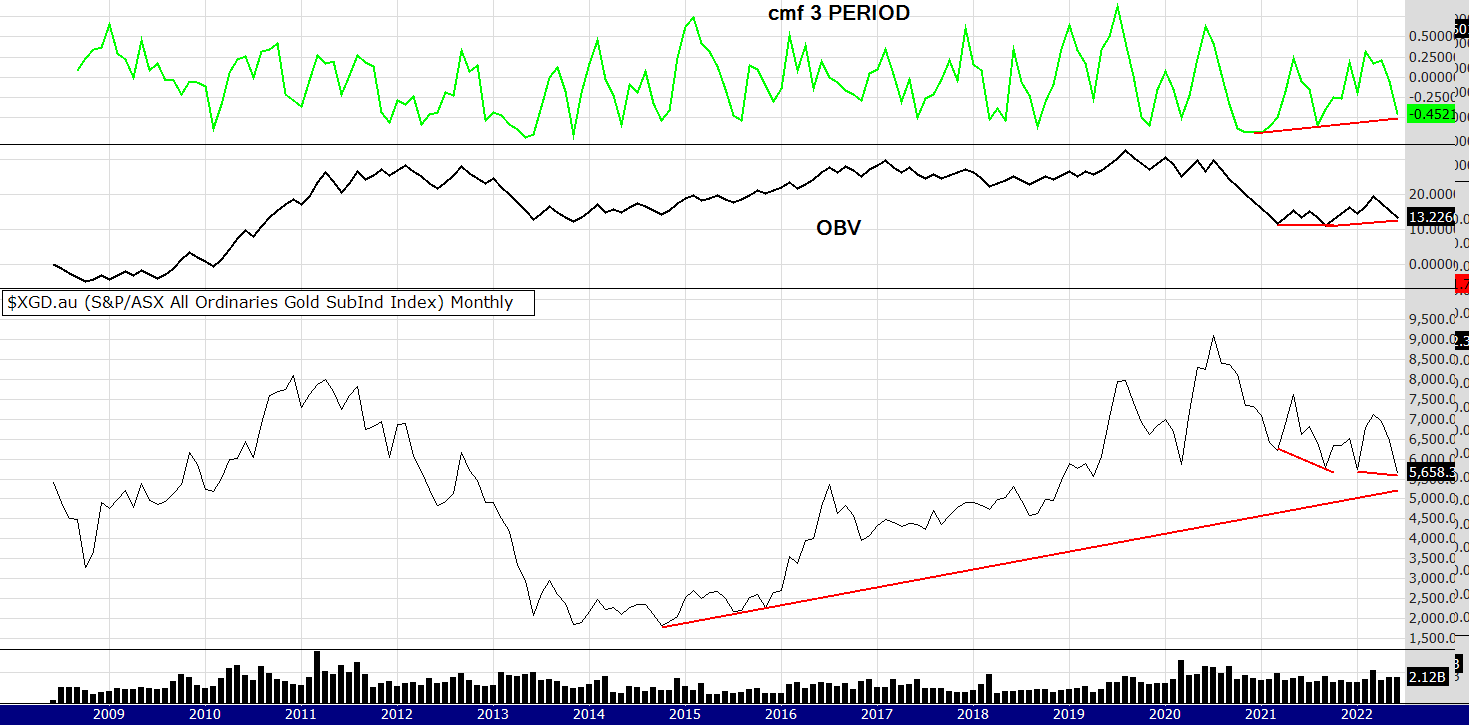
A monthly chart can show the beginning of major moves. This sector looks oversold to me. The gold shares often have a seasonal rally between July and Oct, I keep watching this space with interest.
Until next week!
Peter
MARKET COMMENTS: As of the close 10/6/22: See charts below with an On Balance Volume indicator, a bar chart and a 12 EMA.

Well it is just getting more interesting. You may not agree with that statement if you are experiencing losses. What I see as most interesting is the divergence between price and volume. Price is falling and is hovering on old support levels yet the OBV is not falling and stays within its medium term trend line.
However I was studying the charts of the US market and its quite possible those indexes fall another 25%. If that happens we wont avoid the carnage. For example look at that fall in March 2020, if the mood of the market gets really negative that could happen again and around 5000 to 5500 points is where I see major support.
Something very big happened on Friday night in the US. The gold price bucked the trend against the rising US dollar - supporting the gold sector there, whilst other sectors fell. Look at that daily bar on the chart BELOW (apologies for size ) in the US gold stock index the XAU. Expect a similar performance here on Tuesday in the XGD. Normally the gold price falls with a rising dollar but perhaps some have decided "enough is enough" and money is moving to the perceived safety and opportunity of gold and gold stocks?
Anyway, see you next week, alerts below, Peter
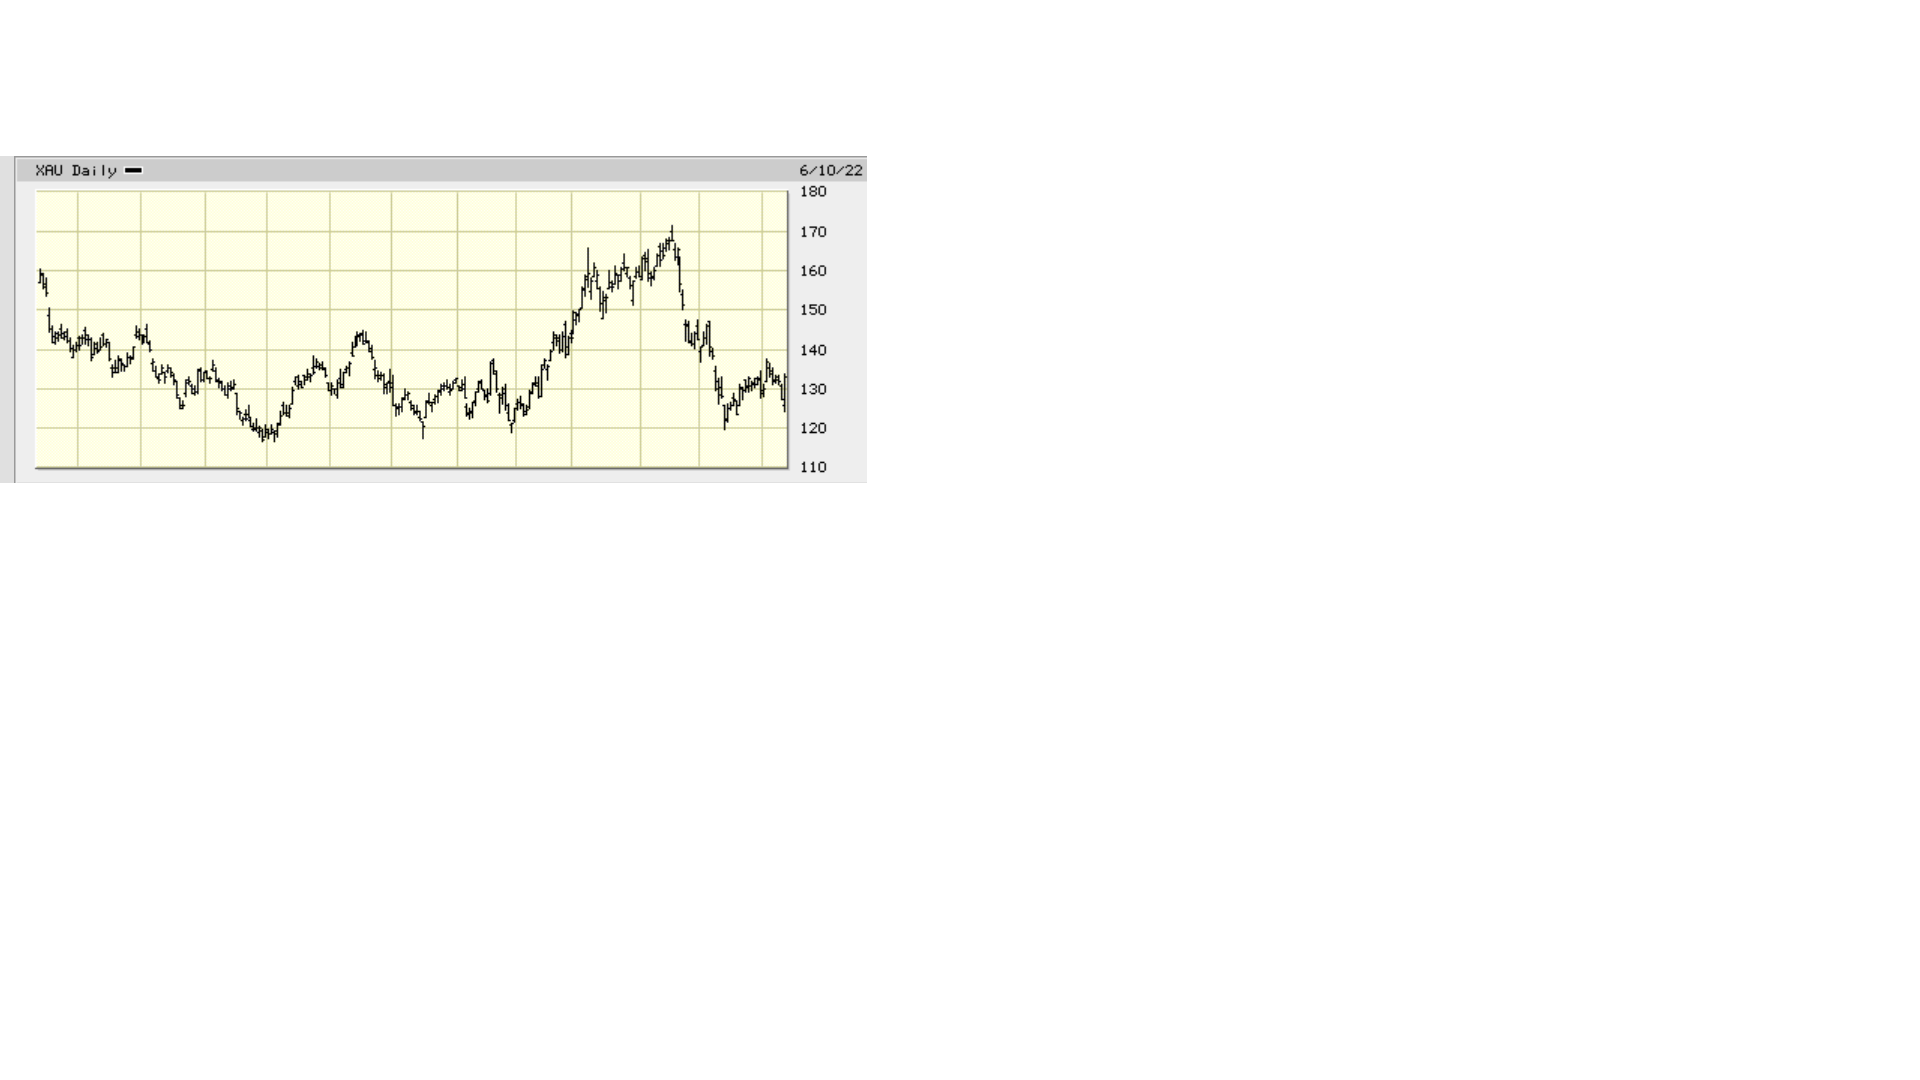
MARKET COMMENTS: As of the close 3/6/22: See charts below with an On Balance Volume indicator, a bar chart and a 12 EMA.

That is a very big and impressive volume bar of this last weeks trading. The Australian market is certainly resilient. When comparing this market to most of the other major markets globally - I think we should be very grateful for our lot here in the land of down under. Although the bull filter in this system has not triggered, some of my shorter term systems have and I have re-entered the market with one of those. Why?
Well for these reasons: I have been short term and day trading, however I have some work I want to do on my house and it will be easier for me to run a weekly system whilst I focus on painting and gardening. How boring you may think but I am looking fwd to the change. Also the system has a tight exit so if this market reverses down I will be out quickly.
I am also currently working on writing Mindful Trading version 2, a recap of the systems performance and some suggested improvements.
I notice the Australian gold sector had a strong week. See the chart below. This is one of my favourite sectors and I will keep you posted as to what I think is happening with it. Commodity stocks to seem to be one of the strongest sectors in our market.
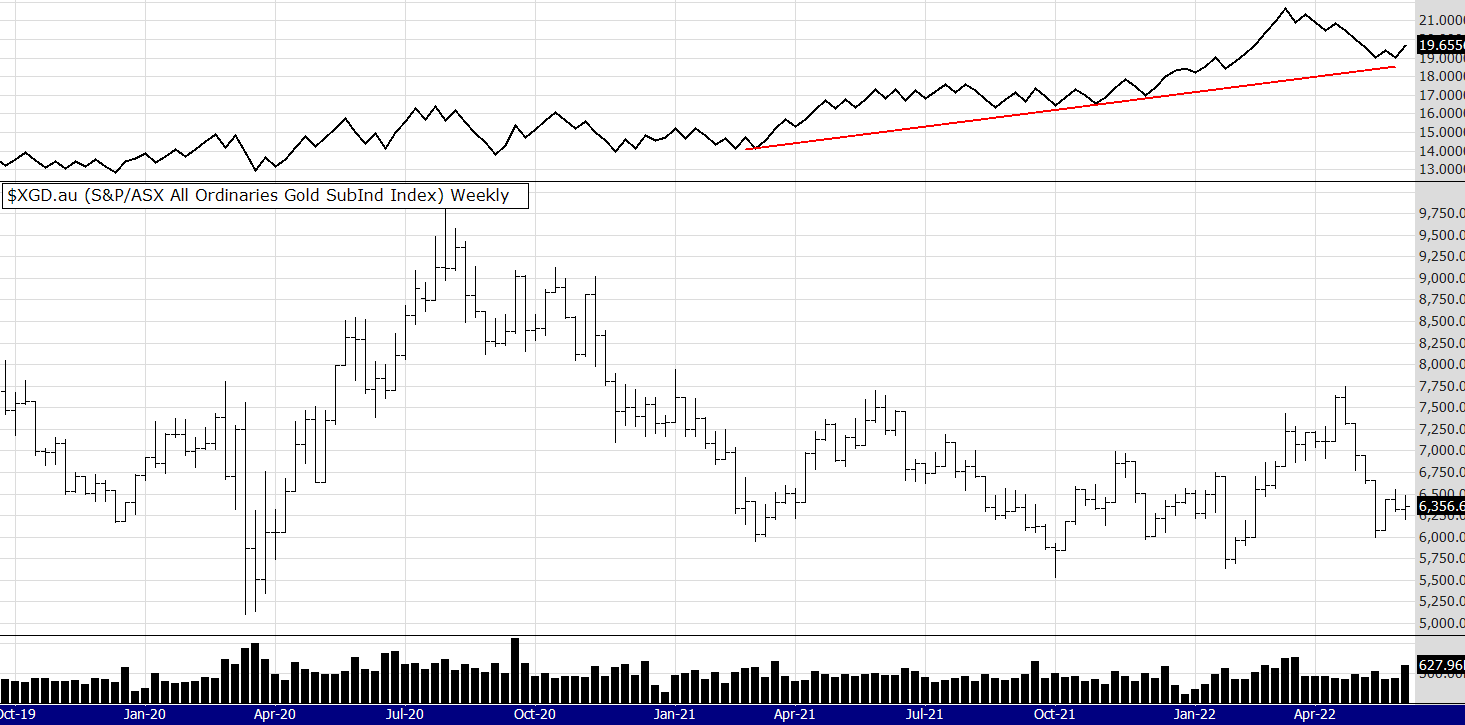
MARKET COMMENTS: As of the close 27/5/22: See charts below with an On Balance Volume indicator, a bar chart and a 12 EMA.
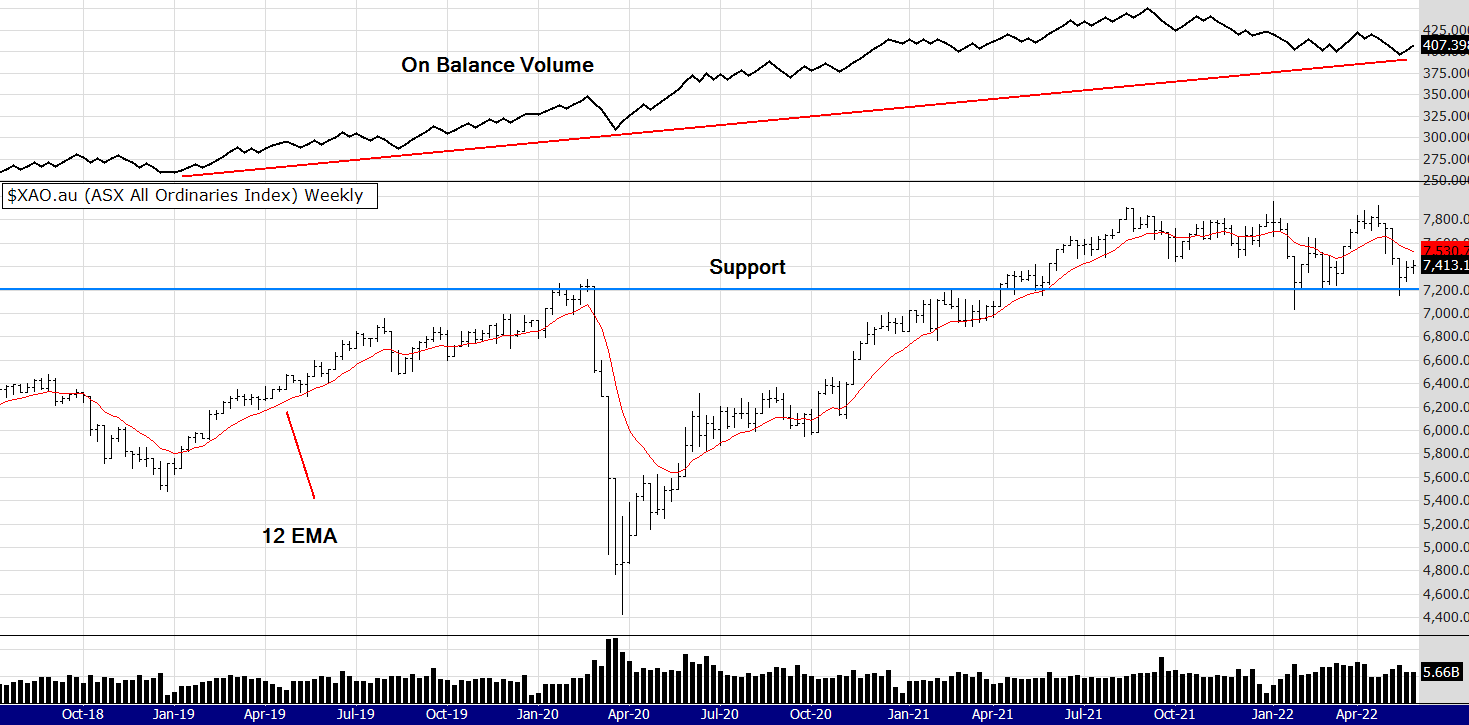
The XAO had a pretty good week, no falls and a slight rise. Of course most will know the US markets rallied on the Friday there, setting us up for a rally here in Aus.
The thing to wait for now is if the Bull filter kicks in for the medium term trend trading systems. Some of my short term trending systems have already signalled to buy. It will be an interesting week.
Peter
MARKET COMMENTS: As of the close 20/5/22: See charts below with an On Balance Volume indicator, a bar chart and a 12 EMA.
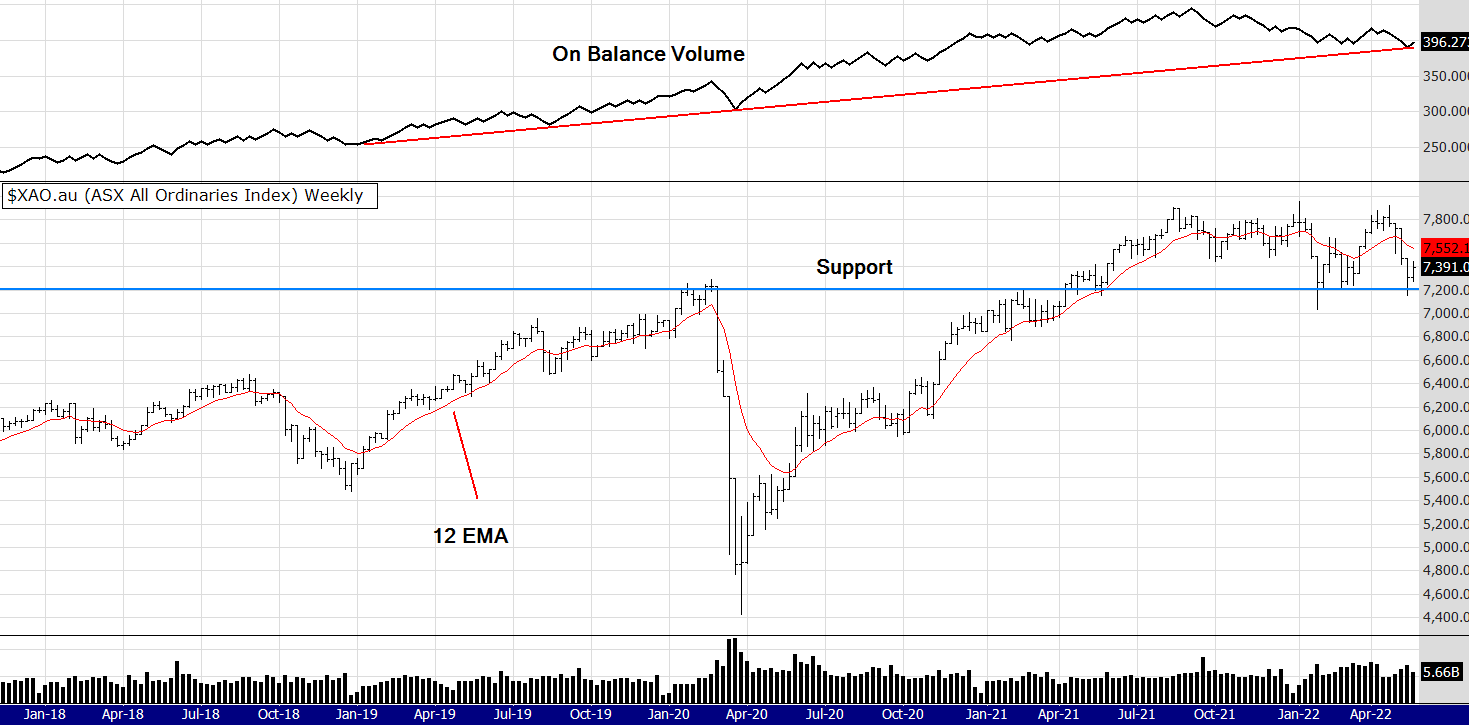
The interesting chart of the XAO looks very similar to last weeks chart - just the price is a little higher. Despite more falls on the US markets the XAO maintained its relatively strong position. As often mentioned here in these comments, that is because we are a resource heavy index and it is certainly helping at the moment.
The next chart is perhaps even more interesting.

Look at that On Balance Volume support. It's a classic breakout of a rising wedge, then a retest of support. The Aussie gold index has been sold off from the general market selloff AND a falling gold price. However, the US dollar has started to fall from a seemingly overbought position - creating a bounce in the gold price and gold stocks.
I think this is the sector to watch now. It seems prime for a rally in my opinion.
See you next week!
Peter
MARKET COMMENTS: As of the close 13/5/22: See charts below with an On Balance Volume indicator, a bar chart and a 12 EMA.
Apologies, I was away on a meditation retreat and did not post alerts for the week ending 6th May 2022

Well that is an interesting chart! The OBV is sitting right on the 3 year trend line. Normally when the index sits on a long term OBV trend line it finds support.
A fortnight ago I discussed the Nasdaq and how it looked oversold (scroll down for those comments). The chart below shows the price falling to the 50% Fib retracement and then bouncing up. Very positive sign. It should be a good start to the week commencing 16th May 22.
Alerts for this week below.

MARKET COMMENTS: As of the close 29/4/22: See charts below with an On Balance Volume indicator, a bar chart and a 12 EMA.

Even though the chart above shows the bull filter negative (as I have live data and am writing this midday Tuesday 3rd May) ) last weeks close left it positive, so there are 2 alerts for the eBook system this week. However, uncertainty and a bearish sentiment remain. Even the gold price and the gold sector has sold off, however IMO it is at a great buy point and could rebound strongly at any time.
I have posted below a chart of the Nasdaq. More comments below that chart.
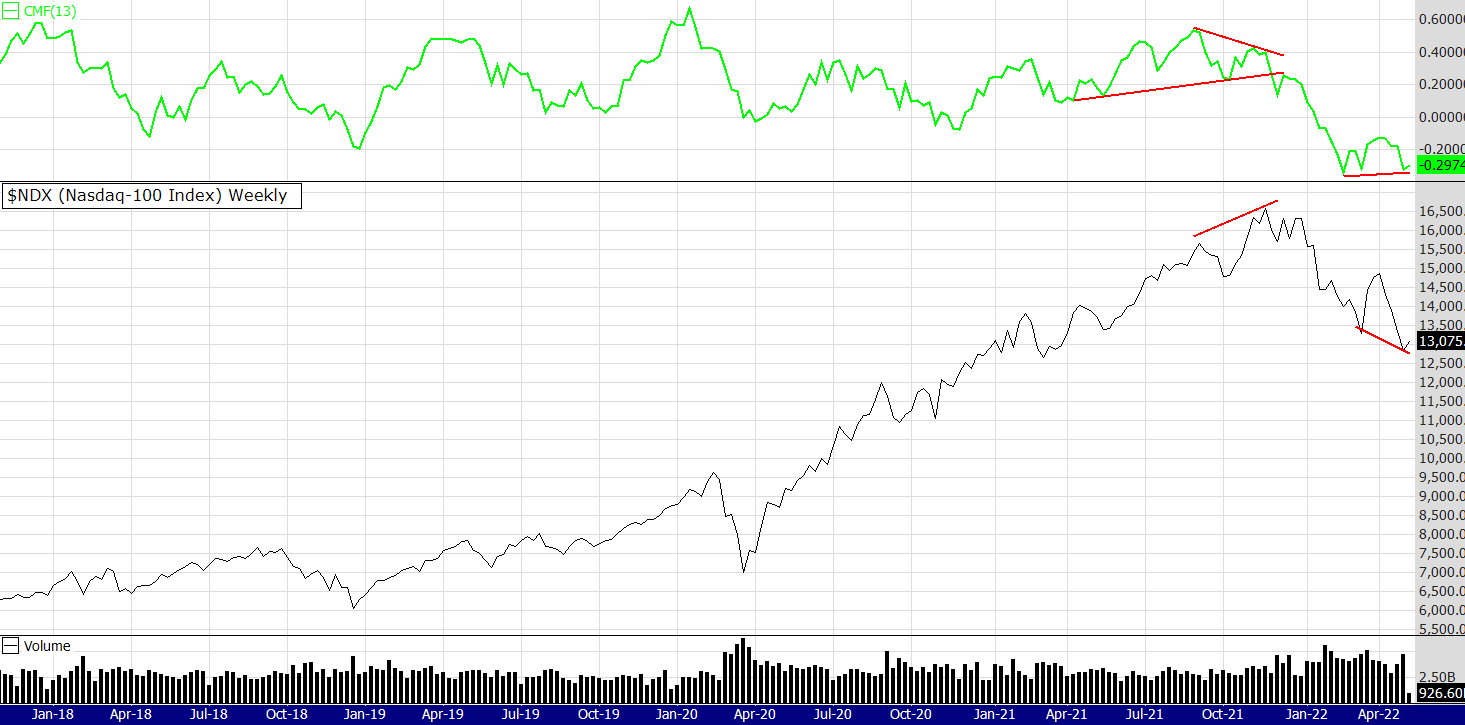
The Nasdaq has been dragging down the market, it was the leader before so that is understandable. It seems to drag down the Crypto market too - although that is another path we won't go down here today. The dominant sector in the US is technology, in Australia it is banks and commodities. When the indexes from the US fall it has a negative impact on almost everything, people also sell everything (eg: gold and commodities) to raise cash.
So, for things to turn positive again we either need a big rotation back into the SP500 and the Dow, or for the Nasdaq to recover. Looking at the chart above we now have some positive divergence between volume and price. The opposite to the negative divergence we had in late 2021. The chart is a weekly scale and the volume filter is the 13 period CMF.
Also! the price is now at a 38% Fib retracement - calculated from the 2020 April low to the Dec 2021 high. Here it is in the chart below. Now - I am not really a fan of Fib retracements - but many are - and many traders look for support and divergences like we have in the other Nasdaq chart. A bounce here, IMO, is probable. Particularly in commodities as they are the strongest sector.
See you next week, it should be an interesting one. Alerts below.

MARKET COMMENTS: As of 22/4/22: See charts below with an On Balance Volume indicator, a bar chart and a 12 EMA.
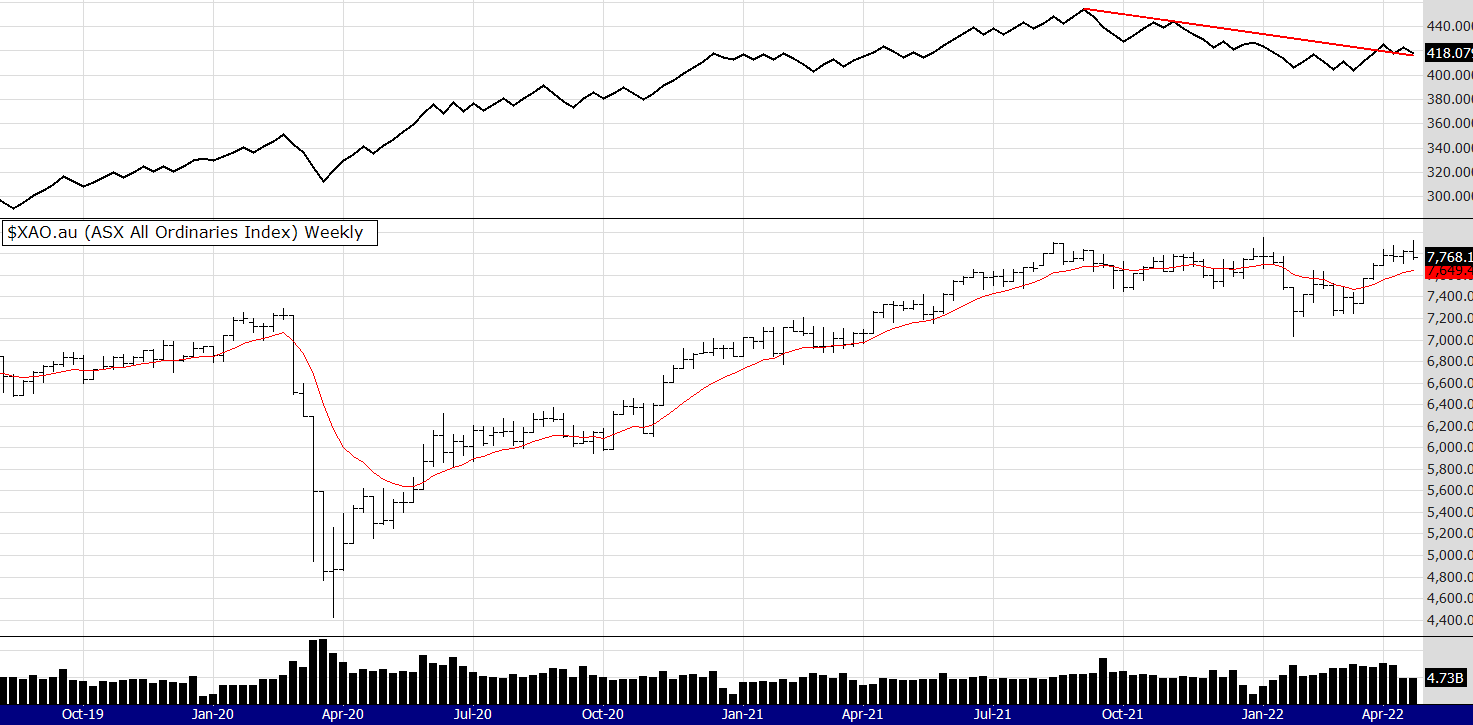
Last week I wrote: "The Bull market continues. I did have a short on the XAO and it was stopped out this week. The loss was compensated with big profits from the Gold sector, arguably the strongest one at the moment. You will notice lower volume this week as traders reduce exposure before the Easter break and perhaps some caution as the Sell in May fear takes hold. Of course it was only a 4 day trading week - as next week will also be. Lower volume is to be expected"
Well what a week as the volatility continues. I lightened up my portfolio during the week as I did not like the look of the price action amongst the gold sector. I also put back on my short on the XAO. Most will know the US markets fell hard in the last session for their week so expect the XAO to follow on Tuesday - as Monday is Anzac Day and our market is closed out of respect.
The Sell in May could be upon us as the world continues to digest concerning news about war, inflation, interest rates and the like.
I was surprised to see nine alerts in the 52 week closing high system this week. Its been a resilient system, except for the covid crash when it suffered a big draw down. Below is a 3 year back test of the system (using adjusted data for survivorship bias.)
In my new book The Zen Trader I discuss a similar system with a different exit to reduce volatility, I hope you check it out here
https://harriman.house/books/the-zen-trader/
See you next week.

MARKET COMMENTS: As of Easter 14/4/22: See charts below with an On Balance Volume indicator, a bar chart and a 12 EMA.

The Bull market continues. I did have a short on the XAO and it was stopped out this week. The loss was compensated with big profits from the Gold sector, arguably the strongest one at the moment. You will notice lower volume this week as traders reduce exposure before the Easter break and perhaps some caution as the Sell in May fear takes hold. Of course it was only a 4 day trading week - as next week will also be. Lower volume is to be expected.
The OBV indicator is looking supportive of the recent price movements.
Happy Easter and I hope you all have a wonderful break. Here on the NSW Central Coast the weather is fantastic, good to get a break from all the heavy rain.
Until next week
Peter.
MARKET COMMENTS: As of 8/4/22: See charts below with an On Balance Volume indicator, a bar chart and a 12 EMA.
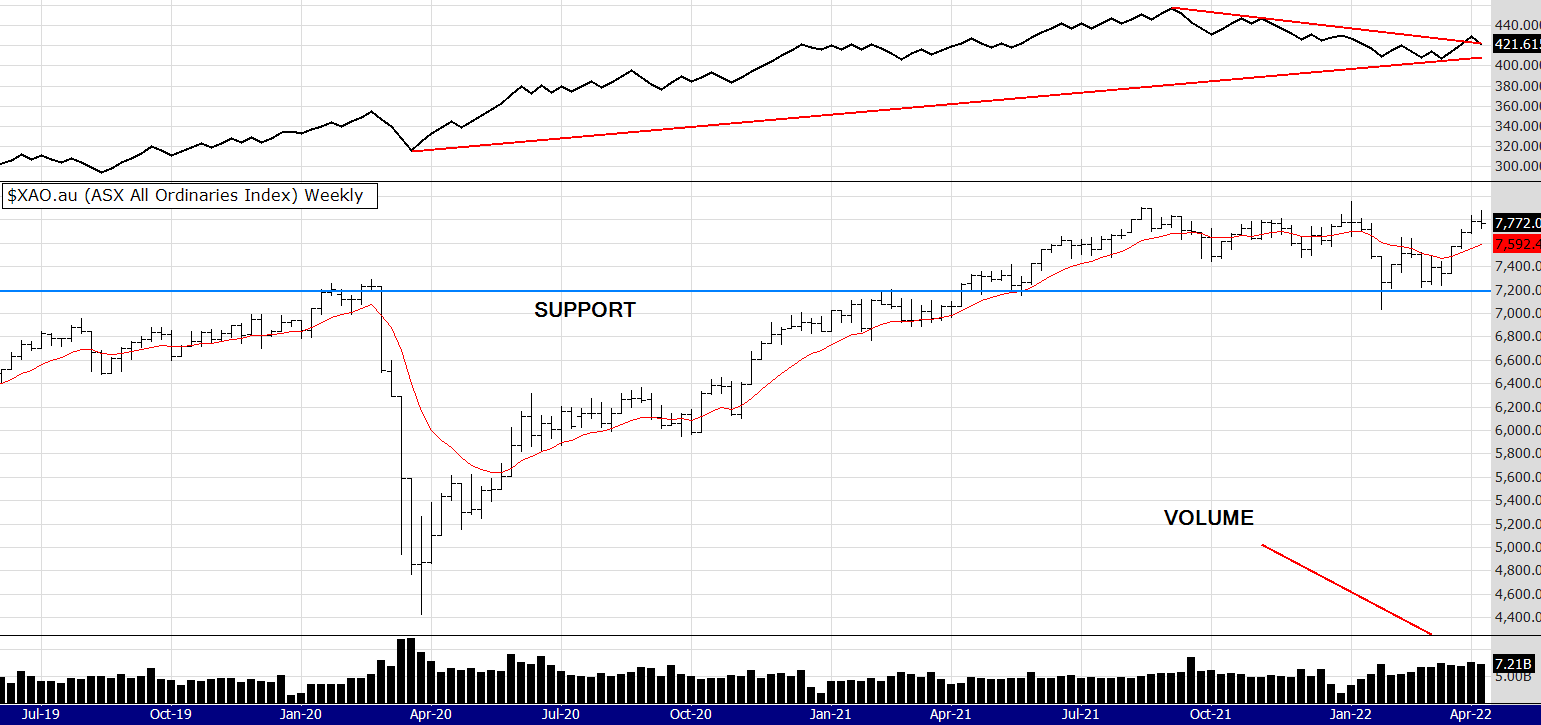
I said in last weeks comments it was probable the market would pause or retrace - this trading week the XAO index fell slightly into the weeks close but remains above the Bull filter. Less alerts this week which is understandable, as during the last few weeks there have been many buy signals - also caution perhaps is a factor from some, after the strong recovery rally of the last 4 weeks.
The gold index continues to be strong. I notice last week the rare earths sector took a breather, however this week may be another strong one with the gold price rallying on Friday night in OS trade. I mention this because those 2 sectors really have been motoring along and are producing some of the most profitable trades in the systems.
Now that my book is finally finished I can focus back on the website and providing more products and services. I also intend to start writing more newsletters. So! keep an eye out for that.
Until next week
Peter
MARKET COMMENTS: As of 1/4/22: See charts below with an On Balance Volume indicator, a bar chart and a 12 EMA.

So it seems the bull filter from the eBook system made a good call. I said a few weeks ago one of the hardest things about trading ANY system is following the rules. Why? well often we just do not believe what the market is doing! How can it be rallying amongst all the uncertainty and doom and gloom? Markets (people) continually do the unpredictable - a reason why attempting to predict is pointless.
Solution? Have a method based on probability and then do your best to follow it.
From a technical perspective one would expect some resistance soon, as the index (XAO) attempts to break past those 2 previous highs in Jan 2022 and Aug 2021. My opinion is it will depend on overseas events and markets. If the global recovery rally continues then I suppose we will follow. I say that because based on past performance (probability) that is what happens.
The Australian stock market is in a commodity demand fueled rally. The last time I saw that sector so strong was the 2003 - 2008 period. Huge gains were made in the commodity stocks as momentum for those stocks outperformed others. Be careful though, when this sector reverses it does so with speed. You need a few different exit strategies to preserve profits. More on this to come.
See you next week, Peter

The XAO continues to rally. I heard on the news a few days ago - for the last 8 weeks the XAO was the second best performing index amongst the majors, only behind Japan. The index is certainly moving away from those support lines on the chart above. The index is moving into resistance so a pause may be probable. One would think a pause is probable! However as the markets continually show we just don't know what will happen no matter how hard we try to predict.
Alerts below for this week.
Have a good week and stay mentally and physically healthy.
Peter
MARKET COMMENTS: As of 18/3/22: See charts below with an On Balance Volume indicator, a bar chart and a 12 EMA.
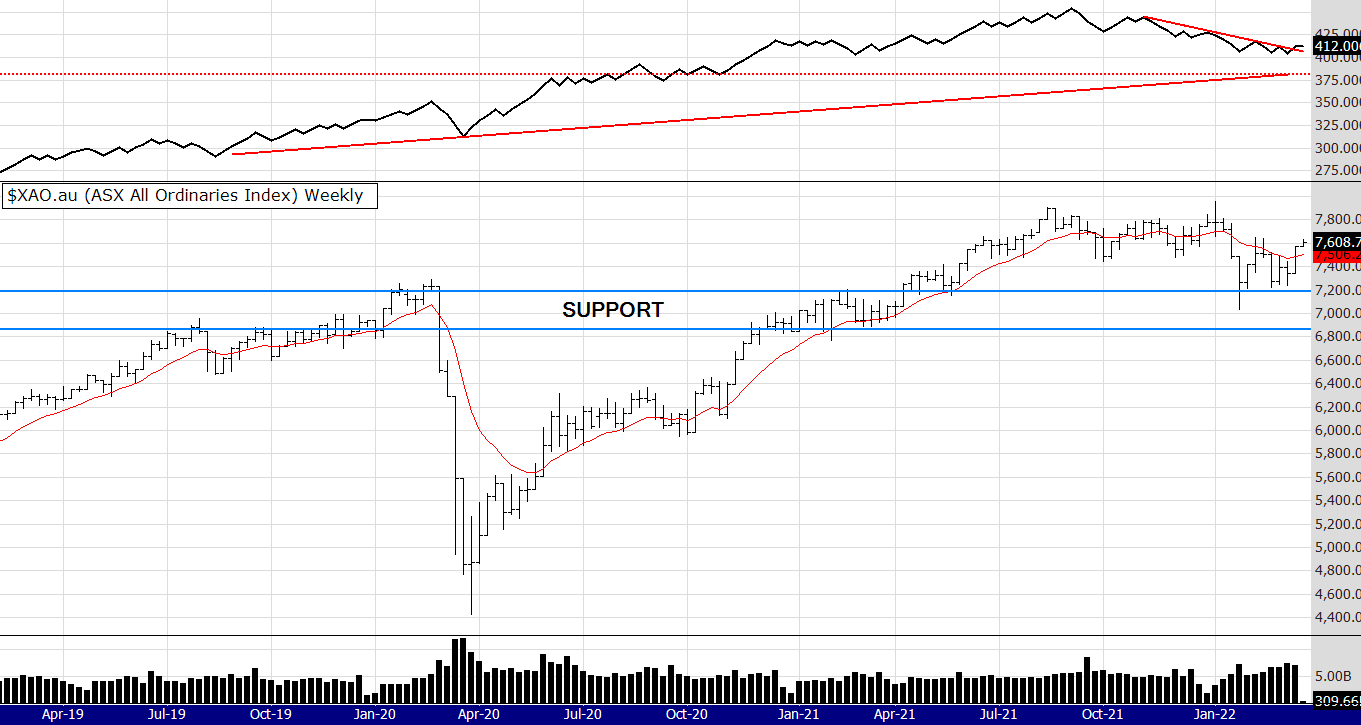
Well what a difference a week can make. This week the eBook system (that uses a Bull filter) triggered 15 buy alerts (see below). These were stocks hovering around the 52 week closing highs and waiting for the XAO index to give a Bull signal. The OBV line has moved up breaking through the initial down sloping trend line. The question of course is -is this a bear market rally or the start of the cyclical rally into May?
It’s always emotionally difficult to commit to a system that has been out of the market for some time and then suddenly triggers a lot of buy signals. Last week I mentioned the Nasdaq 100 (see chart below from last week) and the possibility it may fall to 12,500. The index has rallied since and as I write (Midday 21/3/22) sitting around 14,350.
My thoughts and feelings are I am not convinced this correction is over, so as always we will just have to wait and see what happens.
See you next week, Peter
MARKET COMMENTS: As of 11/3/22: See charts below with an On Balance Volume indicator, a bar chart and a 12 EMA.

This week: the market is still falling, although at a slower speed. The trend of gold and some resource stocks dominating the market continues, as can be seen from the closing 52 week highs listed below.
I have a target on the Nasdaq 100 (see chart below) at 12,500. It is the 61.8% retracement level, taken from the high after the extended rally from the indexes all time high in Feb 2020. I think at that level we will start to see strong positive divergences on price and volume indicators, if the market is to stop falling and recover that level MAY be the point. 12,500 points is still another 800 points or around 6%. We might not fall that far or it might be a one day spike down, who knows, I just think it's a level to watch.
If the Nasdaq falls to that level of 12500 the probability is that the XAO will come under pressure, taking it below or around 7000, smack in the middle of the support lines on its chart. Looking again at he XAO the OBV is still looking weak, the 12 EMA is trending down. The only positive is that volumes are high (on both charts) indicating that the sellers may be getting exhausted. We probably need one more big plunge down to eliminate all the sellers so that there are none left, allowing the pendulum of bulls and bears to swing back to the bulls.
Have a good week and see next week, thanks for reading.
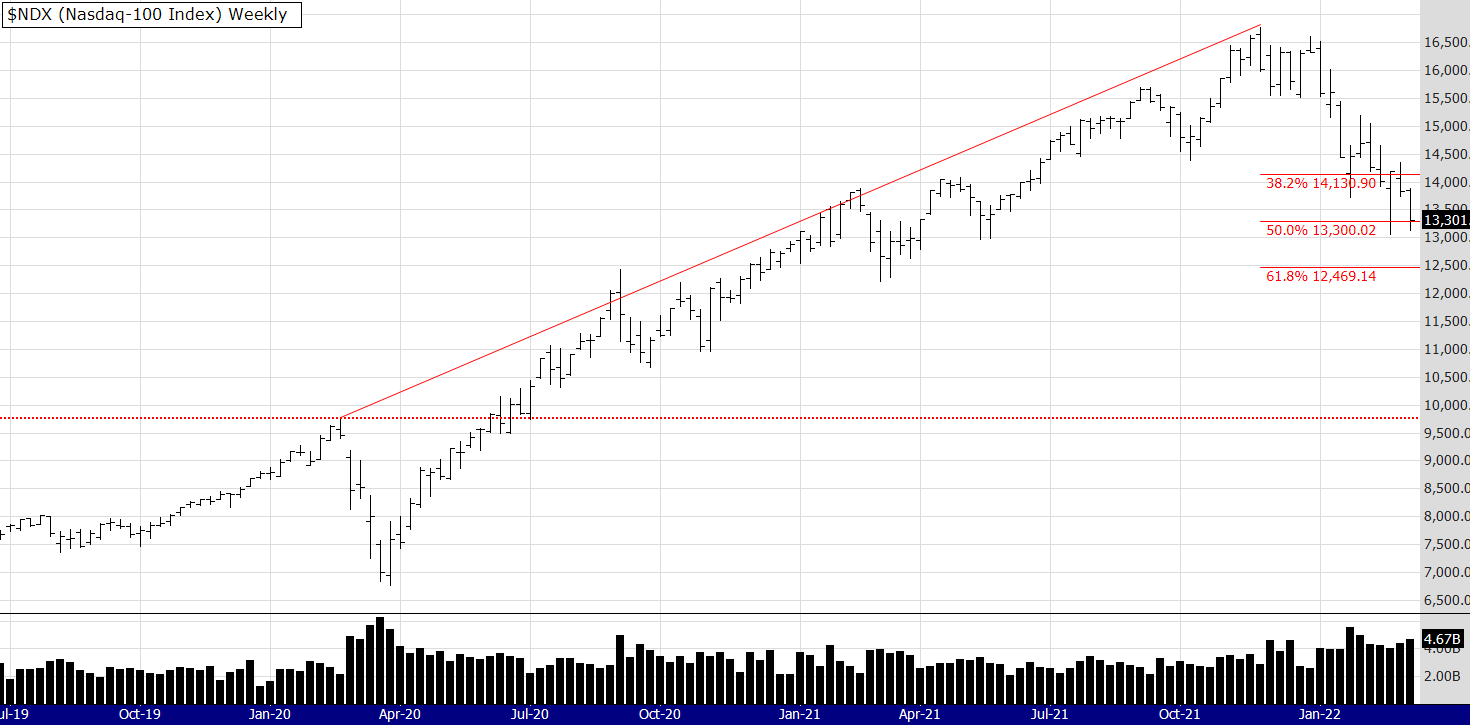
MARKET COMMENTS: As of 4/3/22: See charts below with an On Balance Volume indicator, a bar chart and a 12 EMA.
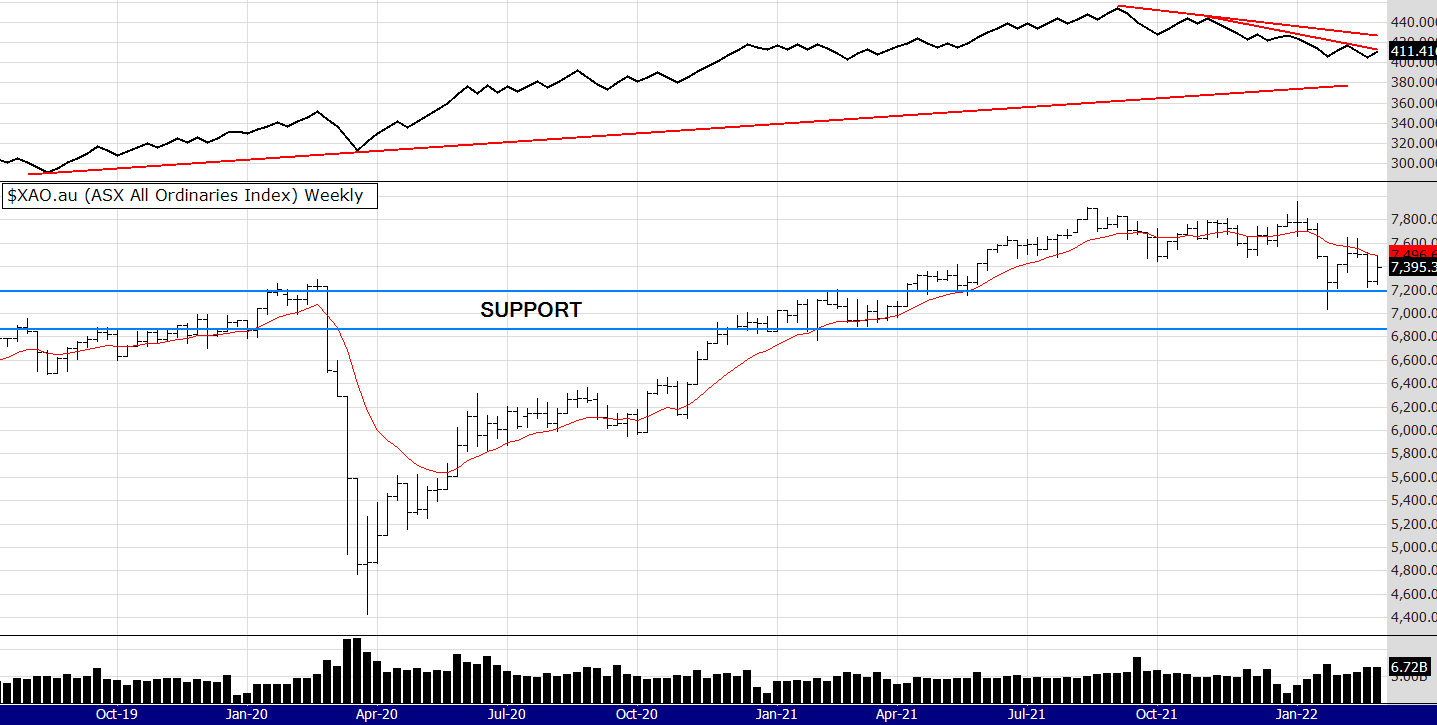
This week I think it's worth repeating what I said last week, here it is:
A few weeks ago I thought the levels between 7000 and 7200 would be a support area, however looking now with the continual bearish sentiment and chart above, it seems lower levels of 6800 to 7000 look more feasible.
The OBV could fall down to its longer term trend line and the index price to 6800. I would think that would be a good support area but it all depends on overseas events. I heard on the news this morning Putin is now rattling the sabre sword of nuclear weapons, so of course that will not help sentiment. Coming back to the Australian market there are still stocks making new closing 52 week highs, most of these still being in the resilient sectors of banks, mining and real estate, one wonders how long this can last with the current mood.
This week: the performance of SOME stocks in the market continues. Gold stocks are performing well along with the rising gold price, also coal stocks had a huge rally triggering 52 week closing highs in WHC and YAL. The other stocks to trigger were 2 gold stocks (PRU and WGX) and an oil stock (STO).
The chart above of the XAO is very resilient, being held up by resource stocks and the $A. Australia is a resource based economy devoid of many of the sexy industries (Tech for example) but in times like this it can outperform many other global indexes. We are seen as a safe haven. The chart above is looking like it wants to consolidate. I don't see the volumes and healthy technical divergences happening just yet, however they may not be far away - depending on OS events of course.
There is another consideration too. We are now in the cyclical time of the year when stocks often start to falter and decline with the oncoming mentality "Sell in May and go away". However who knows about that one! Shorter term cycles have gone completely out the window the last 2 years. I think we still need to be mindful of the great uncertainty that exists and as we know markets HATE uncertainty and until some of that uncertainty subsides I expect markets to remain volatile.
Have a good week.
Peter
NONE. The bull filter is negative
MARKET COMMENTS: As of 25/2/22: See charts below with an On Balance Volume indicator and a simple line chart.

Let's keep things simple amongst the noise. There certainly is plenty of noise and worry at the moment. The market is down trending, no doubt about it, the question is where is the support? When I say support I mean technical support, for keep in mind technical support areas will be breached if external economic conditions worsen.
A few weeks ago I thought the levels between 7000 and 7200 would be a support area, however looking now with the continual bearish sentiment and chart above, it seems lower levels of 6800 to 7000 look more feasible.
The OBV could fall down to its longer term trend line and the index price to 6800. I would think that would be a good support area but it all depends on overseas events. I heard on the news this morning Putin is now rattling the sabre sword of nuclear weapons, so of course that will not help sentiment. Coming back to the Australian market there are still stocks making new closing 52 week highs, most of these still being in the resilient sectors of banks, mining and real estate, one wonders how long this can last with the current mood.
See you next week.
MARKET COMMENTS: As of 18/2/22: See charts below with an On Balance Volume indicator and a 12 EMA

We have an interesting market. Its being held up (IMO) by the banks, miners and now property and education stocks, all in the hope the Aus economy is getting back into "normal". However the US markets are feeling the sell off in Tech, dragging down other indexes. I find it difficult to see us not following the bearish sentiment. Gold stocks had a good week, I notice some profit taking (me included) on Friday. The US gold index XAU had a small retracement last night.
The chart above still looks bearish. The trend line is pointing down, the OBV is too. There are no positive divergences. Interestingly though, we did have quite a few new closing 12 month highs, (see alerts below) a reflection of what I said in the above paragraph. Other sectors though are dragging down the index.
MARKET COMMENTS: As of 11/2/22: See charts below with an On Balance Volume indicator and a 12 EMA

The above is a live chart posted Tuesday 15th. The market has had 2 up weeks but indicators are still pointing down. I mentioned recently about gold, the price has rallied but the stocks are not really performing that well - not as well as I would have thought anyway. Going back to the chart above, if the OBV trend line breaks down then it will be a bearish sign, however I think the market is actually holding up quite well considering all the doom and gloom. Commodities are strong and the Aussie market can outperform the US market when that is the case.
Over the last 2 years the US market has outperformed the Aussie market but now with commodities rising our index that is heavy with big resource stocks may hold up well. The banks will play a part too if the housing boom continues (as is predicted by some cycle theorists) .
PS: My blood test revealed no Covid or anything else so the mystery continues. Or maybe its just the Flu! (what is that) Thank you for all your kind messages, much appreciated, and I hope there are less errors in this weeks post.
Peter
MARKET COMMENTS: As of 4/2/22: See charts below with an On Balance Volume indicator and a 12 EMA

Apologies for not posting for a couple of weeks. I have been quite ill with a mystery flu that has not shown up as Covid with two PCR tests, so some more testing results (blood) coming this week. Anyway, despite the "don't know" factor I am getting better, so that's the main thing. We dont always need to know do we? :)
The chart above still looks bearish to me, despite the bounce we have had. The moving average is pointing down and so is the volume indicator. The bull filter is bearish and if you are trading the eBook system then you will not be buying. A good sign would be for the OBV line to start showing some strength or support, which it is not. This market could fall more so unless you are a short term trader looking to take quick profits in a volatile market (many are) its probably best to stand aside and wait for the dust to settle.
I personally have a few trades on in the resources sector, particularly gold. The gold chart looks bullish to me but of course that can change at any time. I have been stopped out of all my crypto trades and am waiting to re-enter on a resumed up trend. I am watching Harmony and Polygon closely.
So I have been busy writing a book and it has taken a lot longer than I thought! I was warned this would be the case by a few colleagues. Anyway the publish date is not far away and if you want a sneek preview here is a link. Its been published and promoted by an English company, that explains the pricing in Pounds. Until next week, Peter
https://harriman.house/books/the-zen-trader/
MARKET COMMENTS: As of 14/1/22: See charts below
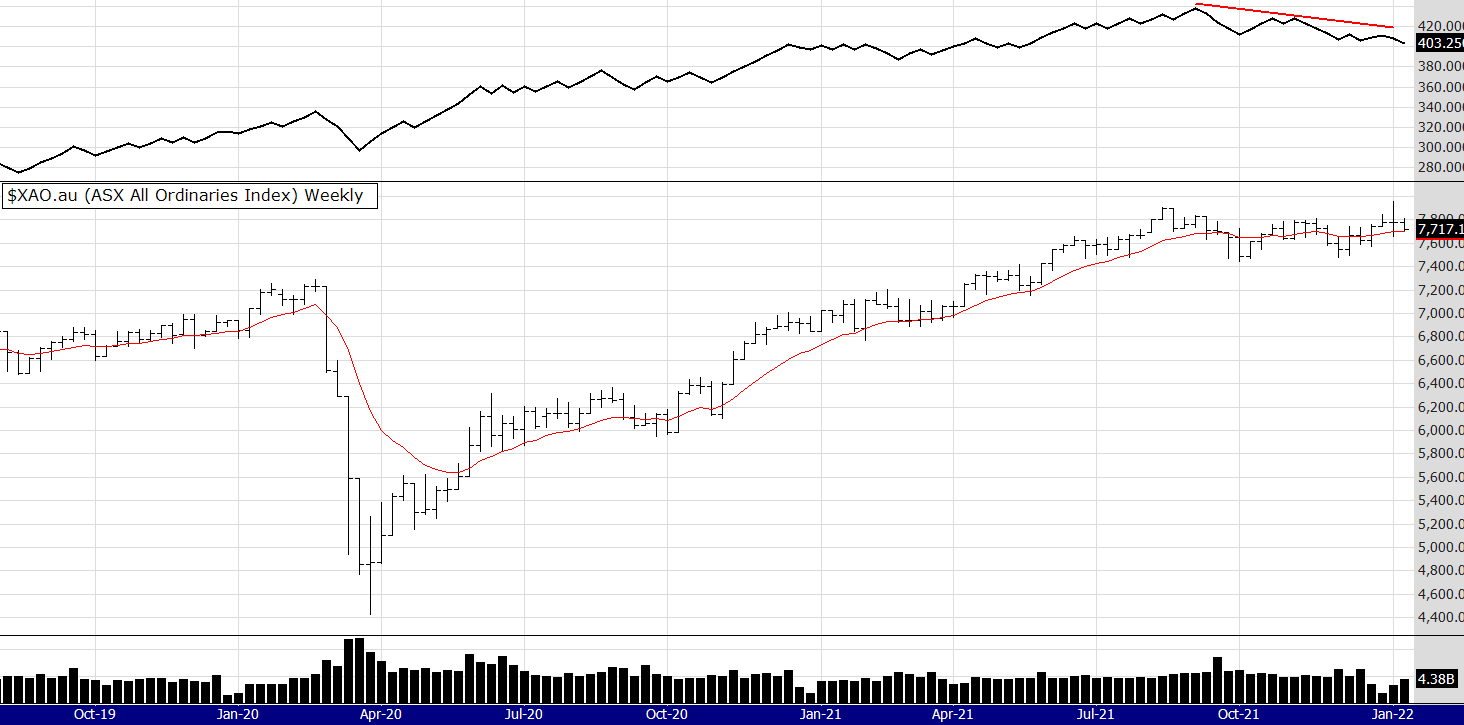
I have been talking baout this down trend in volume for a few weeks now. I was giving it the benefit of doubt considering the holidays and the normal low volume this time of year. However it is persisting and look ominous. There has been for a few months now, which is also persisting - the shift away from Tech into more traditional (value) stocks. I think the XAO index is being held up by the likes of BHP and other commodity related stocks. Yesterday I scanned a shorting system I have and it surprised me how many stocks in the ASX 300 were down trending.
Time to be cautious.
MARKET COMMENTS: As of 7/1/22: See charts below
The chart below has a 12 EMA and the On Balance Volume (OBV)
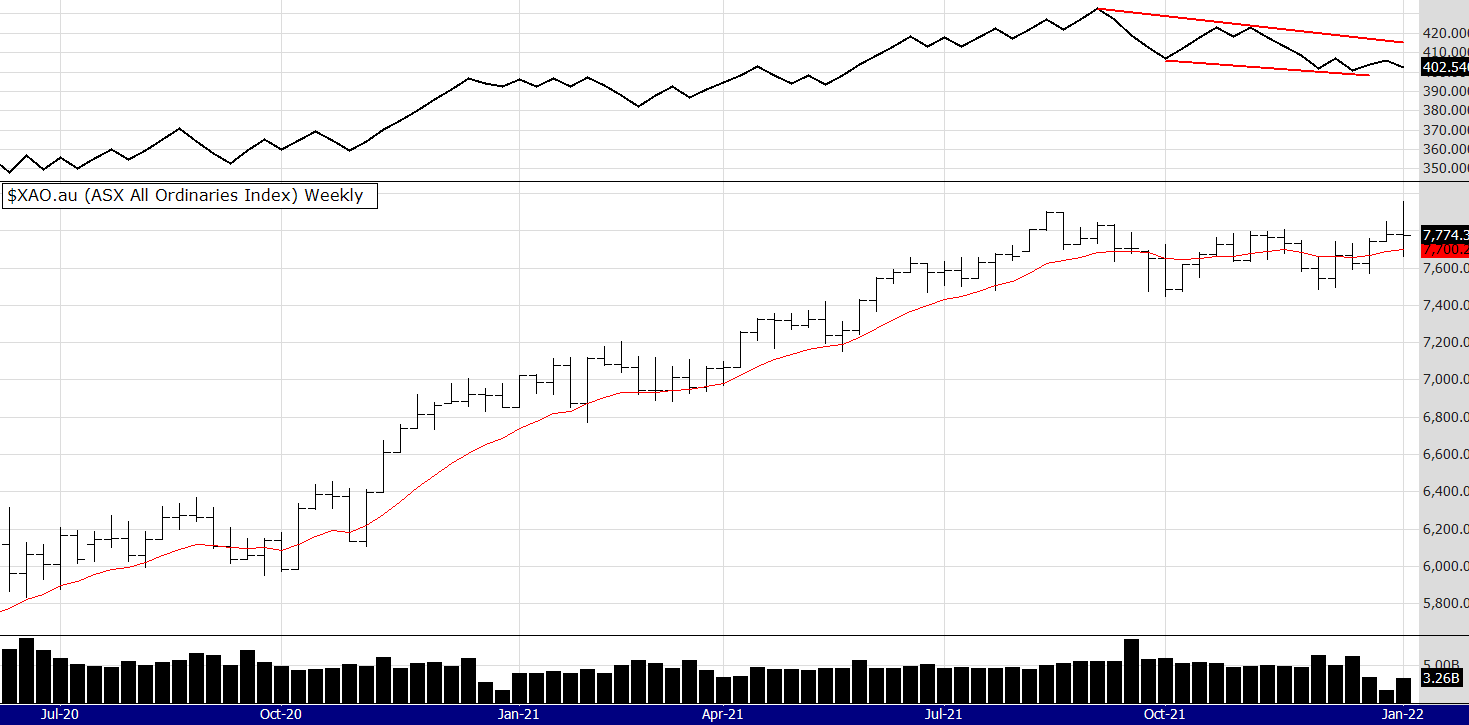
Welcome to the new year. Apologies for not posting last week. As I said a few weeks ago it is very difficult to analyse the Xmas period because of the reduced volume. It probably explains the OBV looking weak. The XAO has actually made an all time high, time will tell if it can continue on up. Commodities are certainly strong and Gold continues to play silly buggers. Alerts are below.
Peter
MARKET COMMENTS: As of 24/12/21: See charts below
The chart below has a 12 EMA and the On Balance Volume (OBV)

Its difficult to do much volume analysis this time of year. We have 2 trading weeks of only 3 days trading, so volumes will be low because of that and the fact it is holiday time.
However, do not go alseep at the trading wheel! Some good opportunities can exist. Often gold has a rally over Christmas. In fact last year I watched a fascinating doco about gold and astrology, with some convincing evidence, see the link below.
https://www.youtube.com/watch?v=ByowJSCvt0A
If you watched it then its is another example how we need to keep an open mind.
So, the bull filter is active and the market continues to defy gravity. 20,000 Nasdaq here we come ? Many alerts this week, see below.
:)
Merry Xmas to you all.
Peter
MARKET COMMENTS: As of 10/12/21: See charts below
The chart below has a 12 EMA and the On Balance Volume (OBV)
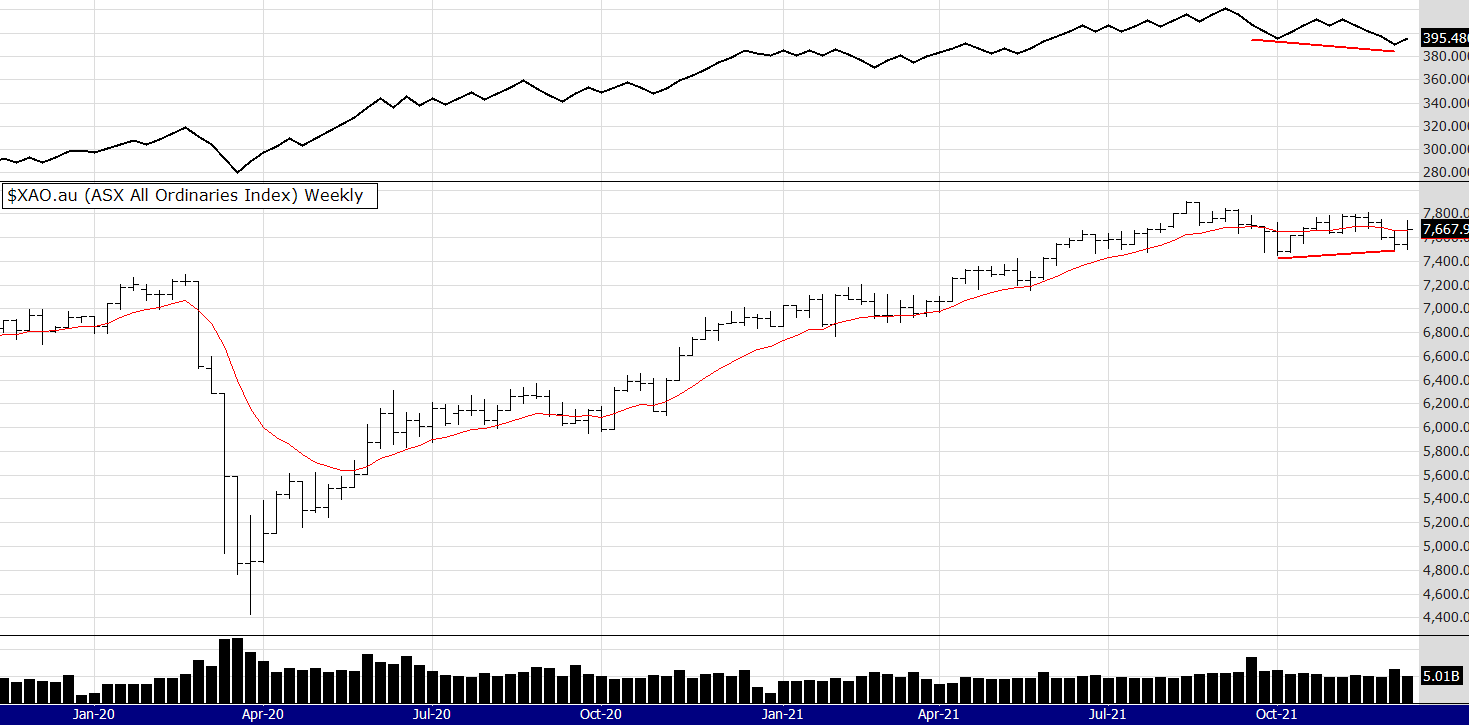
The XAO gets a bounce on the back of a US led recovery plus strong commodity prices. Perhaps too that the RBA will not cut rates so supporting the A$. The closing price pokes it head above the 12 EMA providing a buy signal for the eBook system - producing two buy signal in the ASX 300 (see below).
Volume support still warns of a negative divergence. The jury is still out - deciding the verdict of where this market is heading. Is it consolidating or rolling over for a bigger correction? Of course no one knows so all we can do is trade our method and do our best to stay calm. See alerts below.
Peter
MARKET COMMENTS: As of 3/12/21: See charts below
The chart below has a 12 EMA and the On Balance Volume (OBV)
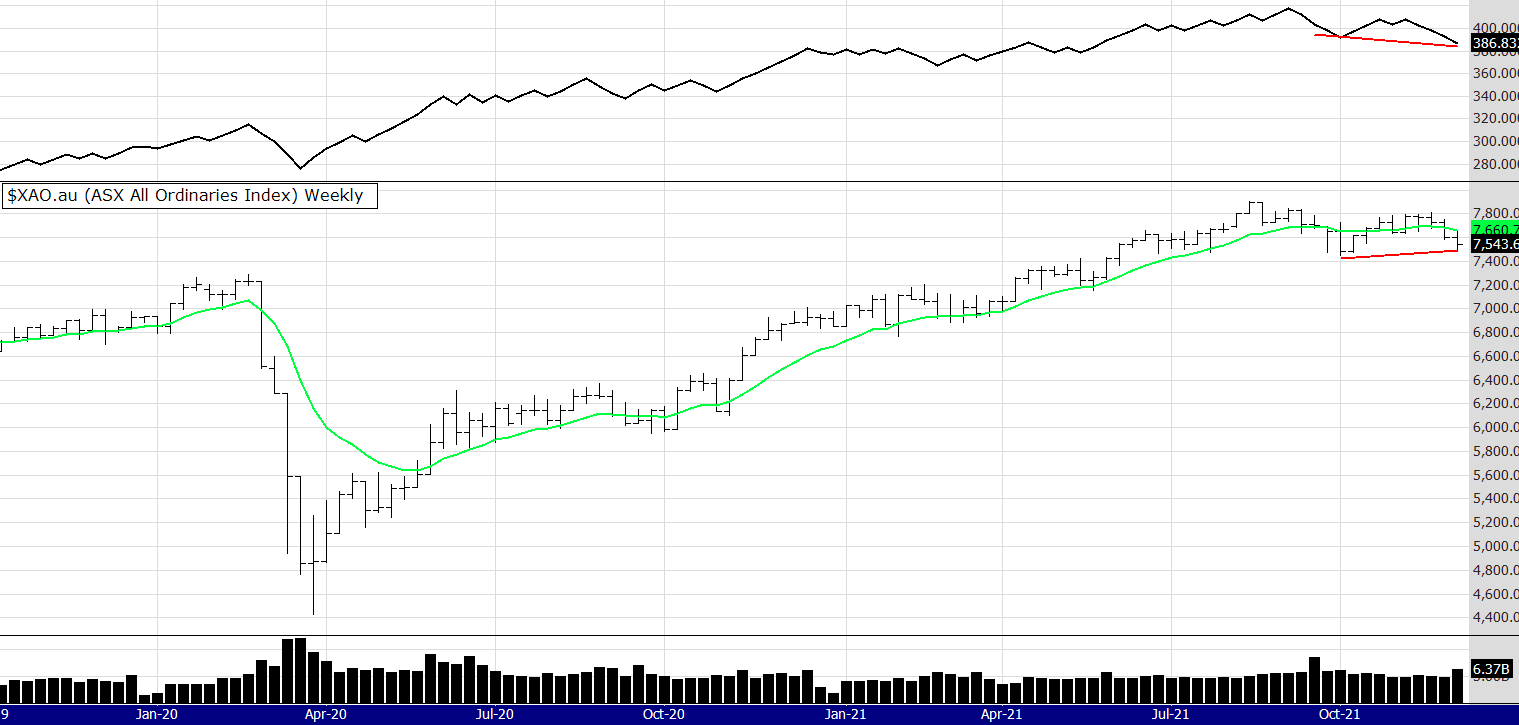
Now its looking more bearish than last week, and as we know the US markets had another fall on Firday night. The OBV is pointing down and it is leading the price. I suppose from a technical perspective we may get support at the old highs around 7400. However, as we know the XAO just follows the SP500 and if that index decides to fall more - so will the XAO.
I have been talking a lot about setting conditional sell orders in the market, instead of an EMA cross over, as that exit is too slow in these dynamic markets we have. Let's hope this is not the start of a meltdown but a healthy correction. Only time will tell.
MARKET COMMENTS: As of 26/11/21: See charts below
The chart below has a 12 EMA and the On Balance Volume (OBV)
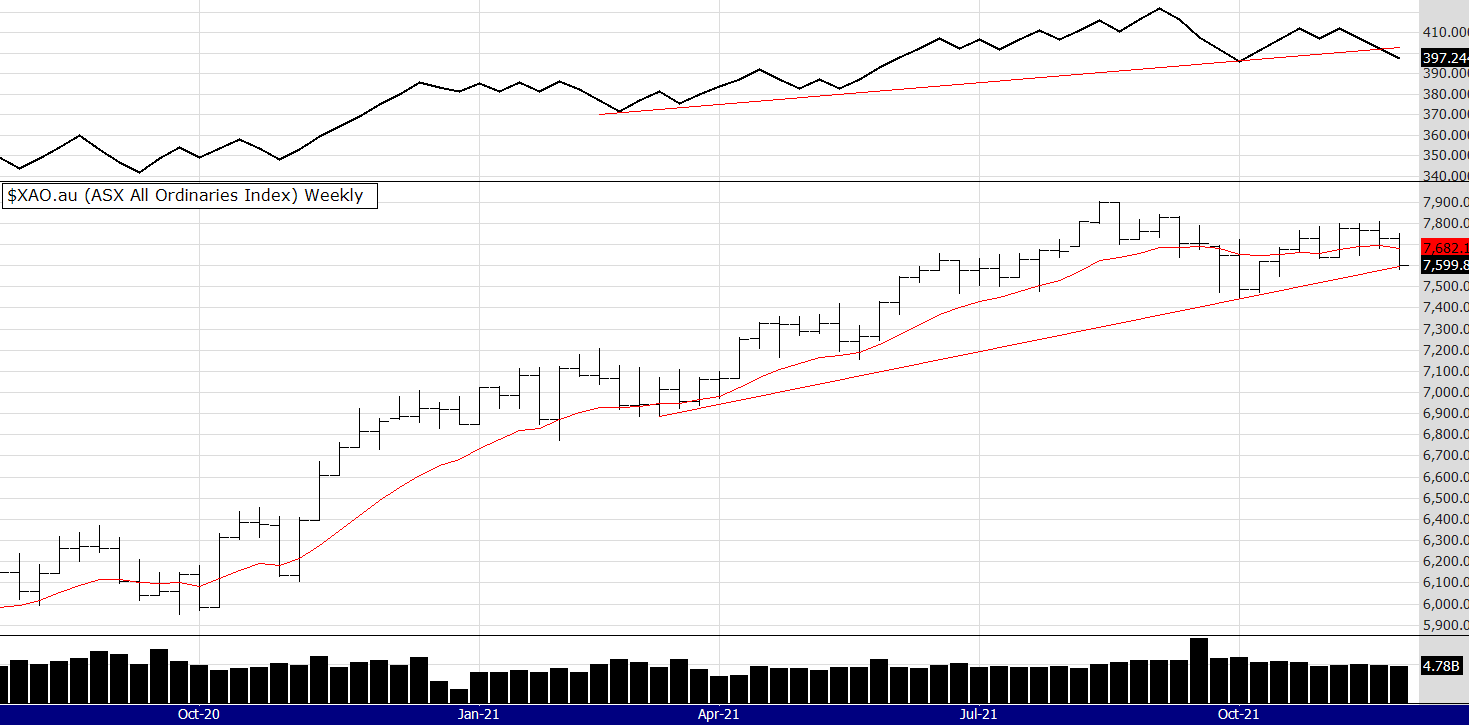
Not looking great is it? The OBV trendline has broken down. We know the US had a big sell off on Friday night due to new covid fears. The bull filter has turned negative . One of the few sectors holding up is resources, particularly gold. Let's see what this week brings.
MARKET COMMENTS: As of 19/11/21: See charts below
The chart below has a 12 EMA and three volume indicators, the On Balance Volume (OBV) the Money Flow Index (13 period) and weekly volume bars.

This week I have added a 13 period money flow indicator. It appears to be double bottoming and is at the lower part of its range.
It may bounce up. However we know the markets appear to be at an inflection point. Will the Nasdaq continue the rally, will there be a big rotation because of inflation fears, will it fall as fears take hold? The bull market is active and there are new buy signals this week. It's our mind that creates all these concerns - normally more than what the market deserves.
Scroll below for the signals, which are notably mainly resource stocks.
The signals below are so you can follow trades that make NEW 52 week highs for the 52 week high system.
MARKET COMMENTS: As of 12/11/21: See charts below
The chart below has a 12 EMA and two volume indicators, the On Balance Volume (OBV) the weekly volume bars.
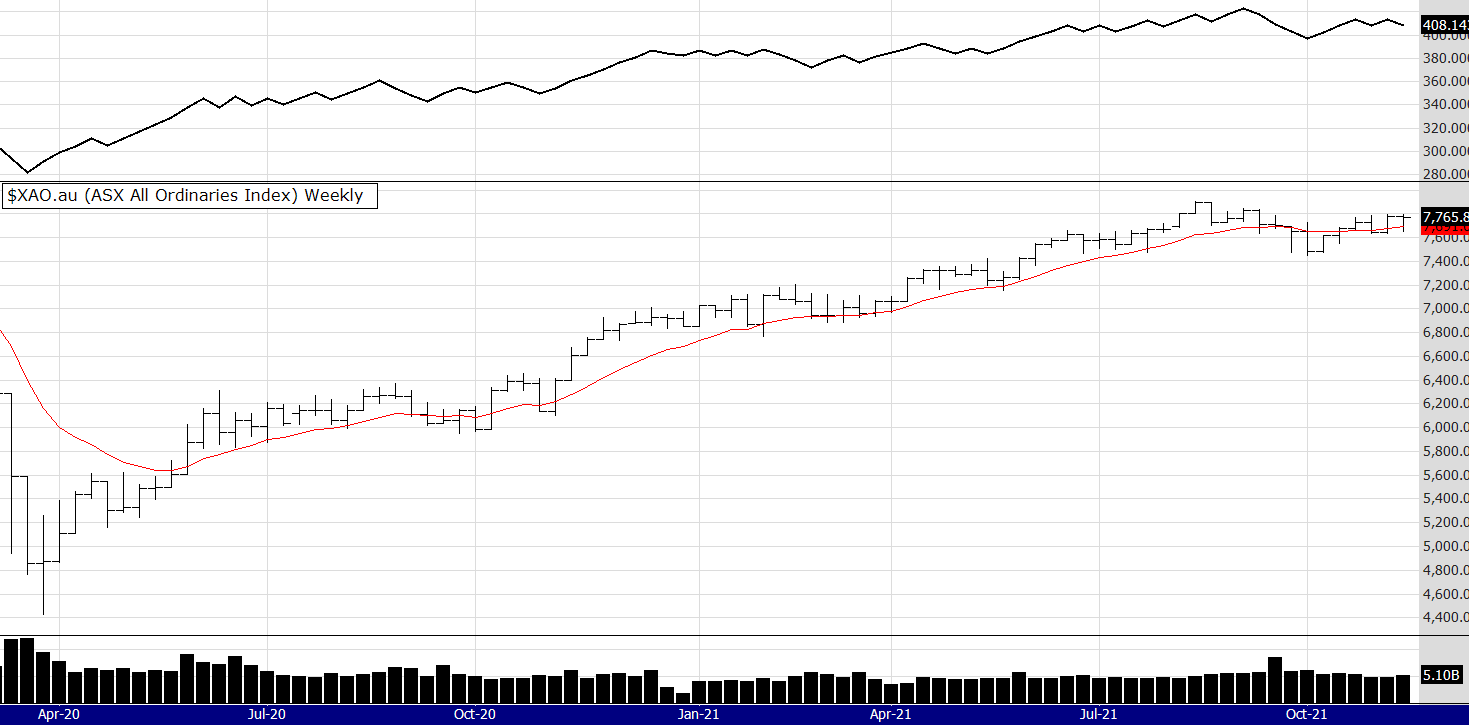
The Bull filter is again active. I said last week the US had a big rally in gold so expect fireworks in that sector. We certainly had that this week and there are a few gold stocks making 52 week highs this week. What normally happens now is the smaller gold stocks rally hard. If you are looking for opportunities in this market that could be the place to investigate.
Thank you for those that attended the ATAA on Thursday night.
Have a great weekend. Signals below.
MARKET COMMENTS: As of 5/11/21: See charts below
The chart below has a 12 EMA and two volume indicators, the On Balance Volume (OBV) the weekly volume bars.
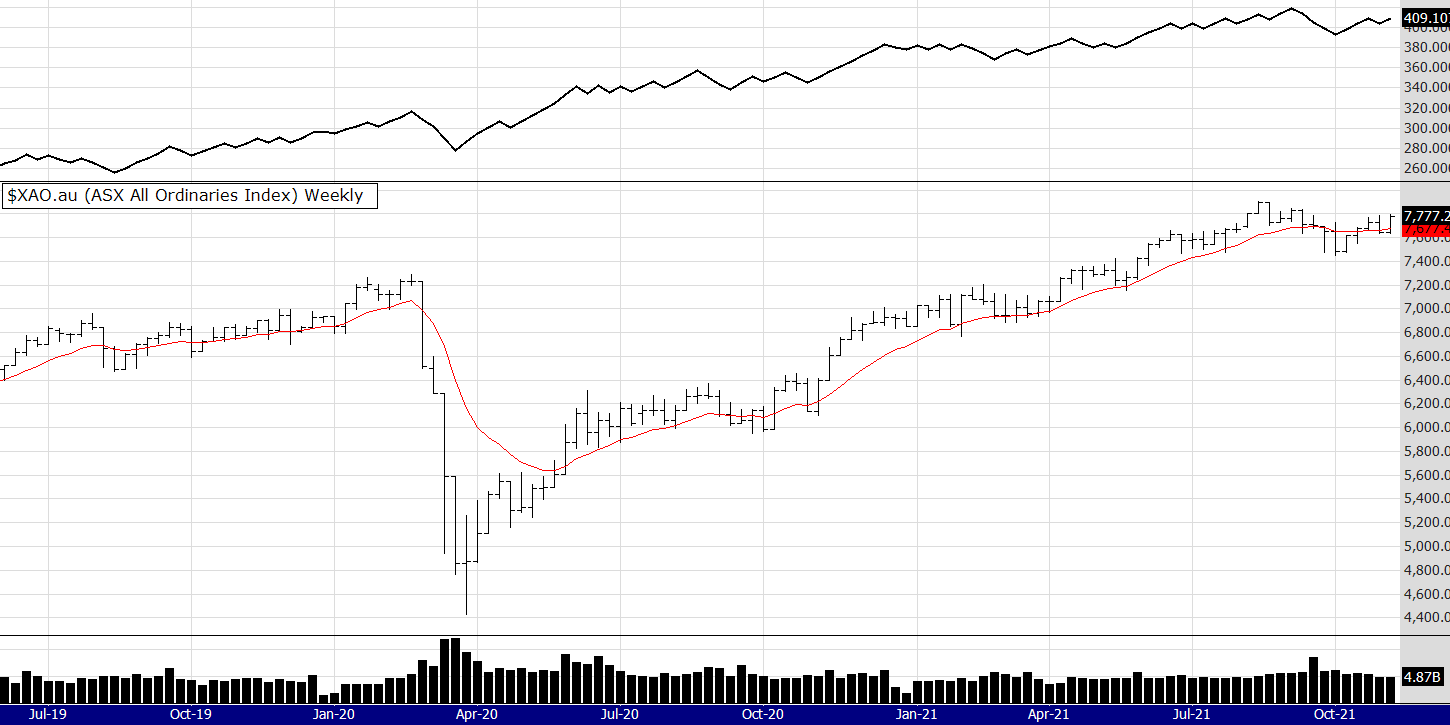
This market keeps on keeping on. So keep an eye out for my newsletter and upcoming ATAA seminar on Thursday 11th Nov.
The Bull filter is again active. I notice last night (this is written Sat morning the 6th) in the US a big rally in gold so expect fireworks in that sector Monday. I will expand more on my thoughts about the market during my seminar on Thursday. Its free for ATAA members and $15 for members.
Have a great weekend. Signals below.
MARKET COMMENTS: As of 29/10/21: See charts below (updates and comments for the week of 22/10/21 were not published)
The chart below has two volume indicators, the On Balance Volume (OBV) the weekly volume bars. It also has a 12 EMA.
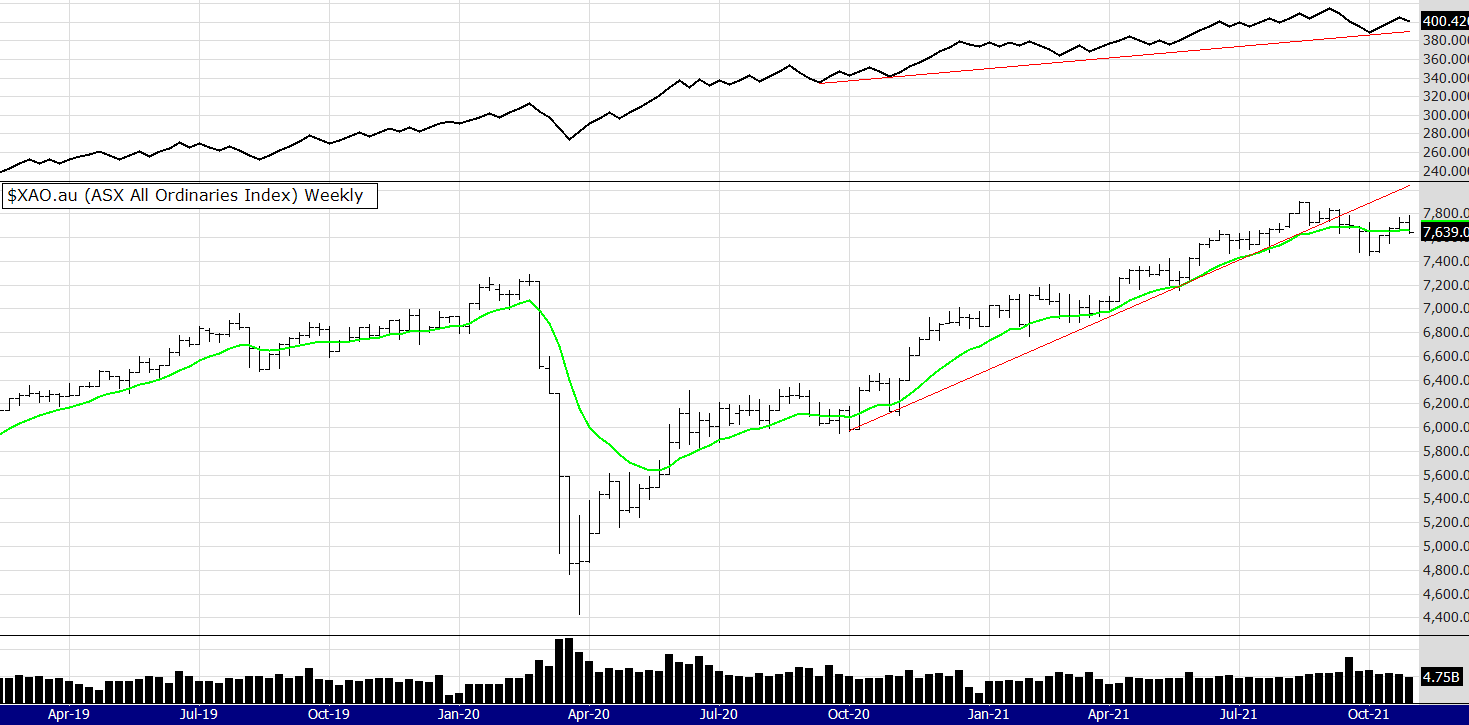
Apologies for missing the alerts last week.
We are always looking for some kind of leading indicator aren't we? No matter how elusive or perhaps even impossible it may be we keep trying. Looking at the chart above you can see the index has fallen below the bull filter. Also, the OBV seems to be hanging in there. The problem with OBV it is slow to react to price and volume change, that can be a good thing and sometimes bad, it depends on your trading time frame. The market has been on a strong rise and it was highly probable it would have a pullback. The thinking and feeling seems to be that a pullback is inevitable, probably to the old highs around 7200.
I suppose overall this chart is looking more bearish in the short term than bullish, so it is a time to be cautious and wait and see what happens from here. A reason why the bull filter is saying stop buying but hold positions. My systems with bear filters are tightening stops and starting to sell more quickly falling positions.
Trading is about having a system that suits your personality and objectives, then doing your best to stick to it.
Until next week, Peter
MARKET COMMENTS: As of 15/10/21: See charts below (updates and comments for the week of 22/10/21 were not published)
The chart below has THREE volume indicators, the On Balance Volume (OBV) the weekly volume bars and a 13 period money Flow.

The index bounces following the US. The 13 period money flow indicator was at levels seen at other extreme lows. The Bull filter is active. Interesting times as this market could explode up from here as the major trend is still up.
MARKET COMMENTS: As of 8/10/21: See charts below
The chart below has two volume indicators, the On Balance Volume (OBV) and the weekly volume bars.

I think I said enough last week. You can scroll down to see those comments under last weeks graph. We have a bounce in price and volume. If it can be sustained is another question. More 52 week closing highs this week so some are stocks performing strongly. No alerts for the eBook system as the bull filter is not positive.
The Nasdaq staged a strong bounce but it is the same story there, was it all a great buy point or not?
I will stick my neck out and say this bull market is not over yet.
MARKET COMMENTS: As of 1/10/21: See charts below
The chart below has two volume indicators, the On Balance Volume (OBV) and the weekly volume bars.

Last week I drew a trend line on the OBV where it was "holding the line". This week it has clearly broken. I have drawn another one at the next level of support, it goes back 12 months to Oct 2020.
I have also drawn a horizontal support line at around the 7300 level for the Aussie market.
The US market ended with a strong finish to their trading week. Looking at the chart below you can see what I mean. There is a lot of negativity and fear about the markets at the moment. However if you consider the Nasdaq as the major driver of this market, it looks like a normal pull back in a strong bull trend. Others will disagree but that is what makes a market.

I said a few weeks ago that 4500 is a point of support, it fell to 4550 before bouncing back up.
Of course if this pattern breaks down it then becomes more serious and perhaps the start of another correction. Unfortunately we don't know its direction otherwise we could bet the house. :)
One would expect some strength in the Aussie market on this weeks open, however by now you should know not to expect anything.
Until next week.
Peter
MARKET COMMENTS: As of 24/9/21: See charts below
The chart below has two volume indicators, the On Balance Volume (OBV) and the weekly volume bars.

I have reformatted the chart above to make it easy to analyse. You can see clearly that the price trend has broken down. It was a steep trend and it was inevitable that it would reverse sooner or later. Interestingly the OBV has not broken down. For every seller there there is a buyer, so what's going on? Is the market getting support here? It would probably be better for the longer term if the market corrected back down to around 7200. However if we are in the final blow off stage of a bull market and traders have Nasdaq 20,000 in their sights, this could be a "buy the dip" scenario.
Although not shown on the chart the Bull filter for the eBook system has turned to negative, so no alerts for that system this week. There are alerts for the 52 week closing high system and they are below.
MARKET COMMENTS: As of 21/9/21: See charts below
The chart below has two volume indicators, the On Balance Volume (OBV) and the weekly volume bars. It also has a 12 exponential moving average.
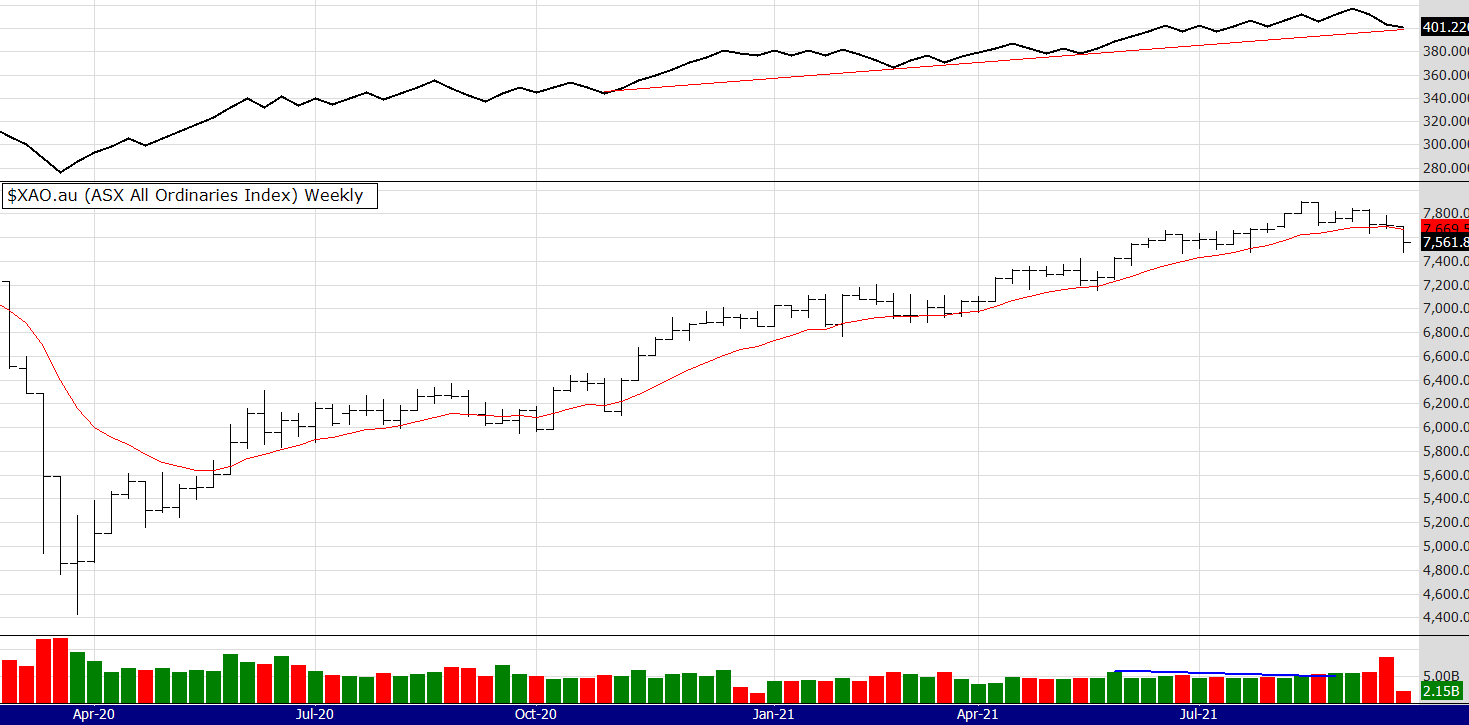
Hmm. Well the eBook system gave signals to buy on monday 20th Sept. They actually held up pretty wll considering the big fall that day. I must remember to put this chart up on the weekend, as I now have live data and the chart is showing the days trading on Tuesday (today as I write this).
So this week, or should I say at the moment the bull filter is telling us to wait. The OBV trend line is hanging in there. If it breaks down it would suggest more falls are coming. It's hard to see how after a big fall like that the market won't follow through with more selling. Traders have been talking about this fall for weeks and now it's arrived, I would expect the shorts to get excited.
However in a bull market it's hard to pick the top, no matter how over bought it may seem. This could be a Sept/Oct pullback before the rally into Xmas.
Who knows.
52 Week closing highs:
The signals below are so you can follow trades that make NEW 52 week highs for the 52 week high system.
52 week closing highs
A new 52 week high for this system is classified when the stock price is at its highest close (or equal to the highest close) counting back 52 weeks.
If a stock continues to make new highs, for example in the 53rd and 54th week, they are now regarded as ROLLING highs, not NEW 52 week highs.To clarify again, the buy signal for THIS system discussed is a NEW 52nd week or 1 year closing high, not a rolling high as is often given elsewhere.
The signals provided are WITHOUT A BULL FILTER.
The exit used FOR THIS METHOD is the 7/12 EMA crossover. Therefore, some stocks will be re signalling a new high buy signal if they have been recently exited by using the 7/12 exit within the last 12 months. This is important and you need to understand this.
Of course the 7 EMA needs to be above the 12 EMA to make the 52 week high valid, (otherwise we would be selling straight away) nearly always this is the case, but rarely if a stock spikes it is not.
So to repeat, the rules are: USING WEEKLY PARAMETERS!
Entry:
Share price to make a 52 closing (or equal to) week high (when selecting a buy, favour the cheapest stock)
The 7 ema to be above the 12ema
Exit:
if the 7 ema crosses below the 12 ema
The above system contains no position sizing, bull or bear filters or fundamental stock selection, these are discussed and taught to private clients or at my courses.
These are the 52 week closing highs (without a bull filter) for the week ending 17/9/21:
Remember these scans are not using a Bull filter. The signals are for the simple 52 week CLOSING high entry and 7/12 EMA crossover exit system only.
ASX 300
CQR IMU KAR QAN SCG CRN
ASX 300-500
HAS SMR SRV
52 WEEK HIGHS FOR THE E Book system: (That does use a Bull filter) If you are confused about the use of filters, I suggest you read well the comments about that above.
CQR IMU KAR QAN SCG CRN
My apologies for not posting charts for a few weeks. I have changed data providers and had a job reformatting charts etc.
MARKET COMMENTS: As of 10/9/21: See charts below
The chart below has two volume indicators, the On Balance Volume (OBV) and the weekly volume bars. It also has a 12 exponential moving average.
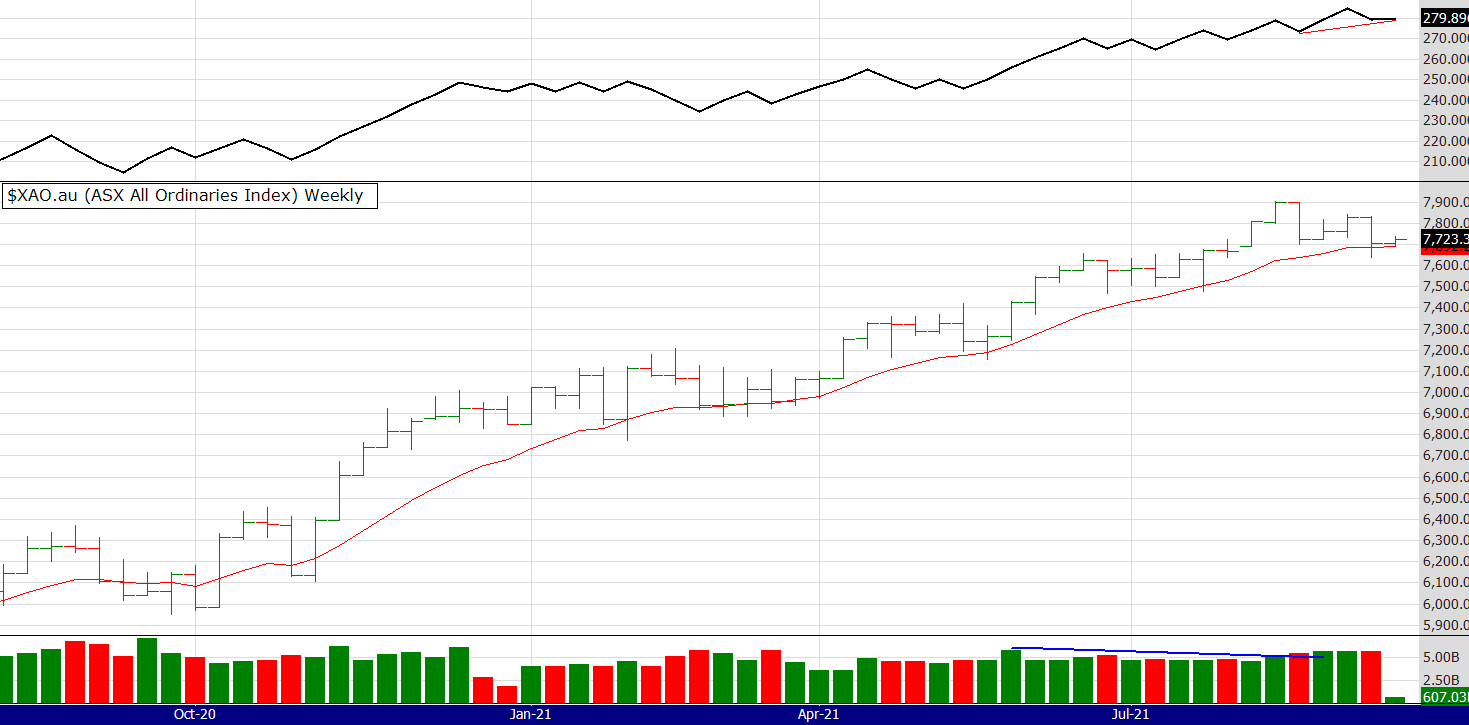
I am posting this at 2pm on the Monday following last weeks price action. That explains the small green up bar, (because of live data) after the big red down bar the market had last week.
The OBV indicator looks supportive, not falling the same as the price so that may offer some support this week. Only a few new closing 52 week highs this week, not surprising considering last weeks falls. The market "feels" nervous, I suppose it is September and it's not a strong month historically. See the chart below.
Until next week.
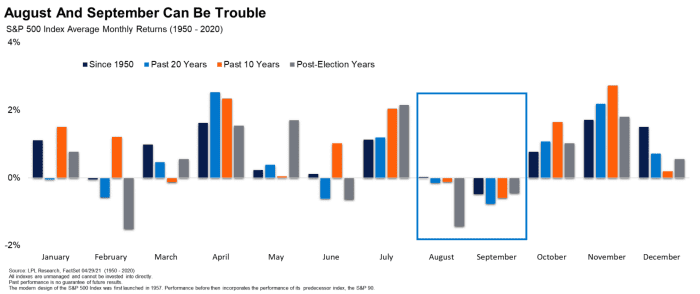
MARKET COMMENTS: As of 3/9/21: See charts below
The chart below has two volume indicators, the On Balance Volume (OBV) and the weekly volume bars. It also has a 12 exponential moving average.

Let's keep the chart simple with just the EMA and the OBV. You can see clearly what's happening, the market is screaming up. If I was not so busy with other things in my life I would be writing newsletters spruiking about my thoughts regarding Nasdaq 20,000. Ok, I can't help myself, the probability of that is increasing, the question is when? Hopefully not too soon as happened in the Dotcom year 2000, so it was not sustainable. The best outcome is a continuing slow rise.
However markets and humans are slow to learn. Have you read "Popular delusions and the Madness of Crowds" ? First publishd in 1841 it was one of the early works disussing crowd psycholgy. I recommend it. My thinking is that more likely the market will have a blow off rally, then a steep sell off.
Not surprisingly a lot of 52 week highs in the ASX 300 this week. I notice last night the gold price rallied, so expect a positive reaction in the Aussie gold stocks Monday. Sadly I got stopped out of my ETHUSD trade, but re entered once the trend resumed, since then I have bought some XRP (Ripple) and some Bitcoin gold.
Intereresting days.
Till next week, Peter
MARKET COMMENTS: As of 13/8/21: See charts below
The chart below has two volume indicators, the On Balance Volume (OBV) and the Money Flow Index (MFI)using a 13 week period. The MFI is displayed in green.
Another strong week with many 52 week closing highs, (see alerts below) It was a good week for me with ETHUSD continuing to rise. I sold out half my gold position which has recovered quite a bit. Also I bought into PRU and WAF. Wow, the strength of this market is something to behold. It would not surprise me to see a big push up soon, with lots of volume. Let's see.
MARKET COMMENTS: As of 30/7/21: See charts below
The chart below has two volume indicators, the On Balance Volume (OBV) and the Money Flow Index (MFI)using a 13 week period. The MFI is displayed in green.
MARKET COMMENTS: As of 6/8/21: See charts below
The chart below has two volume indicators, the On Balance Volume (OBV) and the Money Flow Index (MFI)using a 13 week period. The MFI is displayed in green.
Hi all, well this is one of the most interesting charts I have seen, and that is saying something after all the charts I have seen. This index looks very bullish to me. So last week I sold a lot of my gold stocks, I am only holding one now PRU. ETHUSD continues to rally, its gone crazy this week. I have a few lithium stocks going well and my China Tech trade is stagnant.
I do have a large position of Gold futures which got smashed this week, I think its oversold short term but will look to unwind that at the best prices. Gold just does not seem to be getting any love, Van Tharp says Bitcoin is the new Gold, he may be right.
This week I will be looking at "home" stocks, that means any stock connected to home life, as we have all been home so much and consumer spending stats show that is where peoples money is going, makes sense.
On a separate note, I have had a few passionate discussions with friends and family about the big C.
I am going to put on my Zen priest hat now. Please respect others decisions, be they vaxers, anti-vaxers or pro-choicers. I rarely talk about the big C because it seems many people cannot stay calm - but have to "take a side". As traders we embrace the philosophy of "dont know" and attempt to flow with the uncertainty the best we can. I suggest we do the same with other things in life, stay calm and show respect to others, despite them making decisions we do not agree with.
See you next week.
MARKET COMMENTS: As of 30/7/21: See charts below
The chart below has two volume indicators, the On Balance Volume (OBV) and the Money Flow Index (MFI)using a 13 week period. The MFI is displayed in green.
Hi, thought I would try something different. I am using a different volume indicator, the 13 week Money Flow Index, you can google it for more info.
So what's it doing, well I suppose you could call it a rising wedge, according to TA that's good, who knows, things turn on a dime. The market is up - again - is it getting boring? Not if your long I suppose. Well I was wrong about gold with it rallying this week. I was right about cryptos, I bought some more ETHUSD. I had a good week as my portfolio is heavy in gold stocks and ETH. I dipped my toe in the water with a small long position on China Tech, can it keep falling? I think it's oversold.
Also, I am in jail, Covid jail. Locked up. I am using the time to work on the house, the website, Zen, and strive towards more meaningful relationships with my partner and kids :) Everyone is a bit over it, (particularly home schooling) but as humans we need to look on the bright side. Things can always be worse.
I have painted the kitchen, the book is finally with the type setters, today I am running a zoom meditation then fixing a door. All the best and........
See you next week.
MARKET COMMENTS: As of 23/7/21: See charts below
The chart below has two volume indicators, the On Balance Volume (OBV) and the Chaiken Money Flow (CMF) using a 6 week period. The CMF is displayed in green.
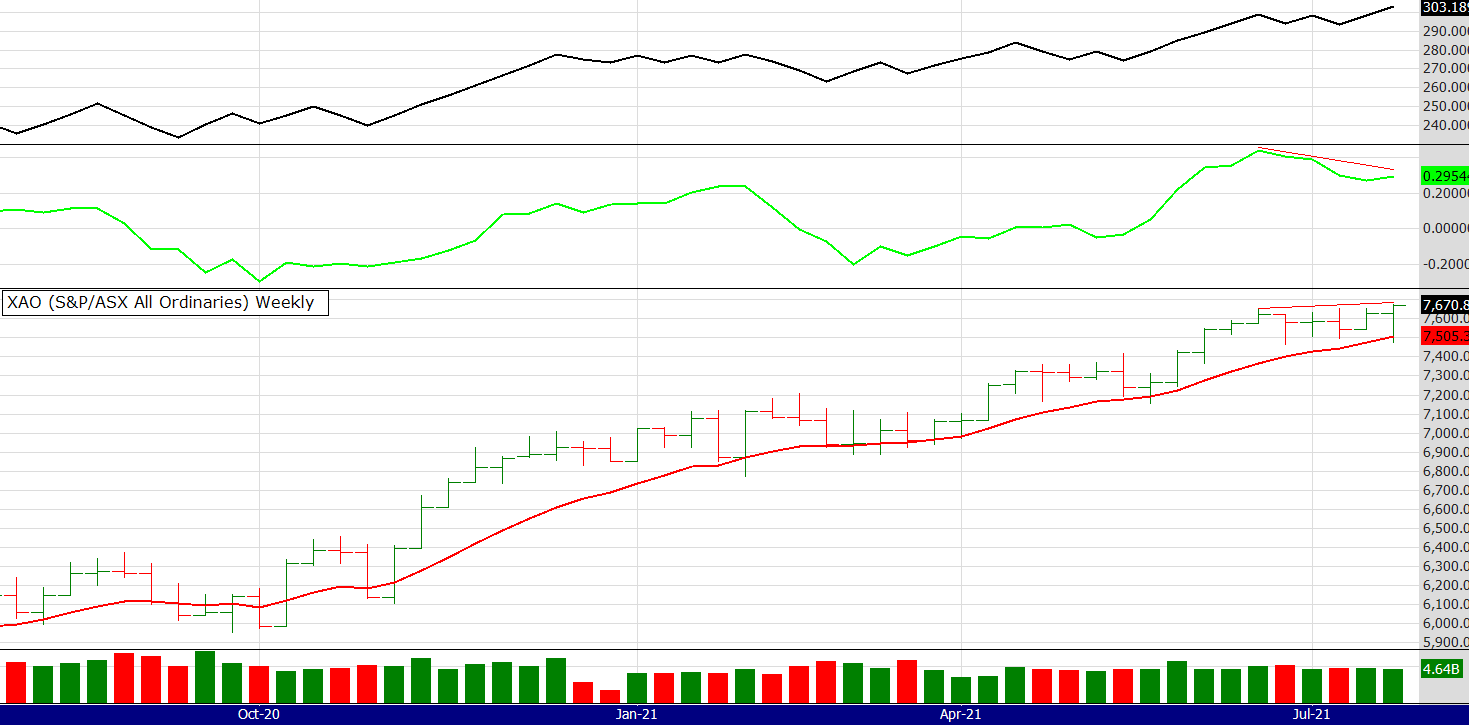
Perhaps you could start by reading last weeks comments. If you couldn't be bothered what I said was the market is still going up, defying gravity. Nasdaq 20,000 may not be far away. We now have a slight divergence between CMF and price, but its only a 6 week period and its not that reliable, the bulls could ignore it. The OBV is strong.
My Etherum trade has recovered. Last week it was 1850 and today its 2130. Why didnt I load up? The conservative trader in me said wait.
Gold is still struggling to make an impact. I am starting to wonder if this trade is going to fissal out. Tech is back in favour, American tech that is, Chinese tech stocks still getting belted.
Its an interesting world. The Chinese want to control all they can, it might come back to bite them. Cryptos have left the country, is that good? I dont think so, the Americans are not stupid, in debt maybe, but not stupid. They may find a clever way to incorporate cryptos WITH the dollar, now that would be something.
MARKET COMMENTS: As of 16/7/21: See charts below
The chart below has two volume indicators, the On Balance Volume (OBV) and the Chaiken Money Flow (CMF) using a 6 week period. The CMF is displayed in green.
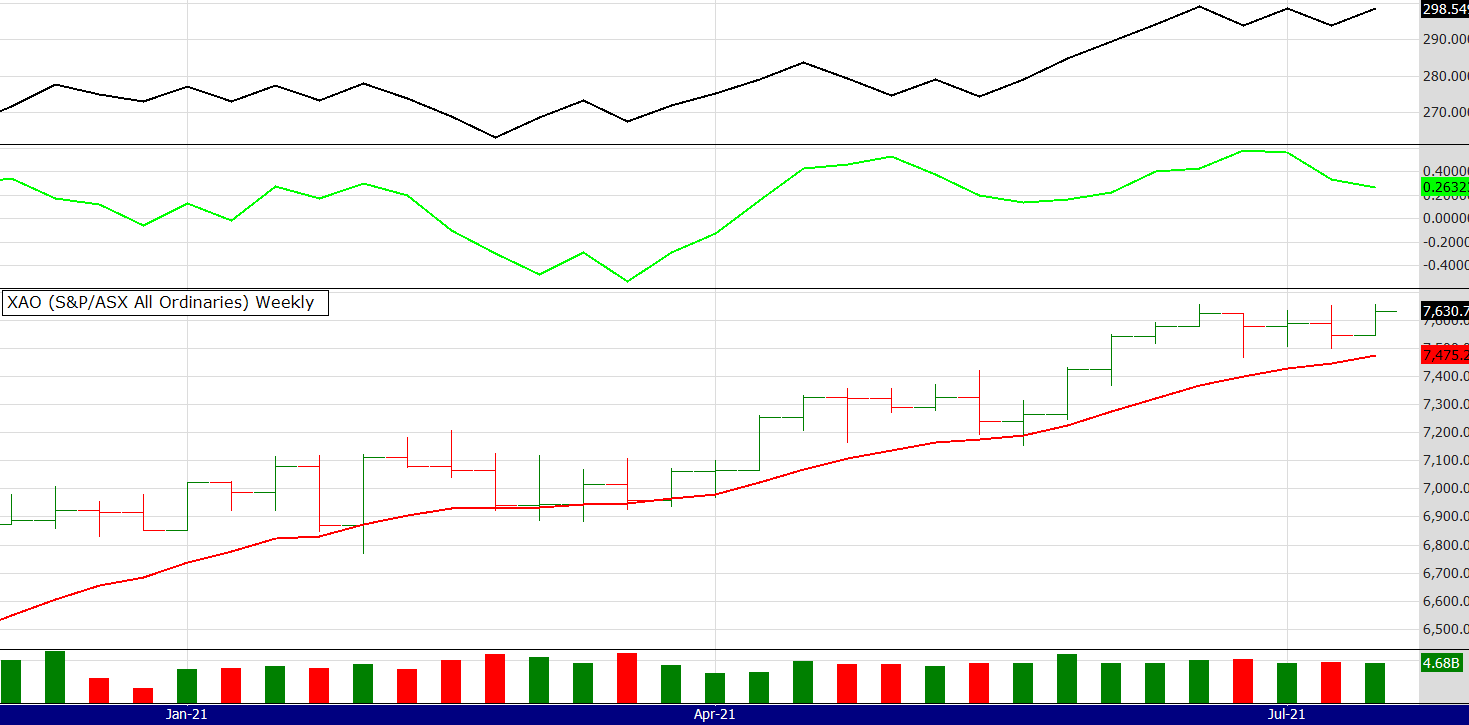
Yep, it's still going up. Until we get a clear signal it is over (the bull market) it is not. Difficult is'nt it?
I notice the miners had a good week. I find that interesting. If the world economy is heading for recession/depression than why are the miners rising? Is it the inflation factor pushing commodity prices up, or is demand still there from China and the world for more expansion?
Perhaps a little of both. Gold is reluctant to make a significant break to the upside, and cryptos are still languishing. Etherum (one I follow) does appear to be sitting on support, we will see.
MARKET COMMENTS: As of 2/7/21: See charts below
The chart below has two volume indicators, the On Balance Volume (OBV) and the Chaiken Money Flow (CMF) using a 13 week period. The CMF is displayed in green.

Lets keep it simple this week and remove the CMF indicator. So, despite the doom and gloomers and perhaps gravity, the market continues to rise. The US market had a strong close to the week so expect a rise on our market on Monday.
Price is up, so is volume. It's a bull market until it ends and no one knows when.
MARKET COMMENTS: As of 25/6/21: See charts below
The chart below has two volume indicators, the On Balance Volume (OBV) and the Chaiken Money Flow (CMF) using a 13 week period. The CMF is displayed in green.

I suppose a slightly bearish week this one. Not many 52 week highs and a red bar indicating caution. The CMF ( I have gone back to the longer 13 period) is very high, warning of an overbought condition?
Hmm, how difficult it can be to know..........However we are entering the time of year when markets often fall into October, then rally to Xmas. It's a time to be careful. Gold stocks look oversold but the gold price may not have bottomed quite yet. Despite all that the Nasdaq keeps going higher. I have a target of 20,000 but dont ask me when!
MARKET COMMENTS: As of 18/6/21: See charts below
The chart below has two volume indicators, the On Balance Volume (OBV) and the Chaiken Money Flow (CMF) using a 6 week period. The CMF is displayed in green.
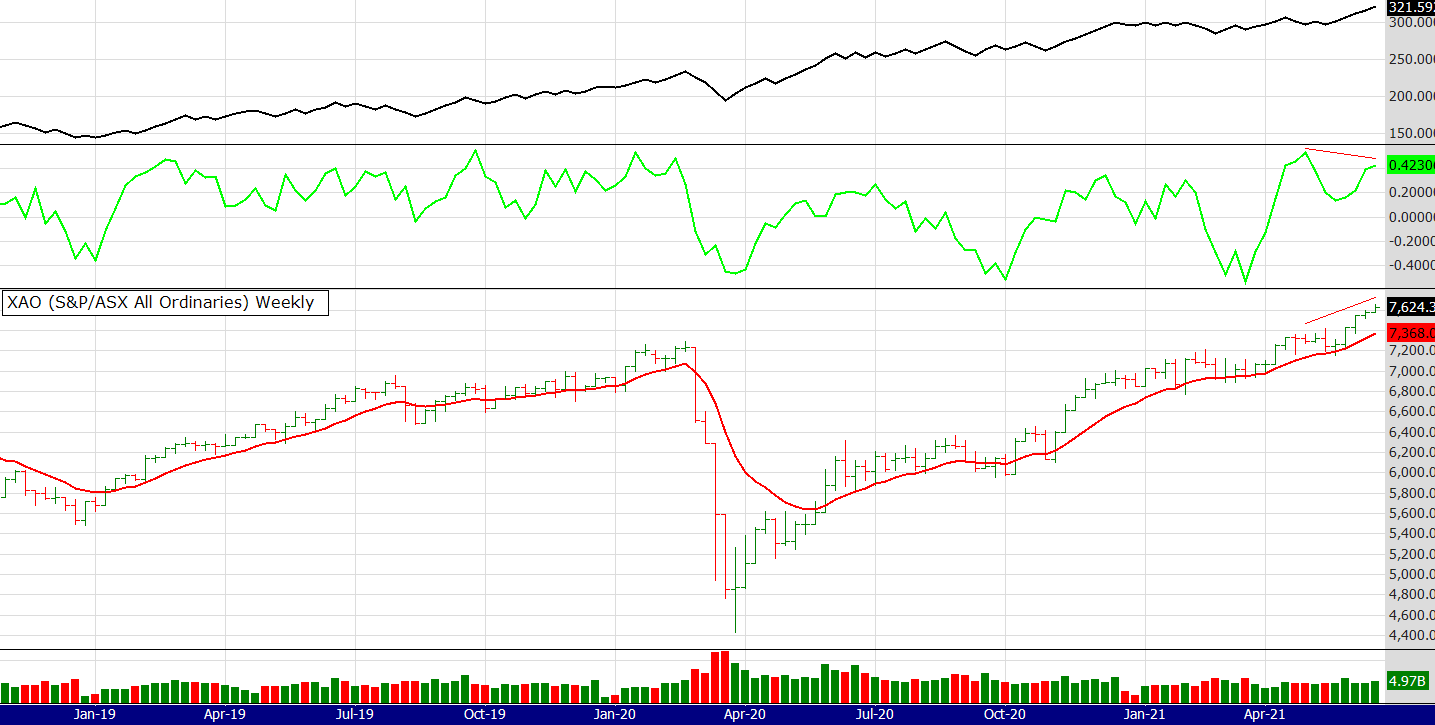
A very similar looking chart to last week. Same story too about the CMF divergence. The market is very bullish, new highs in many sectors. Who would have thought this 18 months ago?!
MARKET COMMENTS: As of 12/6/21: See charts below
The chart below has two volume indicators, the On Balance Volume (OBV) and the Chaiken Money Flow (CMF) using a 6 week period. The CMF is displayed in green.

The strength continues. Although now we have some divergence on the 6 period CMF. But the divergences that have been signalling lately dont seem to be having an impact on slowing this market down. When markets are so strong and trends are strong, you might as well throw away indicators in my opinion.
Have a great week and some good trades.
MARKET COMMENTS: As of 28/5/21: See charts below
The chart below has two volume indicators, the On Balance Volume (OBV) and the Chaiken Money Flow (CMF) using a 13 week period. The CMF is displayed in green.

Ha. Well my comments 2 weeks ago could not have been more wrong! Why do I bother? I suppose if anything it shows the power of sticking to a system and not getting mentally caught up in attempting to read charts.
I have taken the CMF back to a slower 13 week, it appears to be in a low area so the bulls will be looking to push it up with more buying volume.
The OBV is just powering, any wonder with that huge volume bar 2 weks ago.
The 52 week high alerts have come back in force this week, see below. I notice they are mostly in the ASX 200 where the "value" stocks live. There is talk of rotation away from growth stocks to value old economy stocks, time will tell on that.
Have a great week.
52 Week closing highs:
The signals below are so you can follow trades that make NEW 52 week highs for the 52 week high system.
52 week closing highs
A new 52 week high for this system is classified when the stock price is at its highest close (or equal to the highest close) counting back 52 weeks.
If a stock continues to make new highs, for example in the 53rd and 54th week, they are now regarded as ROLLING highs, not NEW 52 week highs.To clarify again, the buy signal for THIS system discussed is a NEW 52nd week or 1 year closing high, not a rolling high as is often given elsewhere.
The signals provided are WITHOUT A BULL FILTER.
The exit used FOR THIS METHOD is the 7/12 EMA crossover. Therefore, some stocks will be re signalling a new high buy signal if they have been recently exited by using the 7/12 exit within the last 12 months. This is important and you need to understand this.
Of course the 7 EMA needs to be above the 12 EMA to make the 52 week high valid, (otherwise we would be selling straight away) nearly always this is the case, but rarely if a stock spikes it is not.
So to repeat, the rules are: USING WEEKLY PARAMETERS!
Entry:
Share price to make a 52 closing (or equal to) week high (when selecting a buy, favour the cheapest stock)
The 7 ema to be above the 12ema
Exit:
if the 7 ema crosses below the 12 ema
The above system contains no position sizing, bull or bear filters or fundamental stock selection, these are discussed and taught to private clients or at my courses.
These are the 52 week closing highs (without a bull filter) for the week ending 28/5/21:
Remember these scans are not using a Bull filter. The signals are for the simple 52 week CLOSING high entry and 7/12 EMA crossover exit system only.
ASX 200
ALQ HUB PPT QUB SUL
ASX 200 TO 300
CQE
ASX 300 to 500
OCL
52 WEEK HIGHS FOR THE E Book system: (That does use a Bull filter) If you are confused about the use of filters, I suggest you read well the comments about that above.
ALQ HUB PPT QUB SUL CQE
MARKET COMMENTS: As of 14/5/21: See charts below
The chart below has two volume indicators, the On Balance Volume (OBV) and the Chaiken Money Flow using a 6 week period. The CMF is displayed in green.

I don't like the look of this chart. Mainly because the OBV line had broken its up trend, but I have been cautious on this index for a few weeks now. A little hard to see on this chart but if you zoom in you can see what I mean about the OBV trend line.
Although the price index is above its 12 EMA there are very few 52 week highs this week, only one in the 300 and one in the 300 to 500, which has been one of the strongest sectors. Its a turn around from last week when the market was looking strong again but the bears may be winning this fight around the levels we are at.
MARKET COMMENTS: As of 7/5/21: See charts below
The chart below has two volume indicators, the On Balance Volume (OBV) and the Chaiken Money Flow using a 6 week period. The CMF is displayed in green.
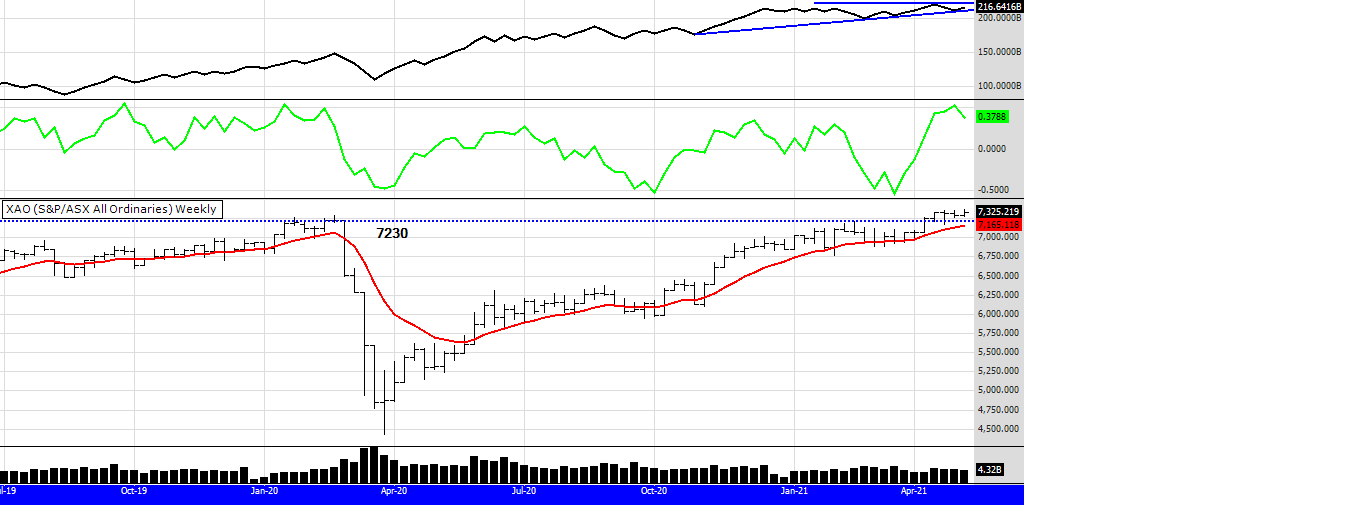
This chart looks similar to last weeks. Watching the market through the week it "feels strong". Although we are in May and the market has run so hard from the bottom in March 2020, it still may have more upside. It shows the fulility at times of technical analysis for at the moment things can go either way. The charts are hard to read even for this veteran.
The US had a strong close on Friday and the gold price rallied, I notice more strength in the junior stocks than the majors which is a sign that the bull market in gold stocks could be just getting going. The tech stocks bounced too, so I expect some good profits next week for those holding a diverse portfolio.
MARKET COMMENTS: As of 30/4/21: See charts below
The chart below has two volume indicators, the On Balance Volume (OBV) and the Chaiken Money Flow using a 13 week period. The CMF is displayed in green.
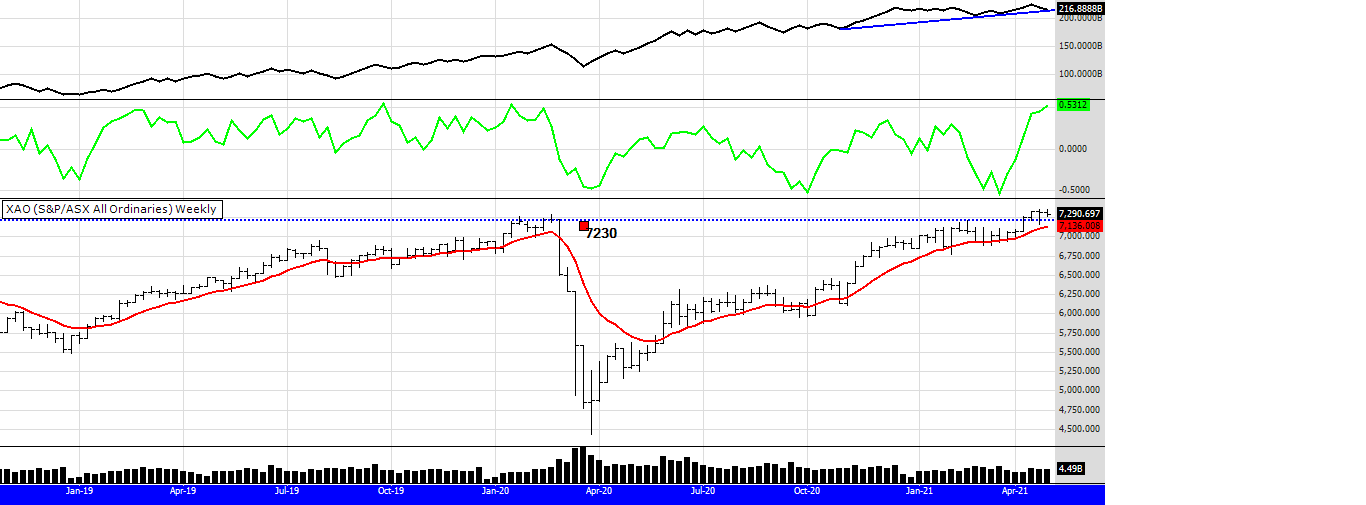
Ok. Well this is getting interesting. I have changed the CMF from a 13 weekly to a 6 weekly, to make it a little more dynamic (quicker).
As you can see it is up very high on the scale. Often when it gets this high we have a sideways period or perhaps a fall. A higher price but a failing of the indicator to also make a higher price is one to watch carefully. For example look at the CMF indicator just before Covid in Feb 2020.
The OBV has not broken the trendline, but if it does this will be a further sign the Sell in May voodoo is upon us.
If you are a discretionary trader it is probably a good time to be cautious. If you are a system trader perhaps prepare your self mentally for what could be a drawdown soon. We have not had one for a year.
MARKET COMMENTS: As of 23/4/21: See charts below
The chart below has two volume indicators, the On Balance Volume (OBV) and the Chaiken Money Flow using a 13 week period. The CMF is displayed in green. This graph also has a MACD.

A fall then a recovery this week. We really are just following the US (as usual). The US markets had a strong night Friday so "expect" a rise in our market on monday.
The chart below has two volume indicators, the On Balance Volume (OBV) and the Chaiken Money Flow using a 13 week period. The CMF is displayed in green. This graph also has a MACD.

I suppose the charts have been pointing to this rally. Big volume this week as the index makes a clear breakout to the upside. I was just looking at a monthly chart of this index, suggesting this rally could have quite a way to go. Will we get the Nasdaq 20,000 that I discussed last year? Also reviewing that possibility, if the Nasdaq is to repeat the 1999 performance (bubble) it will get to 25,000! So if you think we are in a bubble, compared to 1999 we are not if you use the performance of the Nasdaq as your guide.
Hang on to your hats if that happens. Or better still, have a system and stick to it because the volatility will be very challenging. I suggest employing a "tightening" exit. That means if you have stocks that fly up, you could change your exit to something quicker to lock in profits.
MARKET COMMENTS: As of 9/4/21: See charts below
The chart below has two volume indicators, the On Balance Volume (OBV) and the Chaiken Money Flow using a 13 week period. The CMF is displayed in green.

Well what a week. The index has now made a new weekly closing high. More significant (I think) than the intra day high that many look for. The last weekly closing high in Feb 2020 was 7230, now it sits at 7252. Low volume again because of the short Easter trading week, but indicators continue to point up.
Gold stocks (as I mentioned last week) had a big rally (why didn't I buy more?!) The altcoins also rallied again. They seem to rally over the weekends, are the crypto traders sitting at home on weekends trading driving the prices up? Who knows with that market.
All this just confirms to me, even after 25 years of trading, you just don't know what will happen in the markets. One needs to be prepared for anything. I think the best way to do that is to not expect anything, once we start expecting we can't flow with what is happening.
Peter
MARKET COMMENTS: As of 1/4/21: See charts below
The chart below has two volume indicators, the On Balance Volume (OBV) and the Chaiken Money Flow using a 13 week period. The CMF is displayed in green.

Well that was an interesting week. Low volume because of the 4 day trading week. However the trend remains up. The index looks to me like it will continue to rise, Easter may interupt that flow a little but it all depends on the OS markets. Cryptos look ready to roll again and has Gold hit its bottom? Gold stocks are suggesting this is the case. Gold stocks often lead the gold price and they have been resilient recently. It still seems as if crypto is winning re the crypto V gold battle, but why cant they rise together?
Anything can happen as this last year shows us. My condolences to the Byron Bay blues fest, I did some work on music festivals some years ago, some good people there and my heart goes out to them.
MARKET COMMENTS: As of 26/3/21: See charts below
The chart below has two volume indicators, the On Balance Volume (OBV) and the Chaiken Money Flow using a 13 week period. The CMF is displayed in green.

Apologies for missing last week. A few weeks ago I sustained a hand injury that required some hospital work, after quite a few injections and other drugs my head was not in the best place and I just needed a break :)
Anyway, here we are this week. Like I said a few weeks ago the market appears strong. The bull filter is still positive and volume indicators are coming off their lows. Wall St. finished higher for the week so that will spill over into our market Monday, well one would think so but as we all know over thinking can be our Nemesis.
If one was to be picky you could say the volume this week (up bar) was not as high as last week (down bar) but the overall trend is up. We still have about 6 weeks until mid May, when the dreaded Sell in May mantra is heard. Until then, as the market seems to often move in 6 week cycles, we could be in for a strong April.
MARKET COMMENTS: As of 12/3/21: See charts below
The chart below has two volume indicators, the On Balance Volume (OBV) and the Chaiken Money Flow using a 13 week period. The CMF is displayed in green.

Not a lot to say this week. I have similar thoughts to last week. Strength continues in this index, the banks really performing well helping to support this top 20 heavily weighted index. It may be the XAO top 500, but we all know banks and miners drive the index.
MARKET COMMENTS: As of 5/3/21: See charts below
The chart below has two volume indicators, the On Balance Volume (OBV) and the Chaiken Money Flow using a 13 week period. The CMF is displayed in green.
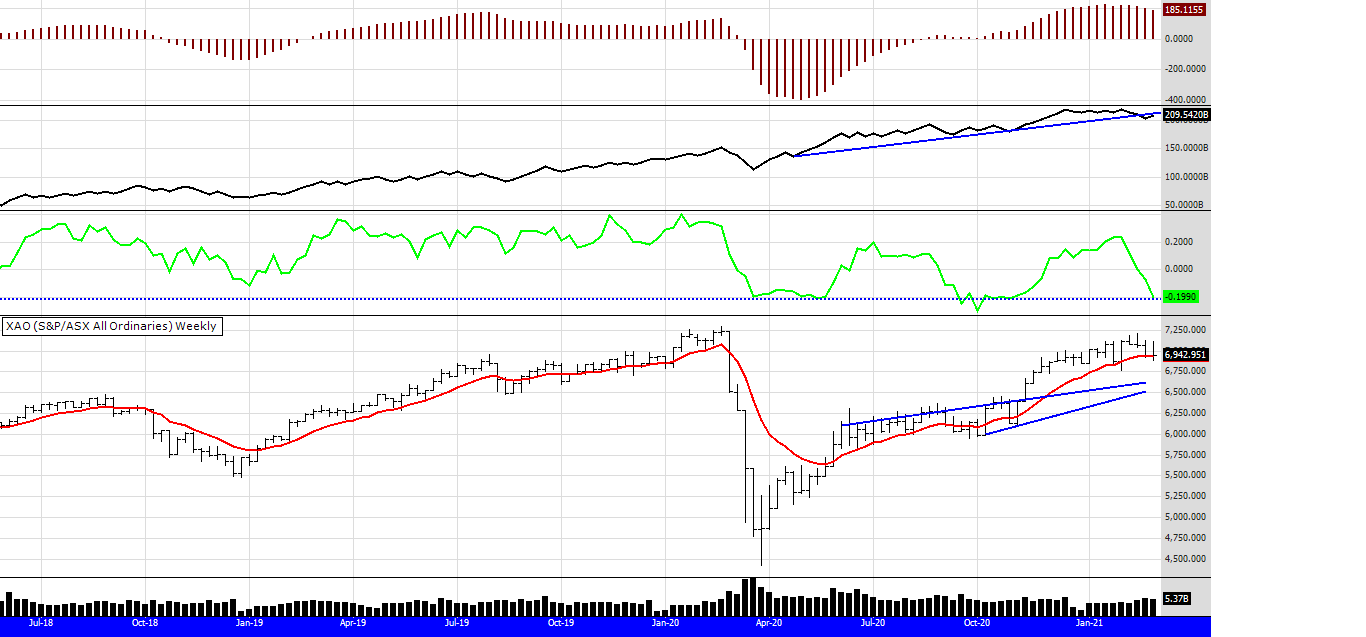
I was expecting the bull filter to breached this week, but it hangs in there. More 52 week closing highs this week, this seems a strong and resilient market. The CMF is now as low as it was during the Covid sell off, is the only way up from now? I drew some trendlines on the price chart, I was "expecting" the price to fall to around 6600 to get support but it may not do that. The OBV still looks a little bearish, but all else looks strong. Once we make a new all time high at 7,290 it may be off to the races for the Aussie market!
MARKET COMMENTS: As of 26/2/21: See charts below
The chart below has two volume indicators, the On Balance Volume (OBV) and the Chaiken Money Flow using a 13 week period. The CMF is displayed in green.
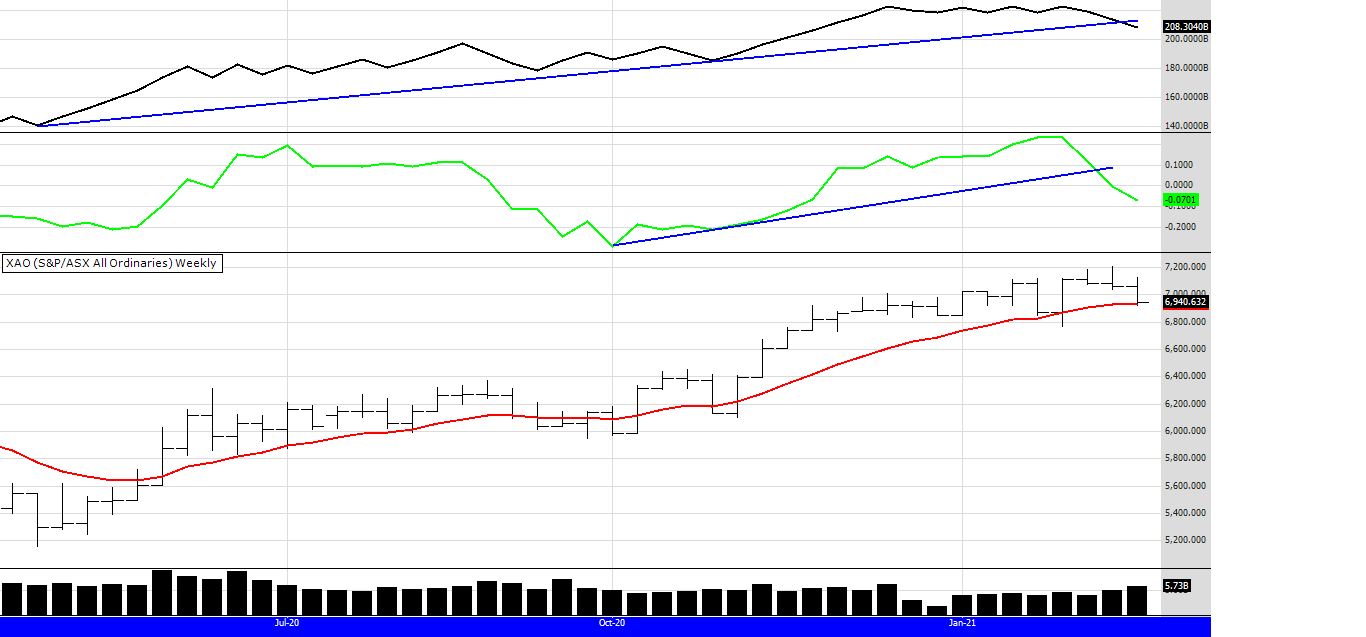
I have zoomed in on the chart this week. If you want a broader time frame look at last weeks chart. The volume filters are negative. The OBV indicator has broken its trend line. It is also lower than its lower low, the price has yet to catch up to this down trending indicator. Price is falling, volume is increasing, you can see that by looking at the volume bars on the chart.
This is a bearish looking chart. I know that the bull filter is still active (just) but I would be careful buying into this market at the moment.
There were again a lot of 52 week closing highs this week. The Aussie market is strong and money still flows into the small and mid caps. However, these stocks will fall if the index falls.
I see first support at 6600, then 6500 and 6400, lets see what happens this week.
MARKET COMMENTS: As of 19/2/21: See charts below
The chart below has two volume indicators, the On Balance Volume (OBV) and the Chaiken Money Flow using a 13 week period. The CMF is displayed in green.

This chart above looks a little "busy" with quite a few lines drawn. The bottom line (ha ha) is that the index looks a little shaky. Now I know I have said this before but some volume trendlines are breaking. Price is everything but falling volumes can give a clue.............I am watching that OBV line carefully.
Also this week there were many new 52 week closing highs. Now one would think this is a sign of strength but often there is a pullback from so many stocks breaking up and out.
Will gold and silver and the related stocks ever rally? I think when the cryptos take a breather there will be a rotation into that sector. It could be even happening today (Monday 22nd Feb)
Hope you enjoyed this little read. Peter
MARKET COMMENTS: As of 29/1/21: See charts below
The chart below has two volume indicators, the On Balance Volume (OBV) and the Money Flow index(MFI) using a 6 week period. The MFI is displayed in green.

Last week I said I was concerned about the market looking weak. We had a well overdue pullback but it still looks quite strong over the mid term. This index above could fall to 6600, perhaps less, but at that level the OBV trend line would still be in tact. Buyers and their money makes the market go up, if the buyers fall away price falls. A fall to 6600 is a 320 point fall from the recent top, so around a 5% drop. A 5% drop will shake a lot of people out of the market, particularly the newccomers that are not used to trading.
I have changed the MFI indicator to a 6 weekly as its more dynamic. You can see it is still pointing down.
If the volumes over the next week or two hold I think this will be a buy opportunity before the market marches upward again. 6,600 could be a gift (its now 6,870). There is a lot of talk about being in a bubble. The fact people are talking about a bubble to me is a sign we are not yet there yet. We will be in a bubble when my barber tells me to buy the Nasdaq. The other day he told me to buy EV stocks, not realising the run in EV stocks started 6 months ago and recently they were sold off heavily.
So, we aint there yet. Nasdaq 20,000 we will be.
MARKET COMMENTS: As of 22/1/21: See charts below
The chart below has two volume indicators, the On Balance Volume (OBV) and the Money Flow index(MFI) using a 13 week period. The MFI is displayed in green.

I admit to being concerned. However I have been wrong many times this last year so my thoughts and feelings mean nothing. We do now have a negative divergence between the 13 period MFI and price. Its not a big divergence so nothing may come of it, but it does suggest buyers are being cautious.
Crypto's have had a pullback, they were looking overbought, but everything looks overbought.
I was thinking today about my suggestion the Nasdaq may get to 20,000. When I said that is was around 7000 now its approaching 14,000. If it's to repeat the performance in 1999 and triple from the pullback low, then it's on target and we could get to 20000 this year.
MARKET COMMENTS: As of 8/1/21: See charts below
The chart below has two volume indicators, the On Balance Volume (OBV) and the Money Flow index(MFI) using a 13 week period. The MFI is displayed in green.
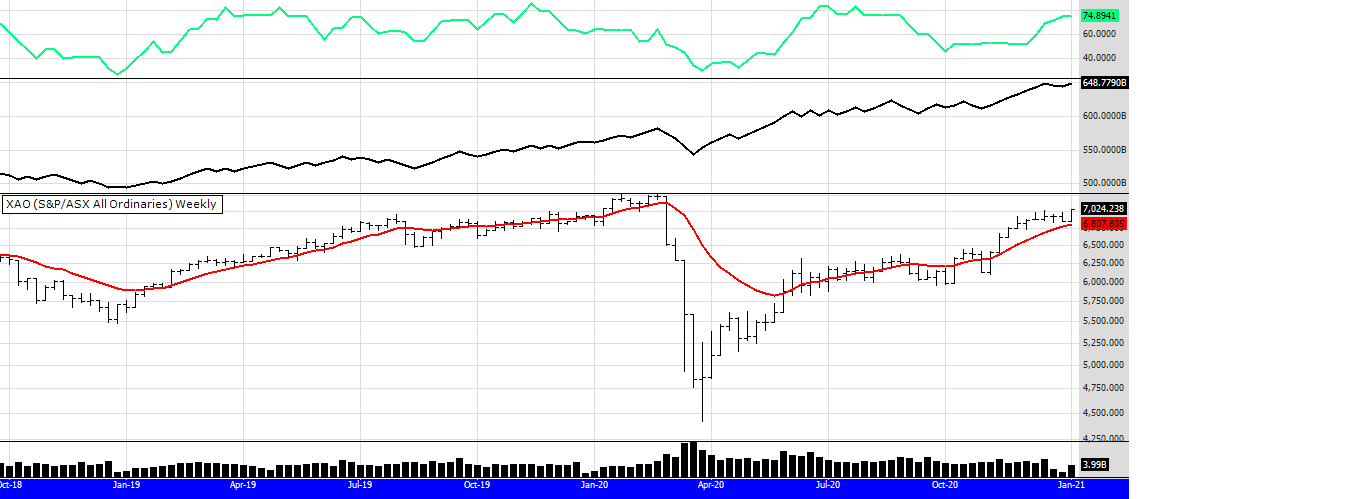
Apologies I missed the updates last week. I was away on holidays with the family. We got the fireworks in gold stocks although a pull back is happening. Maybe all the money is going into cryptos.
The index above looks strong again with a reasonable volume bar this week. Volume indicators look a little weak but Xmas is a low volume period so it is hard to judge what importance that volume may be.
Despite all the drama in the US the Nasdaq powers on, its at 13,000 now and Bitcoin is 40,000. Etherum is 1,200. Crikey.
Where will it end? Dr. Van Tharp is saying Bitcoin may triple again this year to over 100,000. Etherum has tripled in a few months. It was around 350 in October 2020.
Until next week, hang on to your hats the ride is not over it seems.
MARKET COMMENTS: As of 24/12/20: See charts below
The chart below has two volume indicators, the On Balance Volume (OBV) and the Money Flow index(MFI) using a 13 week period. The MFI is displayed in green.
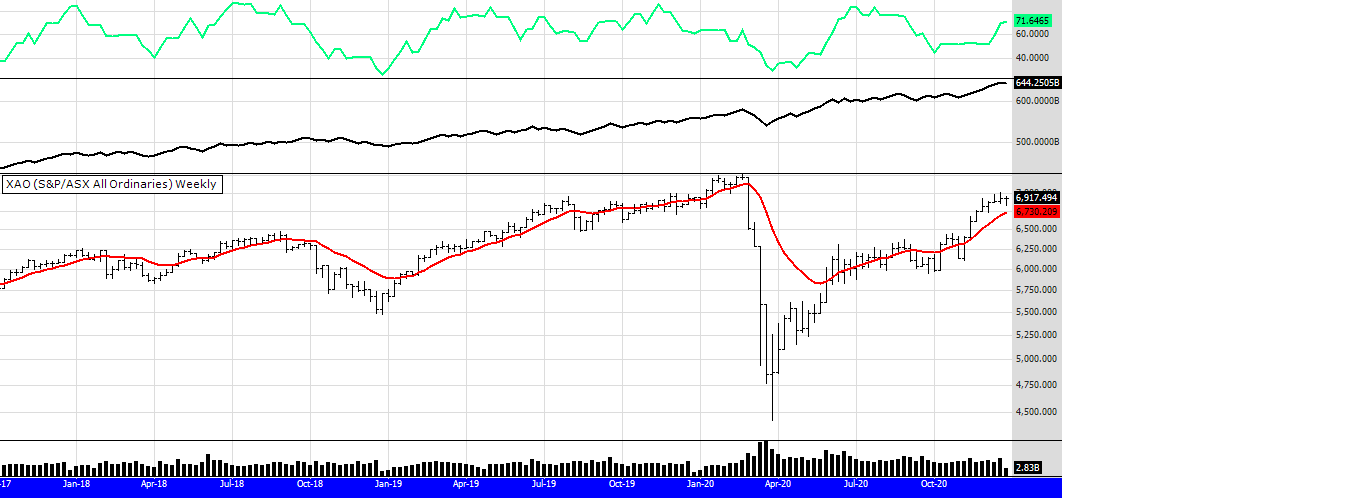
Not much change this week which is to be expected. I notice as I write the gold price is having an upmove. We may get some fireworks
in gold stocks next week.
MARKET COMMENTS: As of 18/12/20: See charts below
The chart below has two volume indicators, the On Balance Volume (OBV) and the Money Flow index(MFI) using a 13 week period. The MFI is displayed in green.

Not a lot of change from last week. The OBV indicator is looking extended isn't it? If it pulls back to the mean one would think prices will come with it. There are times when we wonder if it is riskier to be in the market or not in it! I wrote a newsletter in September about the Nasdaq at 20,000 by 2022. When I wrote that article it was 11,000, now its 12,700. So its rising at about 5% a month, well on target.
The markets do appear to be in a euphoric rally, like depressive falls we had 8 months ago. It has been said the market is manic depressive or bipolar, I wont argue with that comparison.
MARKET COMMENTS: As of 11/12/20: See charts below
The chart below has two volume indicators, the On Balance Volume (OBV) and the Money Flow index(MFI) using a 13 week period. The MFI is displayed in green.
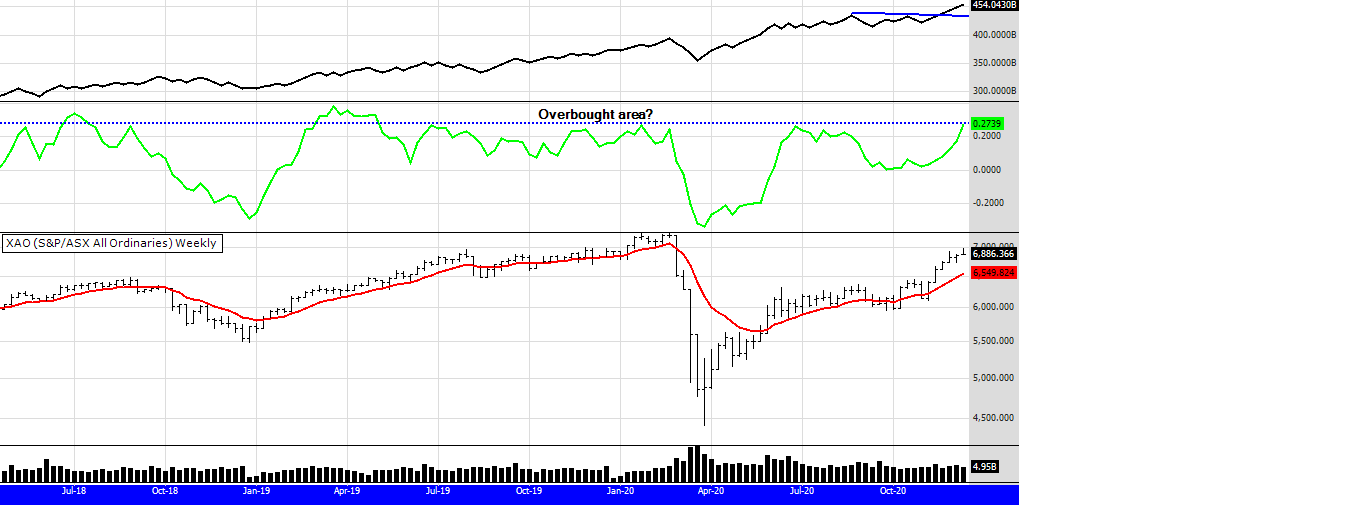
So, things have had a slight change this week. Three weeks ago I made the comment that the Money Flow Index was not yet in overbought territory, but it appears to be now. The slower moving OBV still looks very strong, but we did have a sell off on Friday and some stocks are weakening. Think in reverse for me. In April the world was going to end and everyone was selling, now confidence has returned and people are buying. It was a good time to buy back then, perhaps not now.
Markets look forward, and what they were looking at back in April was stimulus, technology, health and the positives of Covid for many companies.
Looking forward now I hear musings of stimulus uncertainty, high Covid numbers, bankruptcies, less income and more unemployment. Also the market has had a huge rally so it is understandable that it is slowing and being more cautious.
We have had a shift of money from tech and health into cyclical stocks, whats next? Maybe commodities. Christmas is often a strong time for gold and gold stocks. If you are trading those don't go to sleep over the break, there could be fireworks.
MARKET COMMENTS: As of 4/12/20: See charts below
The chart below has two volume indicators, the On Balance Volume (OBV) and the Money Flow index(MFI) using a 13 week period. The MFI is displayed in green.

The uptrend continues. There is a lot of confidence in the Australian economy at the moment, particularly resources. Looking at the stocks breaking out into 52 week closing highs you will see that the cyclical companies are dominating.
Also, speaking all things Australian, compared to what is happening OS with the pandemic and economies, one should feel extremely grateful we live in the Great Southern Land. Health is wealth, and we have it.
MARKET COMMENTS: As of 27/11/20: See charts below
The chart below has two volume indicators, the On Balance Volume (OBV) and the Money Flow index(MFI) using a 13 week period. The MFI is displayed in green.

More price gains, more volume, the rally continues. The XAO is not that far away from its highs in Feb 20, the way this market is going it may well take out those highs by Feb 2021. That will be an incredible recovery, but in line with the average bereavement time of a human after a significant loss. This was the theory of Edwin Coppock, the inventor of the Coppock indicator that uses a 12 to 14 month time frame to signify major uptrends and psychological turning points. If you want to read more about that click on the link below.
https://en.wikipedia.org/wiki/Coppock_curve
MARKET COMMENTS: As of 20/11/20: See charts below
The chart below has two volume indicators, the On Balance Volume (OBV) and the Money Flow index(MFI) using a 13 week period. The MFI is displayed in green.

Strength continues. Its good to see the index recovering so well. Australia has a great economy in my opinion, despite the knockers that say we only build homes and dig holes. Personally I would argue and ask, what's wrong with providing people with the most basic of needs? A home and somewhere to live.
So, my little rant over, you can see the chart above with the OBV breaking into new highs and the the 13 period MFI rising. It is also a long way from overbought territory, indicated by the blue dotted line. This rally could continue for a while. I notice that Shane Oliver from AMP shares my views with an opinon that the Aussie market may outperform the US next year. If banks and resources continue their recovery watch this index fly.
What a pity people couldnt see that 8 months ago when the "world was ending!" . Oh we have short memories.
MARKET COMMENTS: As of 13/11/20: See charts below
The chart below has two volume indicators, the On Balance Volume (OBV) and the Money Flow index(MFI) using a 13 week period. The MFI is displayed in green.
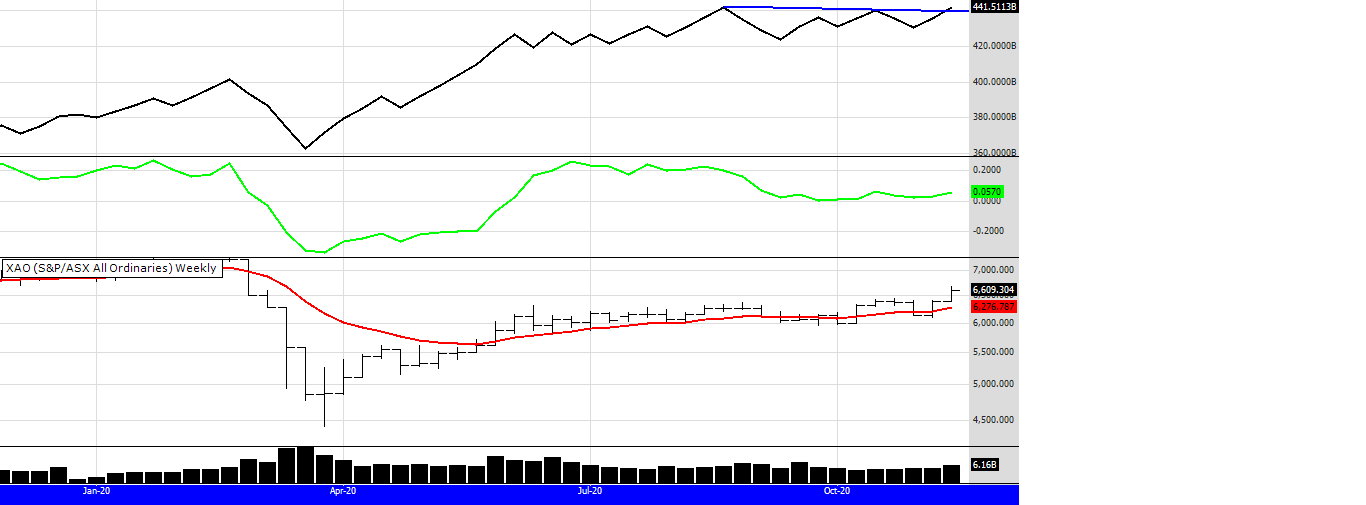
A strong week. My volume indicators last week got it right, with the OBV now confirming the upward move. There seemed to be a lot of rotation last week, with gold and tech stocks coming off the boil (gold stocks have been on the nose for a while) and money flowing back into more cyclical sectors and stocks. The CBA's comments this week about their anticipation of a strong economic recovery didn't hurt the finance sector. It all remains to be seen if this rally can continue with the Covid situation in Europe and America getting worse. I am not taking anything away from our health workers and Government, but it seems we were lucky with the timing of the pandemic. As we got it under control summer arrived, helping our cause, the Northern Hemisphere are burdened now with rising numbers and dropping temperatures, not a good mix.
MARKET COMMENTS: As of 6/11/20: See charts below
The chart below has two volume indicators, the On Balance Volume (OBV) and the Money Flow index(MFI) using a 13 week period. The MFI is displayed in green.

As the saying goes "a week in politics is a long time". We could say the same about the market. The result in the US, although it did seem uncertain for a while, seemed to make market participants bullish. It appears Biden has won, unless Trump can manifest a miracle.
The chart above has been changed slightly from my normal display. The MFI (in green) has been changed to a 6 week time frame. This is an attempt to indicate more recent volume action. As you can see it looks quite positive, rising with the price action and appearing to break above the overhead trendline of around 4 months.
The OBV, as I have often said is a slower indicator, but also reliable. It certainly worked well during the Covid crash, indicating the extreme oversold condition of the market. In this chart it is lagging a little, but it is not falling.
Overall this chart looks ok, it is definitely in a sideways pattern, which can be a dangerous time for many traders. The important thing to remember is to only hold or even trade stocks in solid up trends, reducing the chance of being whipped out in sideways movements. Sideways markets often require wider stops, along with some concentration by you, focusing on stocks with strong fundamentals.
It is a time to be selective in what you buy, it appears a "stock pickers" market has returned.
MARKET COMMENTS: As of 30/10/20: See charts below
The chart below has two volume indicators, the On Balance Volume (OBV) and the Money Flow index(MFI) using a 13 week period. The MFI is displayed in green.

As I said last week, volume was weak and uncertainty reigns, it was always unlikely the market would rally this week.
The index (as opposed to some stocks) has been sideways now for some time. Always bear in mind this index is dominated by the banks and it is difficult for it to look strong if banks are weak. We do seem to have a 2 way economy, some sectors strong, some weak. Anyway, we could discuss what may happen infinitum, but until things in the US have some certainty (and it's all the market really cares about not who wins) the sideways to down action will probably prevail.
MARKET COMMENTS: As of 23/10/20: See charts below
The chart below has two volume indicators, the On Balance Volume (OBV) and the Money Flow index(MFI) using a 13 week period. The MFI is displayed in green.
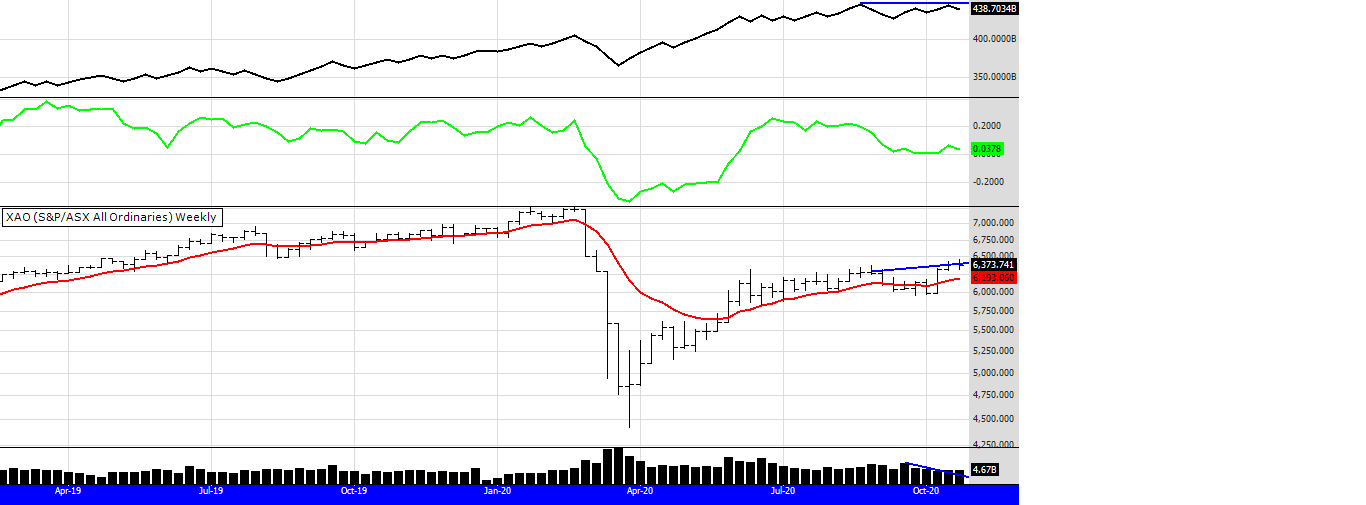
The bull filter is active and has been for 3 weeks now. To me volume still looks a little weak, I think that is understandable as many wait for the US election outcome. Some interesting stats from the Economist magazine are: No incumbent president since 1928 has failed to be re-elected when the stock market is up, which apparently gives Trump an 87% chance of winning. However! No incumbent president has been re-elected in the midst of a recession. So on those stats, it would seem a close call.
Whoever wins I don't think it will make much difference to the market, the policy of stimulus will continue. If you research economic performance on the US economy over the long term, the Democrats have a better record, but somehow the market thinks its the Republicans. With that thinking if Biden wins we may get a short sharp pullback, but really who knows?
Good luck next week.
MARKET COMMENTS: As of 16/10/20: See charts below
The chart below has two volume indicators, the On Balance Volume (OBV) and the Money Flow index(MFI) using a 13 week period. The MFI is displayed in green.

Price is up, volume is back. Nothing more to say really. I will say the move up is a little surprising with the US election around the corner.
MARKET COMMENTS: As of 9/10/20: See charts below
The chart below has two volume indicators, the On Balance Volume (OBV) and the Money Flow index(MFI) using a 13 week period. The MFI is displayed in green.

What an interesting market we have. Price has a strong move this week, the volumes are still a liitle low. Over in the US it had a strong week, it also rallied again last night so one would "expect" our market to follow.
Quite a lot of signals this week, as opposed to hardly any in the last 2 weeks. Scrolling through the charts I notice many stocks are up over 100% from their lows just 6 to 7 months ago.
Next week I may not be able to post the signals. I am away on a retreat where internet service is weak. I will do my best to get them posted.
Also below I have posted the trades the eBook system has done since it re entered the market, and also the equity graph starting with 100K. It is up 25% from when re buying in early June.

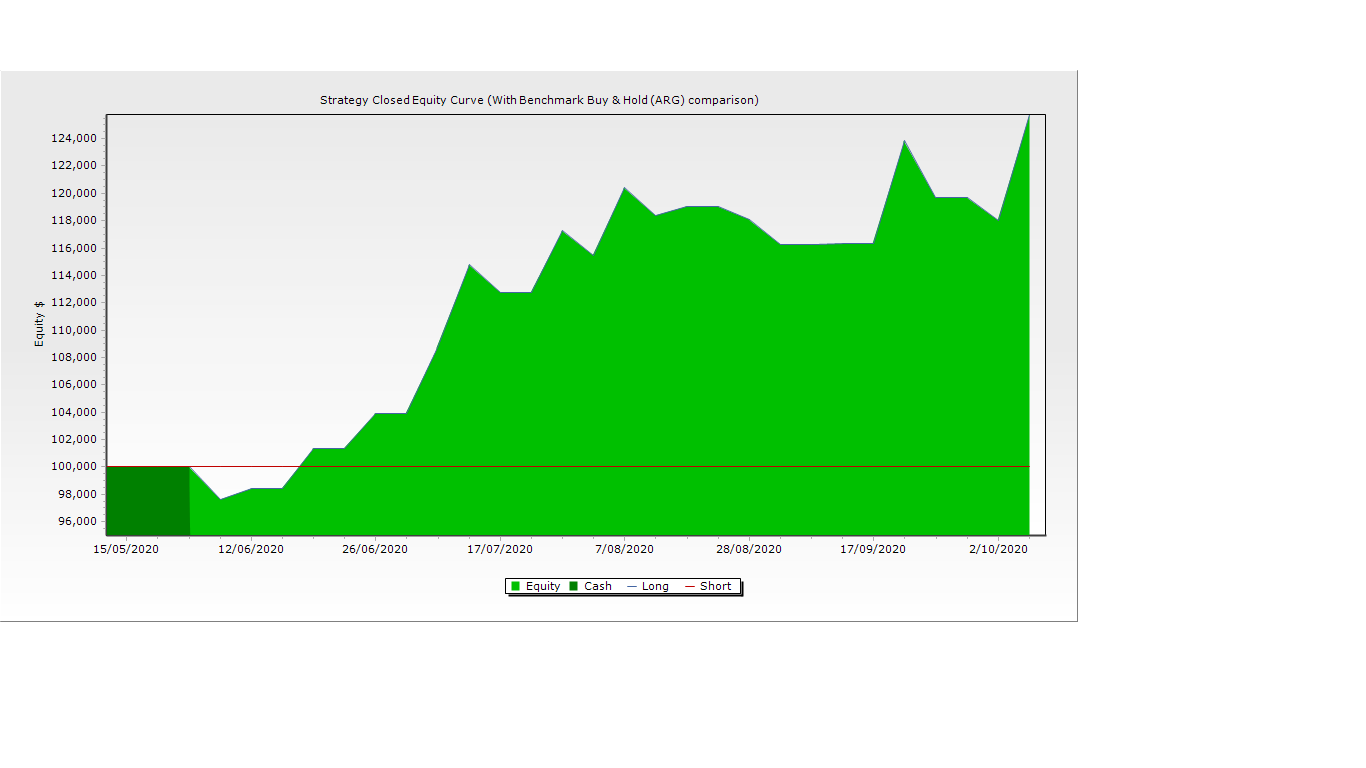
MARKET COMMENTS: As of 2/10/20: See charts below
The chart below has two volume indicators, the On Balance Volume (OBV) and the Money Flow index(MFI) using a 13 week period. The MFI is displayed in green.
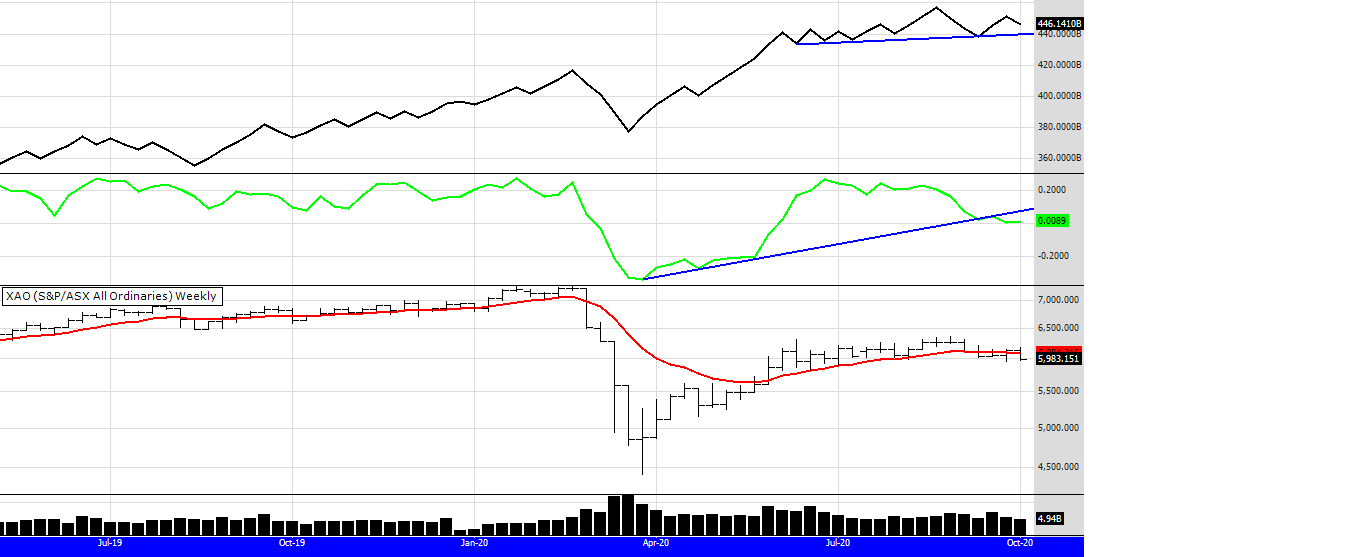
The index continues to languish. I read once the saying "volume makes the choo choo go" and it seems that the fading volume I was talking about over the last few weeks is taking its toll. Over in the old U.S. of A the Nasdaq continues to defy gravity, but as I write (8pm Friday night) the futures are down 2%. Of course anything can happen during the day session.
During my online seminar I did mention the Money Flow Index on the Nasdaq, despite the bounce last week the 13 week period money flow index is pointing down, of course 13 weeks is slow, but if I shorten that to a more dynamic 6 weeks, it is still pointing down. Have you ever noticed how markets often move in 6 week periods? 6 up, a pause or turn, 6 down, a pause or turn. The Covid crash was 6 weeks down before the rally up.
So, the bull filter is negative, there is not one 52 week closing high this week. Caution, uncertainty and fear dominate.
MARKET COMMENTS: As of 25/9/20: See charts below
The chart below has two volume indicators, the On Balance Volume (OBV) and the Money Flow index(MFI) using a 13 week period. The MFI is displayed in green.
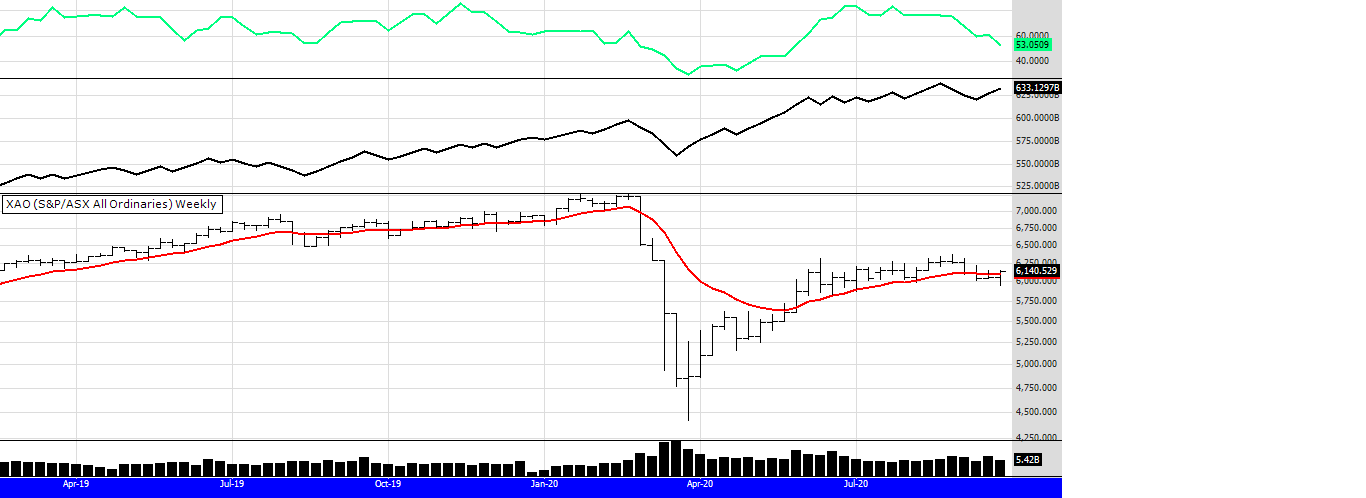
First of all thank you to those that contacted me to see if I was ok, seeing as I did not do a post over the weekend. A pressing family issue kept me away from the screens. Nice to see people care.
Moving on to the markets you can see the bull filter has just sneaked above its EMA. Volumes are still dubious but we all know price is the dominant indicator. Interesting over in the US, the Nasdaq is recovering, is this the dip on the way to 20,000? A topic I discussed at my online seminar with ATAA on Monday 21st Sept.
I do have a copy of the presentation, I will be uploading it to my you tube channel (which I rarely use) soon.
See you next week.
Peter
MARKET COMMENTS: As of 18/9/20: See charts below
The chart below has two volume indicators, the On Balance Volume (OBV) and the Money Flow index(MFI) using a 13 week period. The MFI is displayed in green.
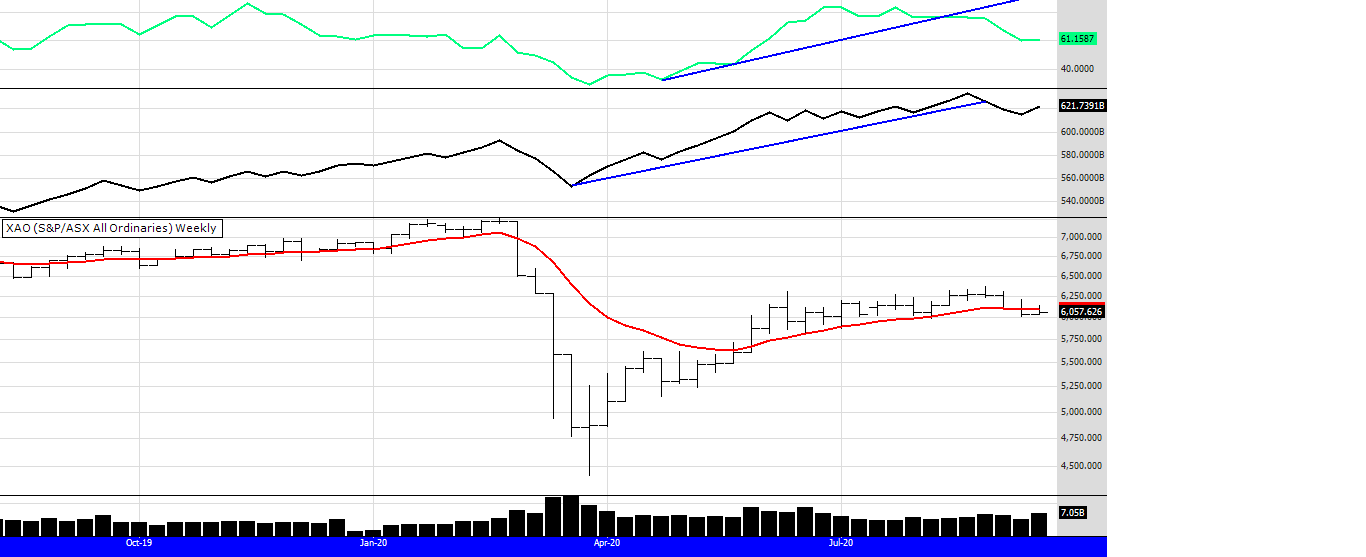
One week does not make a trend but weakness prevails as the index stuggles this week and finishes on the downside. Volume is up, for every seller there is a buyer so its interesting that volume is up. Does it mean the smart money is selling or buying?. The bull filter is negative so the strategy for the above method is stand aside.
This coming Monday night (21st Sept) I am doing a presentation online for the Sydney ATAA. If you are not a member you can get free access if you follow the intructions below.
MARKET COMMENTS: As of 11/9/20: See charts below
The chart below has two volume indicators, the On Balance Volume (OBV) and the Money Flow index(MFI) using a 13 week period. The MFI is displayed in green.

The index is looking sick. Volume indicators are down and so is price. The Nasdaq in the US is approaching short term support so will that slow the down trend? If we are really in the next bull market, the Nasdaq will attract buyers and rally again. I suggest that is the index to watch as the new economy is all about technology, so it seems.
MARKET COMMENTS: As of 4/9/20: See charts below
The chart below has two volume indicators, the On Balance Volume (OBV) and the Money Flow index(MFI) using a 13 week period. The MFI is displayed in green.
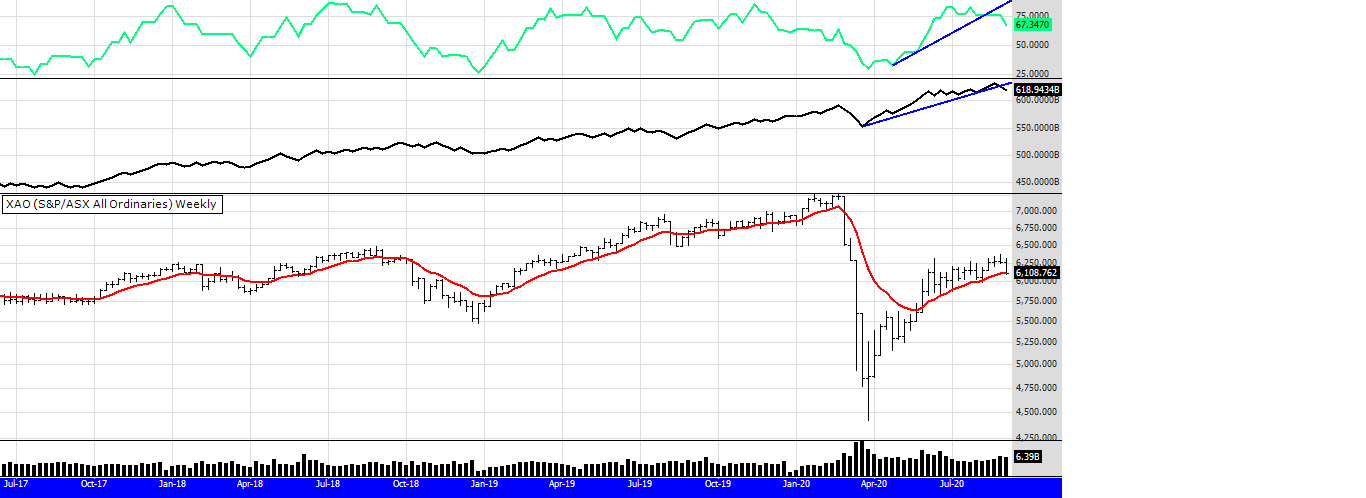
So. Last week I asked the question was the pullback happening soon? as the volume indicators were starting to turn down into possible negative territory. You can see on the chart above the XAO is now below the bull filter, so there will be no more buying if you are using a filter like that. I have been testing alternative and additional exits for the eBook system, as the pullback in March was too much for most people, bearing in mind it was an extraordinary event. I will be discussing those exits at my online ATAA meeting on the 21st Sept.
So where is support? Well in my opinion support is where the US markets decide it is, our market will follow it down, perhaps not as much, as we have not rallied as far as the US market has since the March lows.
MARKET COMMENTS: As of 28/8/20: See charts below
The chart below has two volume indicators, the On Balance Volume (OBV) and the Money Flow index(MFI) using a 13 week period. The MFI line is displayed in green.

A big volume bar this week, and price is down slightly. The OBV hangs in there but the MFI looks to be breaking down a little. Is this the correction many have been waiting for?
MARKET COMMENTS: As of 14/8/20: See charts below
The chart below has two volume indicators, the On Balance Volume (OBV) and the Money Flow index(MFI) using a 13 week period. The MFI line is displayed in green.
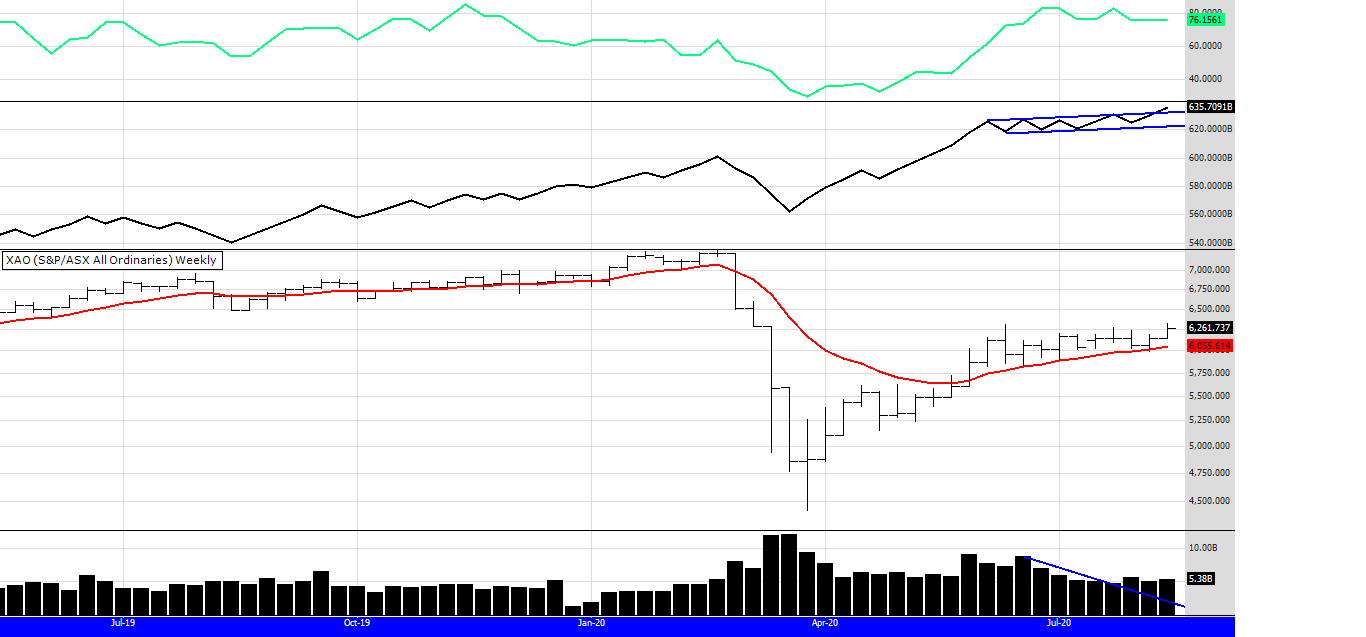
Market strength continues. Last week I mentioned the Russsell 2000 in the US, it had a flat week. Not much to say this week. If you are a trend trader good times are back.
MARKET COMMENTS: As of 7/8/20: See charts below
The chart below has two volume indicators, the On Balance Volume (OBV) and the Money Flow index(MFI) using a 13 week period. The MFI line is displayed in green.

Not much to say this week except the XAO index is hanging in there. This week there are five new 52 week closing highs in the ASX 300, with commodity stocks dominating. Also two more commodity stocks in the 300 - 500 sector. A chart I find interesting is the Russell 2000 in the US. The talk has been the stock rally is a bubble led by the Nasdaq, if that is the case why is the 2000 mid caps in the US so strong? Chart below. Perhaps the rally is more broad based than once thought. The indicators on the chart below are a 14 RSI and a MACD.
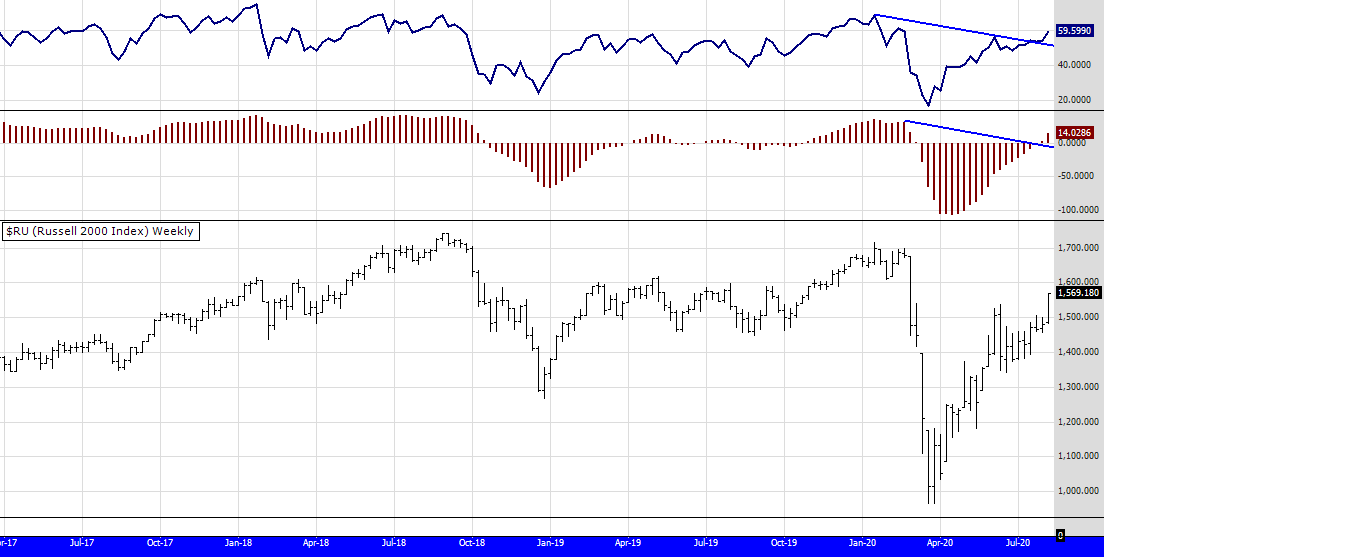
MARKET COMMENTS: As of 31/7/20: See charts below
The chart below has two volume indicators, the On Balance Volume (OBV) and the Money Flow index(MFI) using a 13 week period. The MFI line is displayed in green.

A pullback this week on some higher volume. Is this the pullback many have been predicting? We do not have a break down in volume trend lines yet, like we did before Covid hit. Lookling back at March you can see the OBV trend line broke down and the MFI had already been trending down for some time. This week will be a tester, if it falls below the EMA well then of course the eBook system will stop buying, but a sharp sell off could happen because there seems to be so much nervousness about this market at the moment.
MARKET COMMENTS: As of 24/7/20: See charts below
The chart below has two volume indicators, the On Balance Volume (OBV) and the Money Flow index(MFI) using a 13 week period.

Everytime I look at this chart, I see strength. Prices are rising and so is volume. Perhaps when we get good news about Corona virus, the markets will fall, because all the bad news is not slowing down the uptrend. I ran a scan on the eBook system today. There is a philosophy that the stocks that first give buy signals after a bear market, are the stocks that lead the next bull market. The eBook system signalled buys on the 1/6/20, after its Bull filter kicked in to buy mode. Out of the 19 stocks that were bought 9 were gold stocks, if you include FMG that would make it 10 of the 19. So, it appears by far that the Gold sector is the new bull market, with a few resource stocks tagging along for the ride. Below is a list of the stocks the system is holding in the top 300. The system currently holds 18 stocks so one will be bought on monday, that will be HUB.
The system has had a good month rising 10%, recovering somewhat after being clobbered in March and April.
Note: the entry date below for each trade is the Friday (5th) of the week, the correct date is actually the Monday 1/6/20

MARKET COMMENTS: As of 17/7/20: See charts below
The chart below has two volume indicators, the On Balance Volume (OBV) and the Money Flow index(MFI) using a 13 week period.

It is an interesting market this one. One of the themes in the book I am writing is to look at the market with a mind of interest, not fear. If you can do that it can do wonders for your trading by just adjusting your perspective.
This week there was uncertainty, the US market has stalled a little and some of our Tech stocks came off the boil. A rotation appears to be happening. I notice this week a return to dividend paying stocks, Resources, Staples and even Utilities, although not in an uptrend, seem to be getting some love. Perhaps for the dividends. I see this as more conservative investors returning to the market, now feeling more safe as the dust settles. Also the question, where else do you put your money?
I have been talking about a repeat of the late 1990's rally. Below is a video from an American commentator suggesting just that. Its 8 min long. Have a good week.
https://www.youtube.com/watch?v=Jj_-yTpvQDc
MARKET COMMENTS: As of 10/7/20: See charts below
The chart below has two volume indicators, the On Balance Volume (OBV) and the Money Flow index(MFI) using a 13 week period.
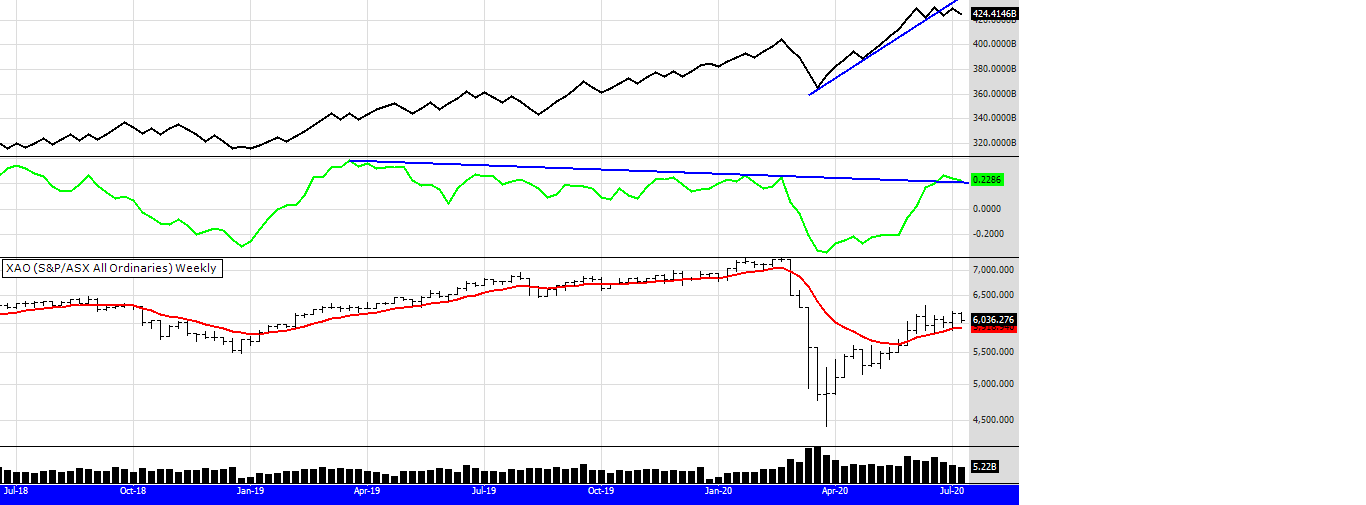
The look of this chart has hardly changed from last week. A flat week here in Aus but overnight the US rallied again and so gains will be expected here on Monday. Below is a chart of the Nasdaq in the US.
Last week I discussed the rally in 1998 to 2000, it looks to be happening again. Before covid I was of the opinion the markets were going to "melt up", in hindsight it seems I was correct, with the crash in March being the buy opportunity of a lifetime. In 1998 the Nasdaq broke through 2000 to make 5000 in 18 months. A repeat of that will take us from 10,000 to 25,000 by mid 2021. So, the decison we all have is how to play this market. A momentum system with tight stops may be the one to use, but whatever one uses it could be a bumpy ride.

MARKET COMMENTS: As of 3/7/20: See charts below
The chart below has two volume indicators, the On Balance Volume (OBV) and the Money Flow index(MFI) using a 13 week period.

The index rose again, strength remains in Tech, Health, Gold and Consumer stocks like COL and WES. We live in interesting times as the market defies what most economists think, that the economy will struggle post Covid. This index is telling us the opposite. The Nasdaq in the US is even more defiant, I can't but help liken what is happening now to 1998, when the Nadaq fell 30% to rise another 300% before crashing in 2000.
MARKET COMMENTS: As of 26/6/20: See charts below
The chart below has two volume indicators, the On Balance Volume (OBV) and the Money Flow index(MFI) using a 13 week period.

Things have changed a little. On the weekly chart the index went sideways to slightly down this week. The OBV trend line has broken its trend line to the downside, although it has not made a new lower low. The 13 weekly period of the Money Flow Indicator is at very high levels, this is not to suggest the market will fall, but buyers may be a little tired at the moment. Without buyers the market will drift sideways to down. Below is a daily chart...

In the daily chart above I have drawn some more trend lines, and changed the MFI to a 5 period, to reflect a weeks price/volume action. Trend lines are holding on the price and the OBV, but MFI looks to be under pressure. The MFI is a more dynamic indicator and will reflect short term movements more, as with all short term indicators they can lead us off path. We know the US market fell on Friday so no doubt we will open down on Monday, if that daily OBV trend line breaks down, I would expect short term traders will run for the exit. I would think more cautious traders will exit on Monday.
MARKET COMMENTS: As of 19/6/20: See charts below
The chart below has two volume indicators, the On Balance Volume (OBV) and the Money Flow index(MFI) using a 13 week period.

There seems no stopping for the XAO index at the moment. A big volume bar this week as money continues to come into the market and the price rises. Indicating that buyers are overwhelming sellers. Despite the doom and gloom and the constant talk of the economy in dire straits, the index is defiant. Volume indicators (the OBV and MFI) are still pointing up.
The Australian stock market is shifting. It has been for some years as the banks dominate the index less. Other sectors are emerging to take up more of the index weighting. While the financial stocks languish, sectors like consumer, health, tech, and gold are very strong, helping to push this index up. Traditional sectors like banks, utilities and energy continue to languish. To me I am undecided as to how the resources sector is looking, some companies are going well but others not.
So, are we in the throes of the new economy? An economy now driven more by the needs of the domestic consumer. I notice the property sector is strong too, below is a chart I used at a recent talk I gave about the Real Estate Investment Trust market. I used this chart to discuss the theory of the 14 years property cycle that some adhere to.
No drop off of money here, in fact quite the opposite, its pouring in. If I were the Federal Government I would be doing the same, support this sector. It's the 2nd biggest income earner in the country and creates the "wealth effect" encouraging people to invest and spend. The strategy seems to be working.
Until next week.

MARKET COMMENTS: As of 12/6//20: See charts below
The chart below has two volume indicators, the On Balance Volume (OBV) and the Money Flow index(MFI) using a 13 week period.
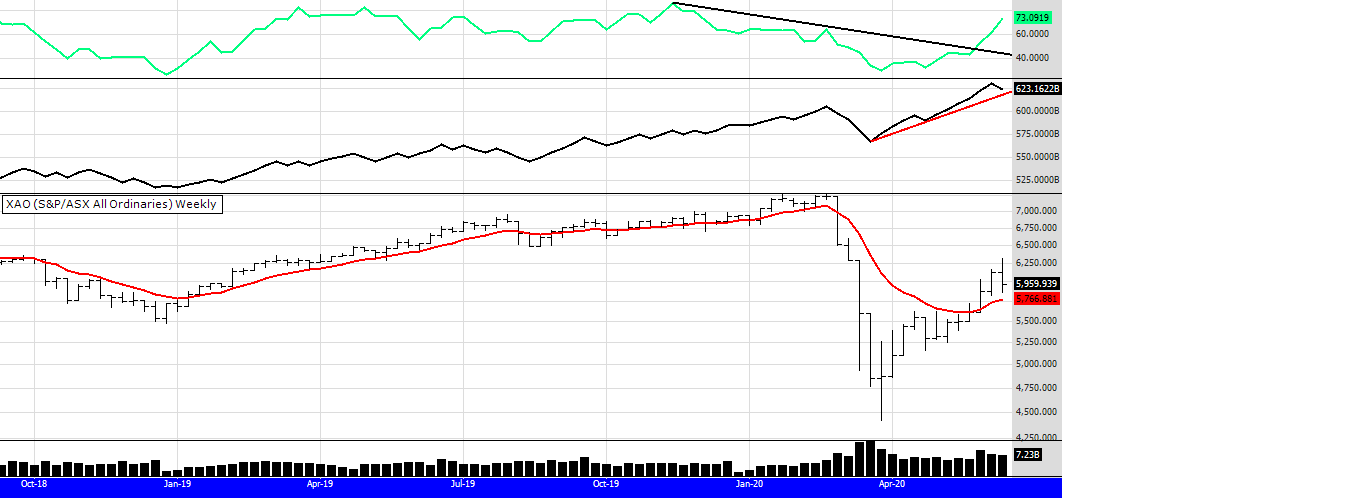
A pullback in the US had the same impact on the XAO. Volumes remain intact, the volume on this weeks trading bar was lower than the previous two bars. The OBV trend line is still in place and the Money Flow Indicator still pointing up, but it is a 13 week calculation. If I look at it on a 6 week calc (not shown) it looks over bought. The markets are responding to the number of Covid cases, I suppose it will take some time to know how deep the impact on the global economy will be. I would think markets will then react to different stats and the true impact of what has been happening the last 3 months will become apparent.
There are very few 52 week closing highs this week. None in the 300, just one in the 300 to 500, and none for the eBook system. Not surprising considering the pull back in the XAO. I counted up the stocks open in the eBook system, out of the 19 there are 8 gold stocks. Will gold lead the next bull market? If not then the sector seems to be the strongest at the moment.
The eBook system entered the market on the 1st June and is down 2.5% because gold stocks have stalled, however that can change very quickly as it is a dynamic sector.
MARKET COMMENTS: As of 5/6//20: See charts below
The chart below has two volume indicators, the On Balance Volume (OBV) and the Money Flow index(MFI) using a 13 week period.
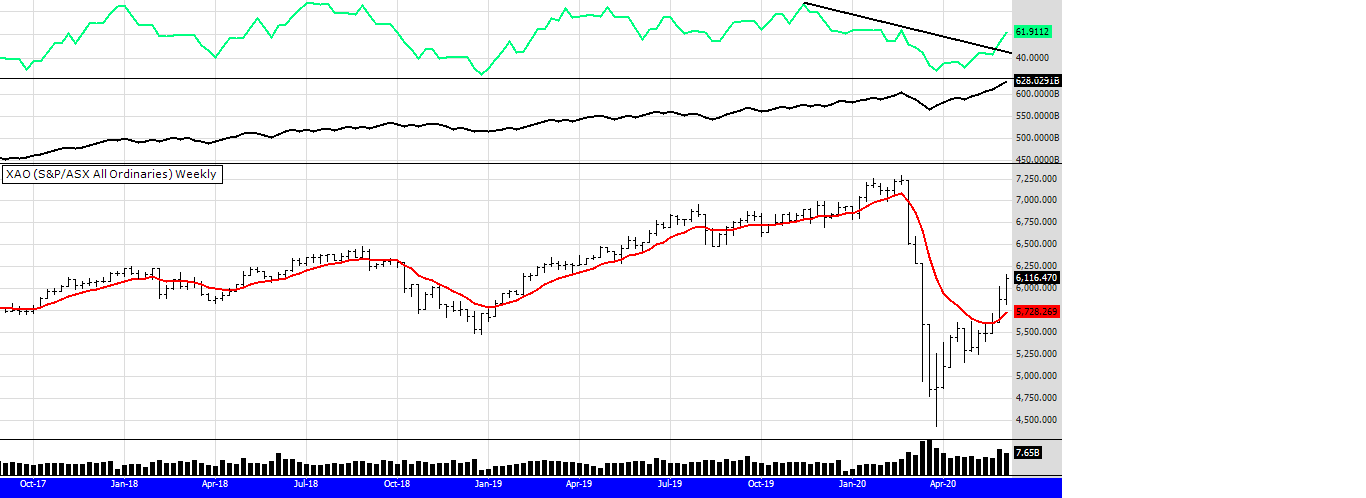
The rally continues, and looks set to continue next week after better than expected employment figures announced in the US last night. Are we living in a fools paradise? Is this just a bear market rally? Is it a new bull market? Have we entered a new paradigm of finance and economics? Perhaps, as I read an interesting statistic that Nike lost money from closed stores in the US but more than made up for that with increased online sales in China. Last night the Nasdaq made all time highs, surpassing the highs before Covid. The V shape recovery in that index confirmed. The US dollar is falling therefore increasing commodity prices, good for Australia but gold has fallen as the "risk on" mentality returns. And perhaps the most interesting, the Russell 2000 in the US, their mid cap index, is rallying hard to, indicating there is breadth to this rally. There has been a concern that the rally in the US was all about the FANG stocks, but the Russell is showing that is not the case anymore and that confidence is returning to other stocks other than FANG.
MARKET COMMENTS: As of 29/5/20: See charts below
The chart below has two volume indicators, the On Balance Volume (OBV) and the Money Flow index(MFI) using a 13 week period.

What a difference a week makes. The banks joined the recovery rally this week driving the XAO index up. The OBV is at all time highs (what a strong and reliable indicator that seems to be) and the 13 week period Money Flow index has well and truly broken its down trend line from last weeks chart. The big news this week is the Bull filter that the eBook system uses is in buy mode, you will see below the signals that system has given. Last week I said I had a feel the market was due for a pull back, goes to show how dangerous it can be to make an assumption or prediction.
I did say last week it depends on the inflow of capital into the market, more buyers, more upward momentum. That happened this week.
MARKET COMMENTS: As of 22/5/20: See charts below
The chart below has two volume indicators, the On Balance Volume (OBV) and the Money Flow index(MFI) using a 13 week period.

This is interesting, the OBV indicator has made an all time high but the faster moving 13 week Money Flow Indicator has not, it is pointing down. Also the bull filter is still not active so the eBook system won't be giving buy signals yet. I am still out of the market with any trading system, while I enjoy the break and get to work on some long overdue tasks. Next week will be one to watch to see if the market can continue the rally or pull back.
At some point buyers will stop buying and there will be great temptation by those that bought a few weeks ago to sell and take profits, the market needs money going in to go up, and will go down if money comes out. I would like to see more consolidation and volume confirmation, so in a way I am glad the bull filter has not signaled because my intuition is telling me this market will pullback soon. We are in the seasonal time of the market when it does fall. "Sell in May and go away" does have some historical merit to it. The market seems to fall from May to September/October, followed by a rally into Christmas. If you want to read an interesting article about it click on the link below.
https://www.investopedia.com/terms/s/sell-in-may-and-go-away.asp
Of course this time may be different because of all the stimulus and the fact we have had a big fall for 2020. However we need money going in, and I am wondering for the time being if investors and traders have empty tanks and possibly empty hearts to take any more risk.
MARKET COMMENTS: As of 15/5/20: See charts below
The chart below has two volume indicators, the On Balance Volume (OBV) and the Money Flow index(MFI) using a 13 week period.

I am again displaying the daily chart of the All Ords, so the MFI is using a 13 period daily. Is it a sideways move or a slow uptrend? The volume on the Money Flow Index broke up early this week, a positive sign, only to pull back again. I have noticed that on Fridays the market sells off, my guess is traders do not want to hold over the weekend. Some sectors are flying, like gold, and resources and materials are going up too. The tech index has had a big rally also. The financial index is not enjoying the rally, and would be really holding back the look of the All Ords and the ASX 200 as these indicies are weighted heavily to banks. Another sector performing well is the Mid Caps. So as always, the chart above does not really show what is happening within the market, it remains a broad indicator. For example, looking at the weekly chart below of the Gold sector index, the bull filter kicked in 4 weeks ago and I notice the OBV has made an all time high. Something to work on and consider for future strategies.

MARKET COMMENTS: As of 8/5/20: See charts below
The chart below has two volume indicators, the On Balance Volume (OBV) and the Money Flow index(MFI) using a 13 week period.

This week I will discuss the daily chart. As it is the short term that most seem to be wondering "what is happening?" The weekly chart has not changed a lot from last week, yes we had a rally of 160 points, or 3%, but this index is in a sideways move for the moment, will it break up to more highs? We need buyers to push the market higher, more money in means higher prices. It seems the indicator to watch is the 13 period Money Flow Index. What period to use is always the big question with any indicator. Using the 13 period you can see the index started to turn up before the recovery rally started in mid March. If it breaks out of its consolidation lines I have drawn on the chart above, it could be a bullish sign.
We need to always keep in mind the longer term charts. On a weekly scale, filters to signal a return of the Bull have not signalled. I am still sitting out of the market. As frustrating as that can be, particularly with the way some stocks have recovered, for me it is my strategy.
On a personal note,I am feeling vindicated about my analysis that the Covid sell off was completely over done, (but things could reverse quickly). However, "being right" about the market does not always make you money. One needs to remain patient and disciplined.
Have a good week.
Peter
MARKET COMMENTS: As of 1/5/20: See charts below

I will start this weeks comments with a weekly chart. As you can see the moving average used for the eBook system is trending down, so there are no buy signals if you are using some sort of weekly market filter, such as that method does.
The index fell this week, all on Friday, the Money Flow index is trending down. As I said last week I would like to have seen more volume coming into the index, but it was not there. The OBV indicator is holding up well, but it is a slower indicator.
As I write I notice the US indexes are down, so one would expect more falls on Monday in the XAO. If the market makes a double bottom and the OBV holds that trend line it could be a good buy opportunity, but we will have to wait and see. If the Money Flow index is still pointing down I would not be buying. Of course I am talking about those that wish to attempt to time a bottom, which is extremely difficult. The safe thing to do is wait for the market to show strength before buying back in. As I often say, one weeks price action does not make a trend, but that is a very bearish looking weekly bar we had this week.
The following chart is in a monthly scale, the Money Flow index had been adjusted to a 3 month period.

On a monthly scale the XAO index looks surprisingly healthy. However we have to remember that the shorter term charts "turn" first and will give us a quicker signal to what is possibly ahead of us.
The OBV indicator is still intact. The MFI does lag a little on a monthly scale, but you you can see how oversold it was in mid March. You can also see it can go lower as it did in 2008 and again 2010 before it started trending higher to indicate the recovery was underway.
Putting all that technical jargon to one side, consider this. The market will go up with buyers and down with sellers. It is why the volume indicators can tell us what the mood of the market participants are. I see the longer term and reliable OBV as the poker "tell" in this scenario. I will be watching it closely over the next few weeks.
Below are the 52 week closing highs for this week, signaled without using a market filter. As expected a gold stock made the list, if the trend of the gold index continues up one would expect more in the coming weeks. This happened in 2008 when the gold sector was one of the few sectors producing new highs as the majority of the market fell.
Have a great week, Peter.
MARKET COMMENTS: As of 24/4/20: See charts below
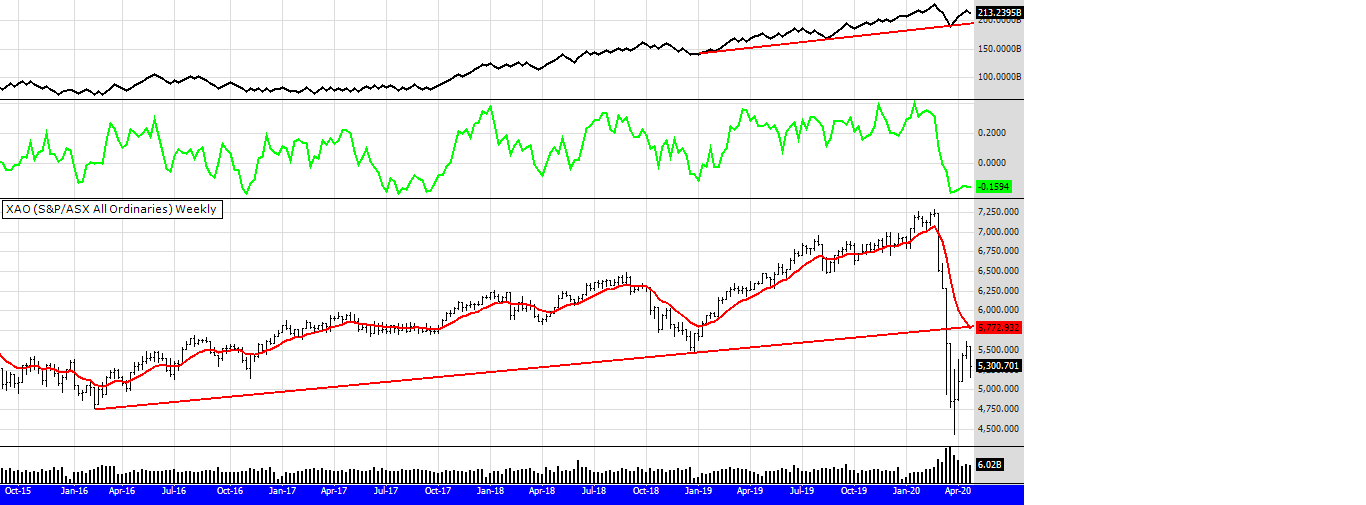
The market pulled back this week, in one week the volume indicators wont change much. You can see above they are similar to the week before. Below is a daily chart.
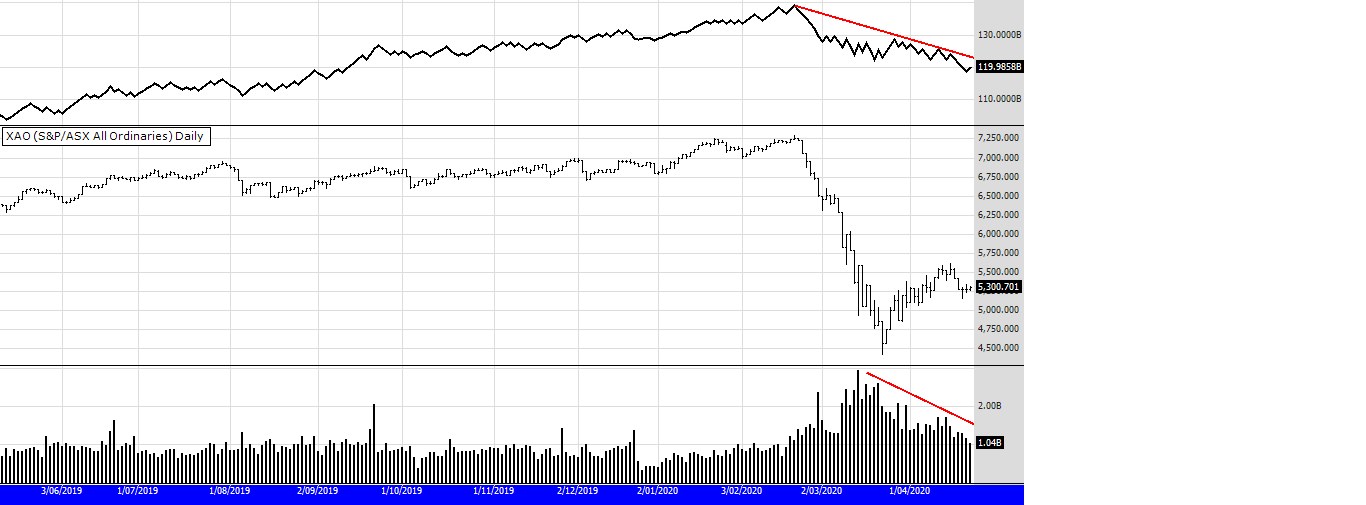
I would like to see more volume coming into this rally. The daily chart above does not reflect the strong day Wall Street had last night, so you would expect our market to rise on Monday. Looking at the daily chart it appears this market has a bit of work to do before we can start talking about a V shape recovery.
Now, if we want to look at a bullish chart check out the one below. Soon I expect to see 52 week highs in gold stocks.
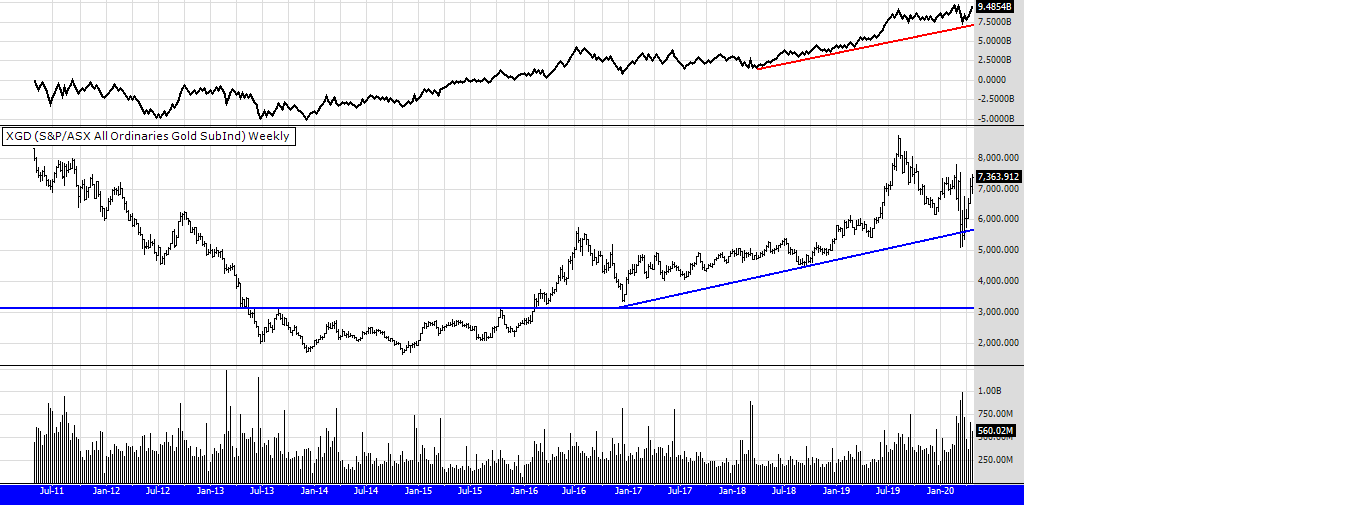
MARKET COMMENTS: As of 17/4/20: See charts below
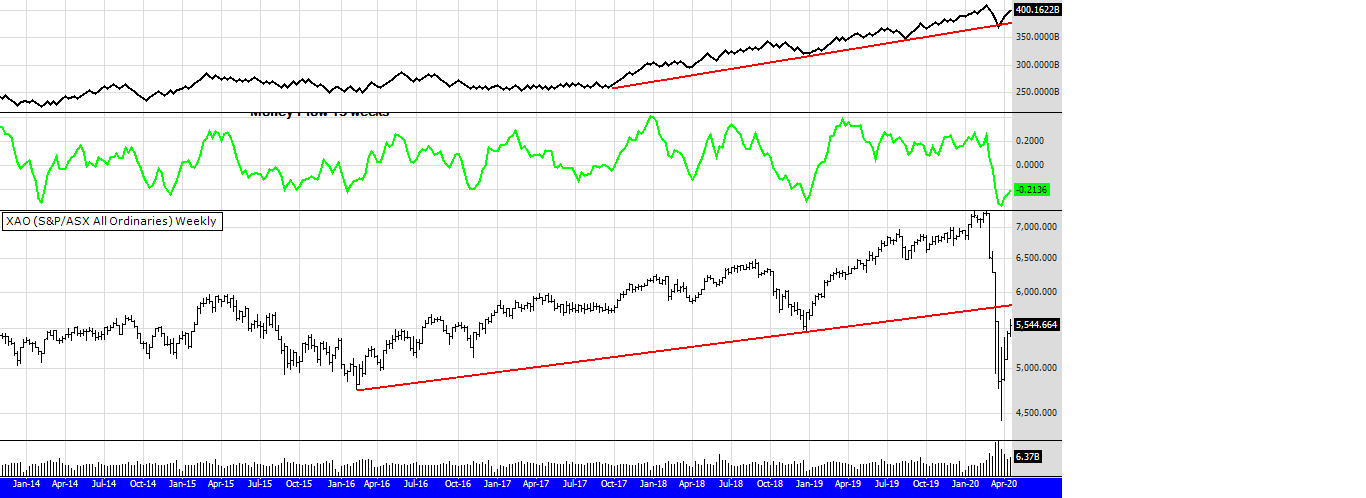
The chart above of the All Ords shows a bar chart with two volume indicators, the On Balance Volume and the Money Flow Index using a 13 week period. I use the 13 week period as it is one calendar quarter. The long term trend line on the OBV remains in tact. Last week I said would like to see more volume and this week we got it. Are we in for a V shaped recovery? I read some research the other day stating that only 17% of market commentators felt the market would recover quickly. Does that mean the opposite will happen and in a few months we will be back to normal? The market has a habit of surprising most.
A test will be when the price of the index reaches that trend line I drew on the chart. A pause would be expected and it will be watched closely to see if it can break through to the upside. 52 week highs below, a few more this week. The Bull filter for the eBook system is still negative.
Peter.
MARKET COMMENTS: As of 9/4/20: See charts below
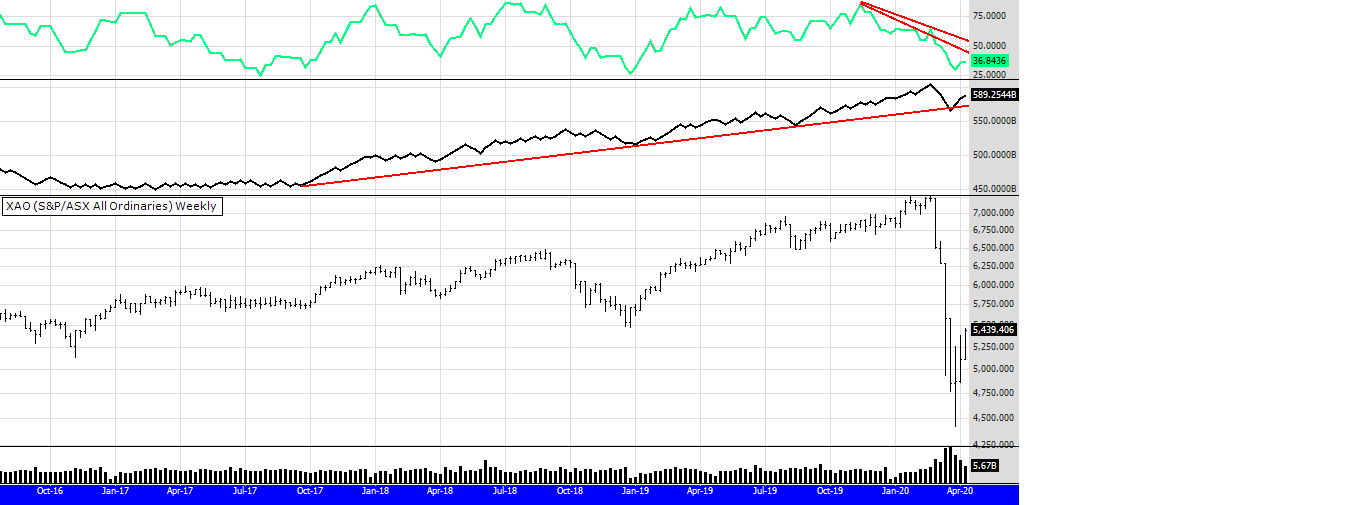
The chart above of the All Ords shows a bar chart with two volume indicators, the On Balance Volume and the Money Flow Index using a 13 week period. I use the 13 week period as it is one calendar quarter. The long term trend line on the OBV remains in tact. I would like to see more volume in the Money Flow Index. Ideally a trend line break to the upside. I have lots of longer term charts posted below, as a matter of interest you might like to scroll down and re read my comments from the 6th March, feel free to email me with your thoughts. Peter.
I cant help myself, here is one more chart for you to digest. A quarterly chart showing a long term uptrend and the OBV indicator on top displaying definitive support.

MARKET COMMENTS: As of 3/4/20: See charts below
This chart below shows two volume indicators, the On Balance Volume and the Money Flow Index (displayed in green) using a 13 week format for weekly charts and a 3 period for monthly charts.
Older charts are repeated lower down the page along with comments from previous weeks. The 52 week highs are also posted below.

I have kept it simple again this week, using a line chart on the XAO, in a weekly format.
As you can clearly see, price and volume are on support lines. We have had a small bounce.
I am not a fan of Fibonacci however I do notice the rally has stalled at the 38% mark, Fib fans will know the possible significance of this.
This market looks oversold and ripe for opportunity, but the news is Trumping (joke intended) the technicals. What concerns me more is the daily chart below.

The OBV line has broken down on a daily chart. Also the 13 period (daily) Money Flow Indicator is meeting overhead resistance.
Its all about the money folks, no money going in, no upward momentum. Buyers need to overpower sellers.
Add to that the bad news coming from the US about Corona and one would expect (dangerous word that one for a trader) more falls.
Remember something important (in my opinion). Charts reflect the emotions of market participants. The chart above indicates to me that traders are being very cautious.
I am.
Just to confuse things (sorry , we live in confusing times) when I zoom in on the On Balance Volume, its doesnt look so bad. You can see why it is so hard to analyse short term charts and why many traders sit out during these times.
Whatever you decide to do this week, I hope you come up trumps!
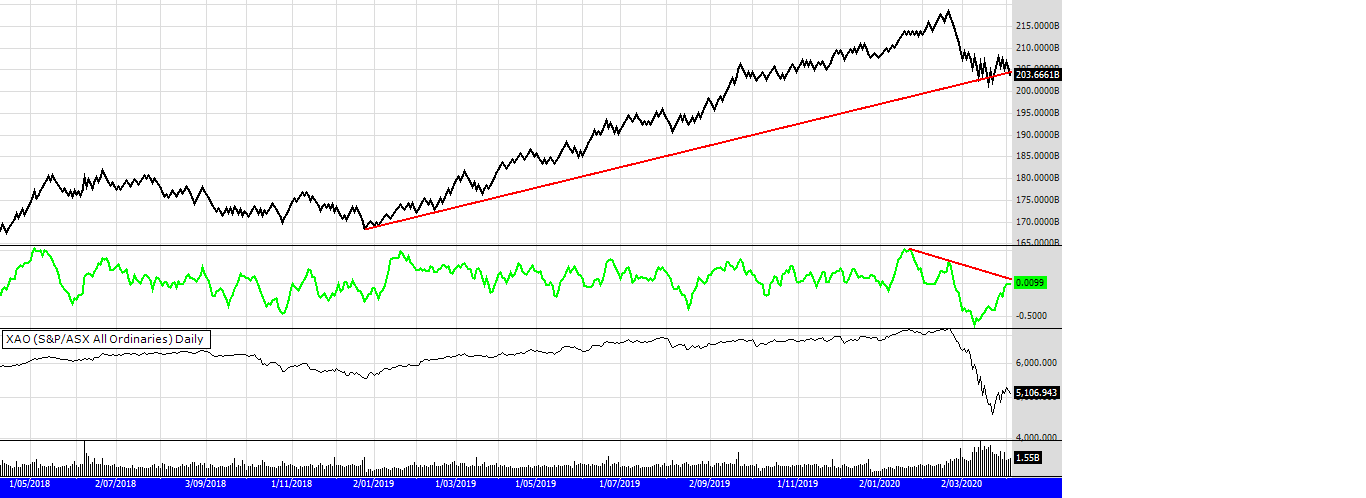

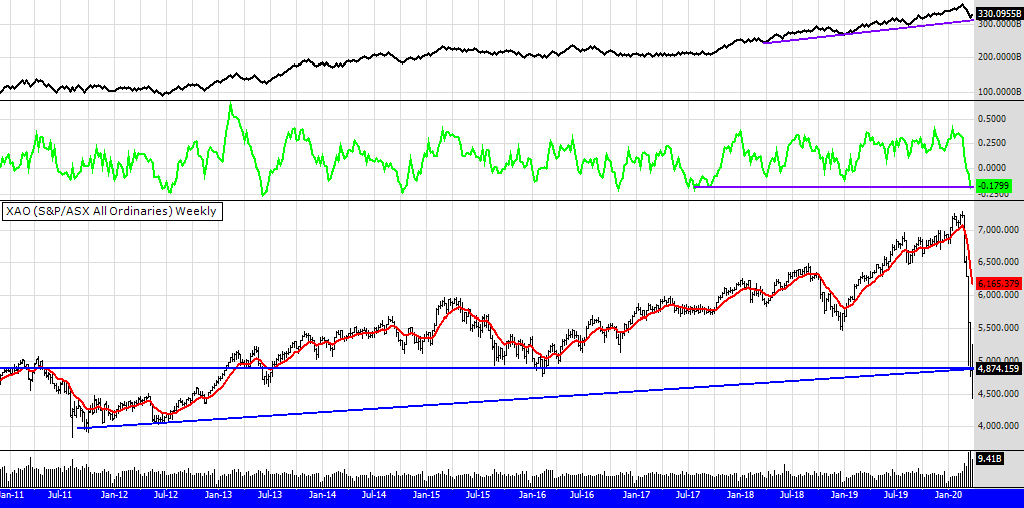
I like to keep charts as simple as possible so sometimes I find line charts the easiest to help determine the big picture, so I have used one for the monthly chart of the XAO 500. Although not shown on the monthly line chart above, we did get a bounce, which you can see on the weekly bar chart. I have always maintained that the bull market started in early 2013, not in 2009 as so many claim it did. Interesting to note that the price of the index has fallen all the way back to the levels we had in 2013, wiping out the bull market gains from that date. Perhaps too wiping out the economic "fluff", weak companies and over borrowing, something that many economists have been saying needed to happen to reset the economy on a more sound footing.
From a technical perspective the charts look to be at a very strong support area. The monthly chart shows a massive divergence between price and volume, as it did in 2003. I have drawn red lines on the Monthly chart to show this.
The weekly chart shows the On Balance Volume indicator still in a solid uptrend. It also shows the Money Flow Indicator (using a calendar quarter period of 13 weeks) at rock bottom levels. When and if the OBV trend line breaks down, then I would anticipate more selling and another wave down to perhaps 4000, but one would think it would consolidate at the long term tend line of 4500. My experience is that upward trend lines give far more support than do horizontal "support and resistance" areas.
As I said last week in my news letter, the above is all technical "stuff". The fundamentals of the economy now rely on how it copes with the shutdown and we can only wait and see.
All the best till next week.
MARKET COMMENTS: As of 23/3/20: See charts below
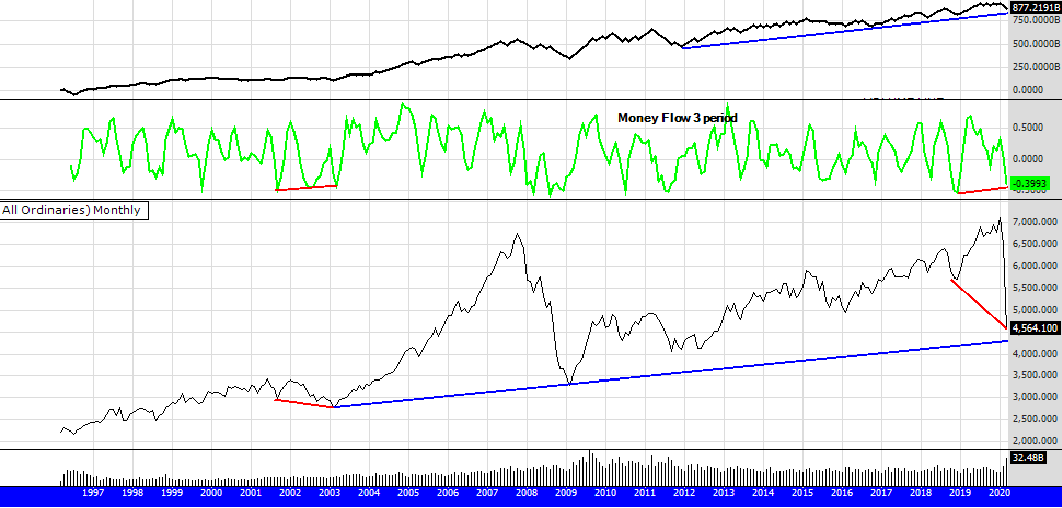
How low will it go?
This is the big question. Normally we can have an idea by looking at the charts to determine where the probability of either support, or even a reversal may happen. However as many have already alluded to the fact "this time it's different."
I am writing this on monday 23rd March after the days trading.
The market has closed down again, and the reversal of price and MFI just gets more pronounced. Normally I would be screaming buy, but I think this time fundamentals are overtaking any support from the technicals. I almost can't believe the OBV indicator is trending up, either the indicator is broken or we are in for one hell of a bounce.
MARKET COMMENTS: As of 13/3/20: See charts below
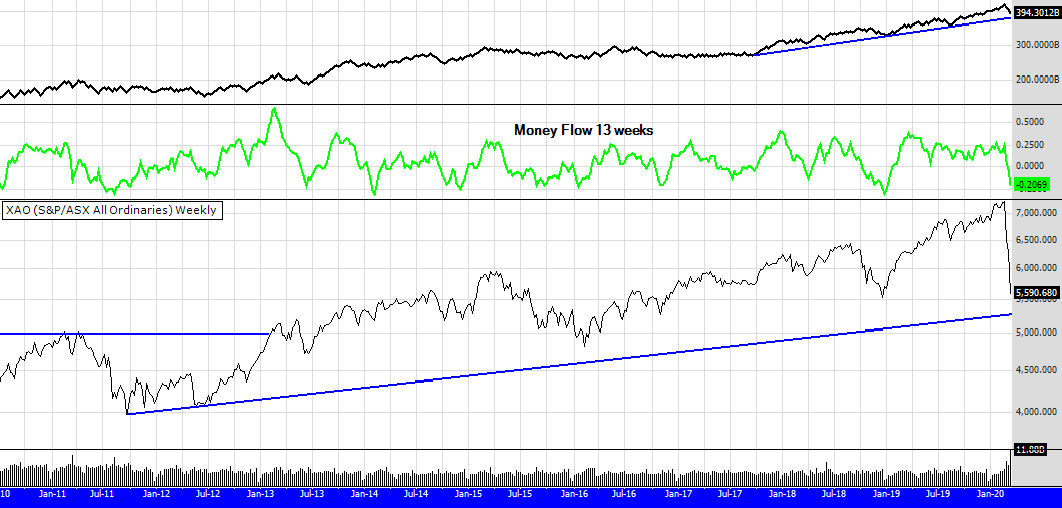
Well I suppose the big question is."Are we now in a bear market?" I suppose many would say yes!
Perhaps I remain too positive, but when I look at the chart above, the answer is, not yet.
Also, where did the bull market start? At the very end of the GFC in 2009, or 2013 after 4 years of ups and downs and accumulation? Have we really had 11 years of a bull market? Or 7 years from the break out in 2013? Normally when bull markets bust the OBV line breaks its down trend. It has not, yet. The other volume indicator on the chart above is the 13 week Money Flow Index, it is certainly in oversold territory. As we are driven by the US markets, let's look at what that chart looks like.
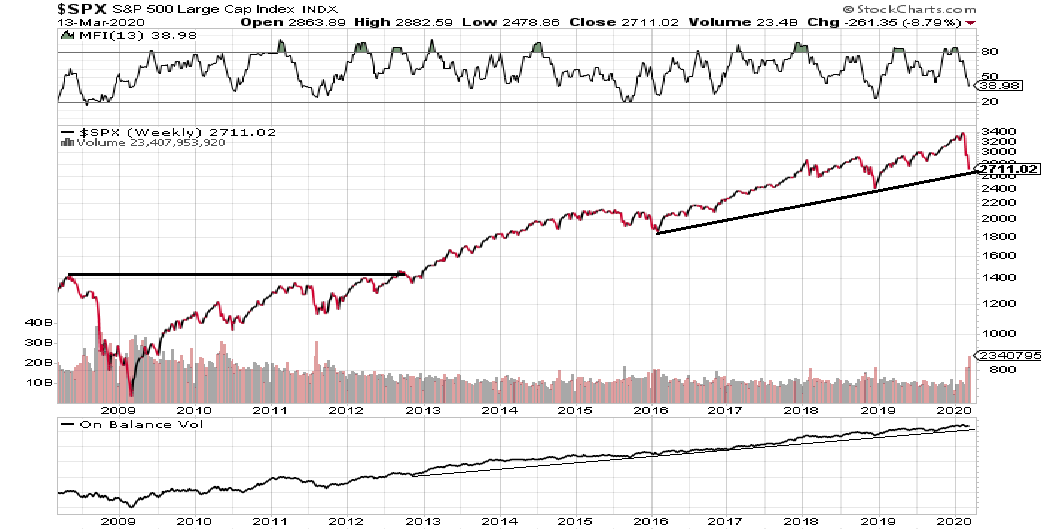
If you didnt know about the Covid 19 virus, had been meditating in a cave for 2 years, came back and saw the above chart, I suspect the thought would be "great buy opportunity".
I have updated my portfolio. It is almost completely sold out. Go to the Peters Portfolio page for details.
MARKET COMMENTS: As of 6/3/20: See charts below
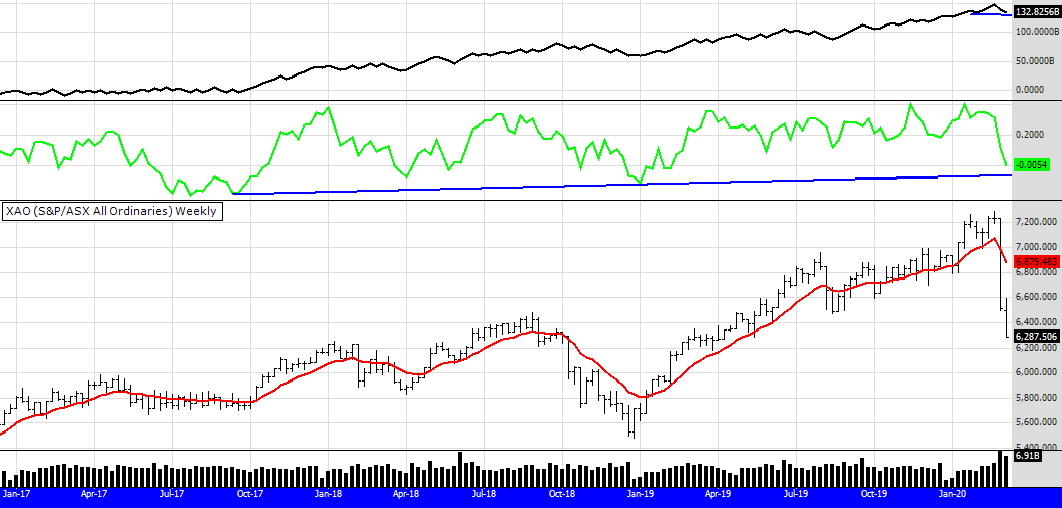


I have posted 3 charts. The 1st one is the the Australian market, it has fallen harder than the US. The XAO is down around 14% (1000 points) from its recent high and the SP 500 (the 2nd chart) is down around 12.5%. The US market could fall to major trend line support at 2700, which is another 9%, which at the current rate of fall for the Aussie market, is probably another 11%. However we have major trend line support at 6000, which is about 5% away so we may pull up there if the falls continue. The 3rd chart is the monthly chart of the XAO, there is impressive divergence between price and volume. The volume indicator is the Money Flow index (green line) using a 3 month period.
Overall this is what I see, and bear in mind all we have is the present moment. The US and Australian markets are in a long term uptrend. I do not think we have entered a bear market, although this could happen. Volume and price support are in tact, particularly in the US. The Australian market has been hit harder because of our real or perceived over reliance on China. In hindsight you can see the topping patterns the indexes were showing a few weeks ago. However topping patterns do not always result in savage sell offs like this one, this sell off is driven by panic and uncertainty, more than fundamentals, even though I acknowledge the market was expensive and perhaps over bought.
During the week I went to a seminar on stock market cycles. Before this recent event I was of the view that we were in a late cycle bull market. Late cycle bull markets can have parabolic rises mixed with extreme sharp pullbacks. They then gather steam and march up again. This happened in 1998 when the market fell 18% mid year but then rallied 28% from the low to end the year in positive territory. The scare then was uncertainty about Russia's political and economic future, not dissimilar to the current China scare. If you want to read the historical article here is the link. Interesting to note the similar rhetoric about the world ending and a bear market.
https://money.cnn.com/1998/08/31/markets/marketwrap/
Of course many will remember the rallies in late 1998, 1999 and early 2000 before the dot com bubble burst, but before that huge profits were made. So in summary.
It is too early to tell what will happen. Charts look supportive. More falls would not surprise me, but if they come charts are even more supportive. No one has mentioned yet that this drama may play into the hands of Trump, his reelection chances and provide an ace up the sleeve for trade deal talks.
All the best for the week, it may be another tough one.
Peter
This chart below shows two volume indicators, the On Balance Volume and the Chaiken Money Flow (displayed in green) using a 13 week format.
MARKET COMMENTS: As of 28/2/20: See chart below

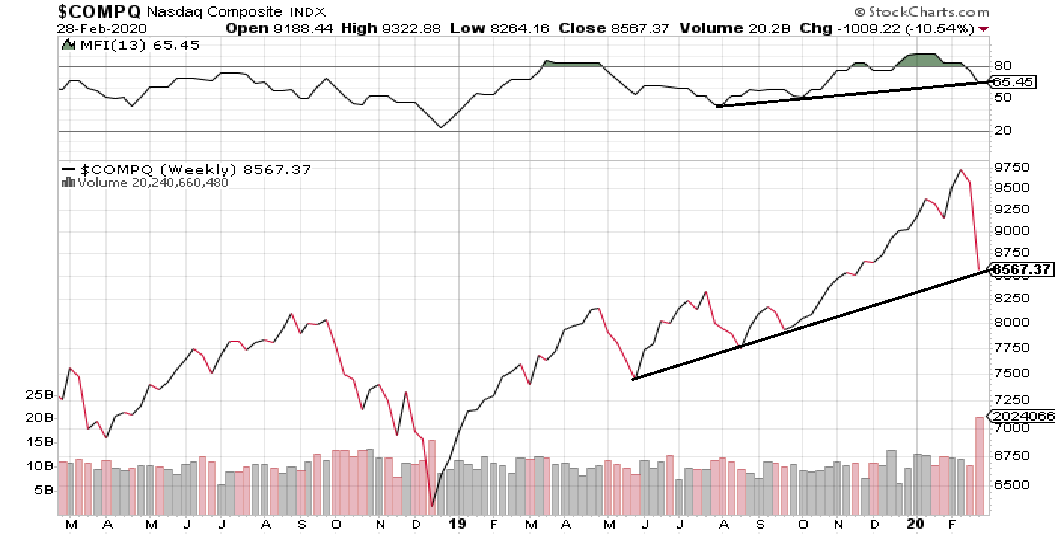
Well what a week, enough to test the best of us. In one the week the world has changed. We are all wondering when will the selling end and how serious is this? Is this as bad as the twin towers attack? Or the GFC? The answer: We do not know.
The Aussie market looks no where near as bad as the US, but we did not rally as much as what they did the last 8 months. Unfortunately, it all depends on that chart of the US SP500 and perhaps more so on the Nasdaq. A reason why I posted both those charts above. The SP500 price is sitting on support, but it could fall to the long term trend line at 2700, dragging our market down with it. The volume indicators on the XAO chart look strong, and although not shown on the SP500 chart, they look similar there too.
The Nasdaq looks very supportive. Both price and the 13 period Money Flow index sitting on support.
As I said in my email on Wednesday, the markets were over bought and looking for a reason to take profits, but now it's possibly developing into panic. Despite the pullback in my portfolio surprisingly I only have 2 sell signals, plus AD8 that I missed the alert on last week. So if the markets continue to fall next week I will have to endure some more suffering. Lucky I am a Zen priest, as suffering is my speciality, but let me assure you, it isn't easy so don't feel bad if you feel bad!
Have a nice weekend and try not to worry. I will be following my system.
MARKET COMMENTS: As of 21/2/20: See chart below

An interesting week. Big volume and the closing price for the week the same as last week. (give or take a few points) The CMF is still pointing down, but the OBV screaming up. What does that mean? My guess is uncertainty. In strong bull markets the non-believers and doom and gloomers are always looking for a reason not to buy, sell or short. This could be happening now. However, there is a fly in the ointment for the shorts. The Russell 2000 in the US has been a laggard in this market, but if you look at a monthly chart it looks to be changing its mind. It will be a very positive indicator for this bull market to continue if it can make a new all time high, which is only a few percent away. The chart is below.
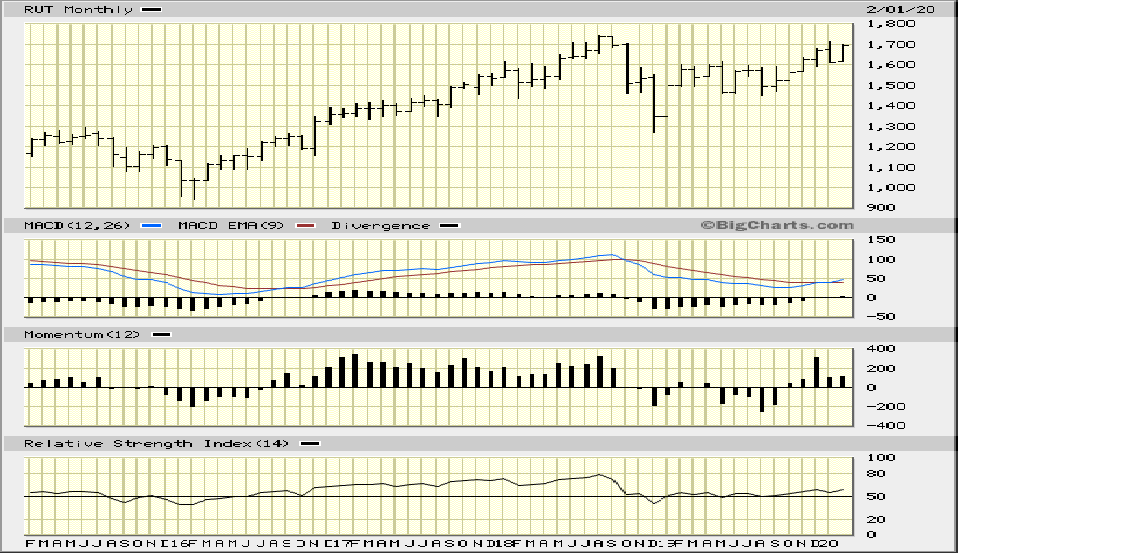
MARKET COMMENTS: As of 14/2/20: See chart below
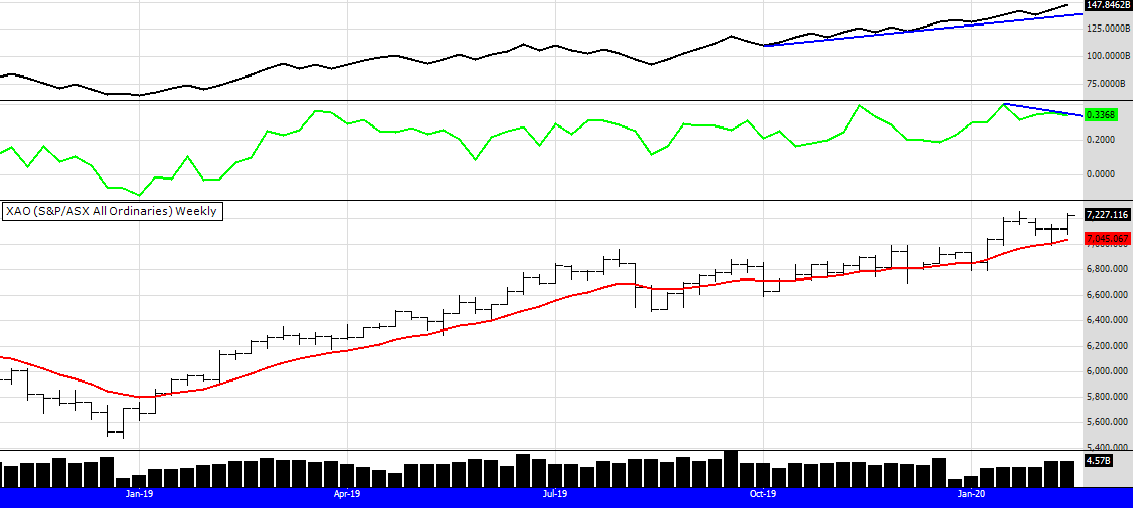
This is a very strong market. How long it continues no one knows. One thing we do know, and is a fact that often surprises many people, is that bull markets and strong trends can last a lot longer than what many think. The chart above shows a slight volume divergence on the CMF (Chaiken Money Flow) indicator. Many traders and investors place far too much importance on indicators, they are a guide only and what needs to be remembered is that price is the ultimate indicator. So, the price is telling us that this market is going up. The bull filter is active, it's all go. As a beginner your focus should be on finding a system that suits you, one you feel comfortable with. If you have that process in place, your focus needs to be on developing your mind. The development of your thinking needs to go hand in hand with the development of your process.
It doesn't matter how strong any market is, if you do not have good process and good mindset, profits will ellude you.
Have a good week.
MARKET COMMENTS: As of 7/2/20: See chart below
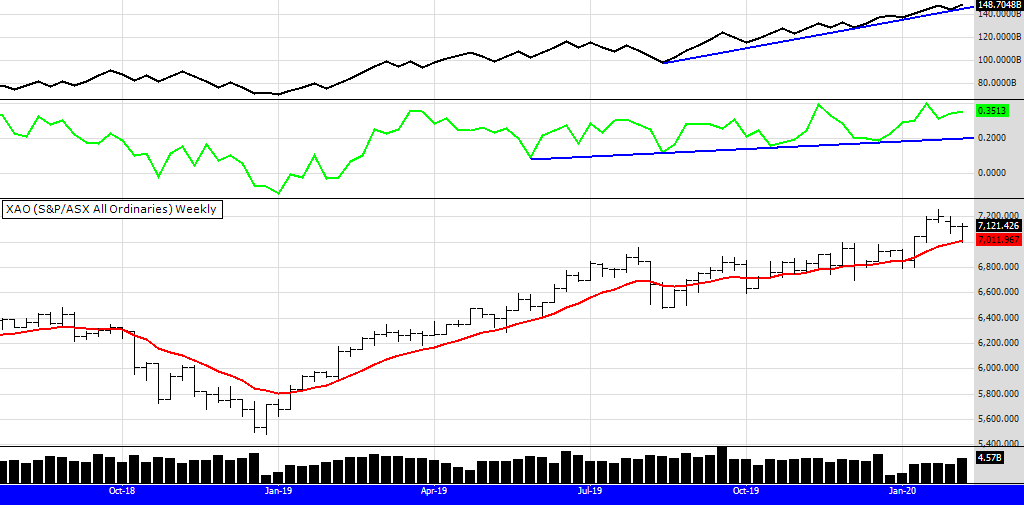
The market continues its' pullback. That is a strong close on this weeks bar. However! and don't ever forget this. One weeks price action does not make a trend. Now we are in stage 3 of the bull market, volatility will probably increase. Why? Because markets are driven by emotion. The fear of loss and the fear of missing out will dominate this market for the time being. When I say the time being, I mean until there is a clear sign this bull market is over. That sign has not yet come, so as emotionally difficult as it may be, your best option is to plan your trade and trade your plan. Do I sound like a song stuck on repeat? Good. Repetition of good process is what this game is about. Have a good week, stay calm, stick to the system. Size your trade, buy the signal, sell the signal, repeat the process. Trading can be easy but we make it hard.
MARKET COMMENTS: As of 31/1/20: See chart below

The market did pause a little this week. Does it listen to my comments or is everyone reading this web page?!
This market still looks very strong despite all the concerns. Are there not always concerns?
Volume indicators are up, price is up, bull filter active. It's a no brainer.
You know what to do. Follow the system and hold your nerve. If you are stressing you either have the wrong system (for you) or your position sizing is too large, or perhaps you have too few stocks creating portfolio volatility. A reminder the eBook system carries an average of 20 stocks, to spread risk and volatility.
Adjust, re think, re group, carry on, it's all just a process.
or ring 0403821523 for some coaching, before I run off to my cave again. That's always a strong chance.
Have a good week.
MARKET COMMENTS: As of 24/1/20: See chart below

The market rose a little this week. I notice the CMF volume indicator (in green) has double topped and is pointing down. However the OBV is still rising strongly.
A pullback or some sort of pause now would not surprise me, but either would more upward momentum. This is the problem with T.A. (Technical Analysis), which really means chart reading. It is just very difficult at times and also quite subjective. The CMF is not a strong indicator, it can take time for price to follow its lead, although it did give an early warning back in Aug/Sept 2018.
Dynamic bull markets challenge our nerve, but if you know your exit, and position size correctly, try and enjoy the ride, instead of stressing about when you will get off. The market will tell us when to get off, at the moment it is saying hang in there.
MARKET COMMENTS: As of 17/1/20: See chart below
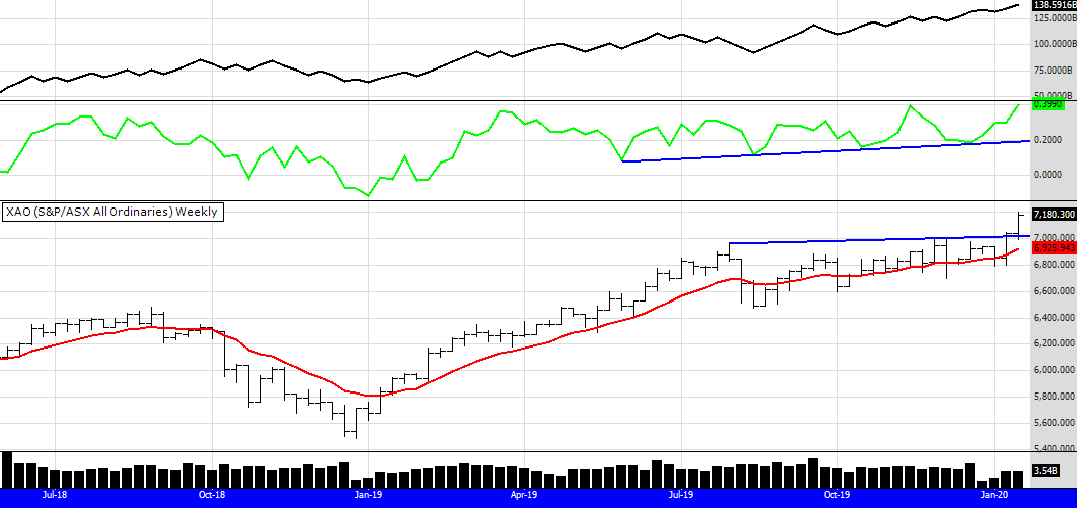
There is a Zen saying "if it is not necessary to say anything it is necessary to say nothing".
However for those of you that really need to read something, I have posted below what I wrote last week.
Well we have a breakout. I would like to see more volume, but a breakout is a breakout and sometimes we want more than what the market gives us. Many have been waiting for this breakout for confirmation of the bull market in Australia, so will those people now buy?
In my opinion we have entered stage 3 of the bull market. For those of you that do not know about market stage analysis, stage 1 is consolidation or a recovery from a bear market. Stage 2 is the "disbelief stage" or the stage when no one believes we have a bull market (I was writing about this a few years ago). Stage 3 is the strongest phase, where prices rise at rapid rates, big money can be made (or lost) and volatility increases. Examples of stage 3 markets would be the late 1990's before the tech crash and then a decade later during a few years in the lead up to the GFC in 2008.
What to do and how should you trade it? Guess what I will say next :)
Have a method and stick to it.
MARKET COMMENTS: As of 10/1/20: See chart below

Well we have a breakout. I would like to see more volume, but a breakout is a breakout and sometimes we want more than what the market gives us. Many have been waiting for this breakout for confirmation of the bull market in Australia, so will those people now buy?
In my opinion we have entered stage 3 of the bull market. For those of you that do not know about market stage analysis, stage 1 is consolidation or a recovery from a bear market. Stage 2 is the "disbelief stage" or the stage when no one believes we have a bull market (I was writing about this a few years ago). Stage 3 is the strongest phase, where prices rise at rapid rates, big money can be made (or lost) and volatility increases. Examples of stage 3 markets would be the late 1990's before the tech crash and then a decade later during a few years in the lead up to the GFC in 2008.
What to do and how should you trade it? Guess what I will say next :)
Have a method and stick to it.
MARKET COMMENTS: As of 3/1/20: See chart below
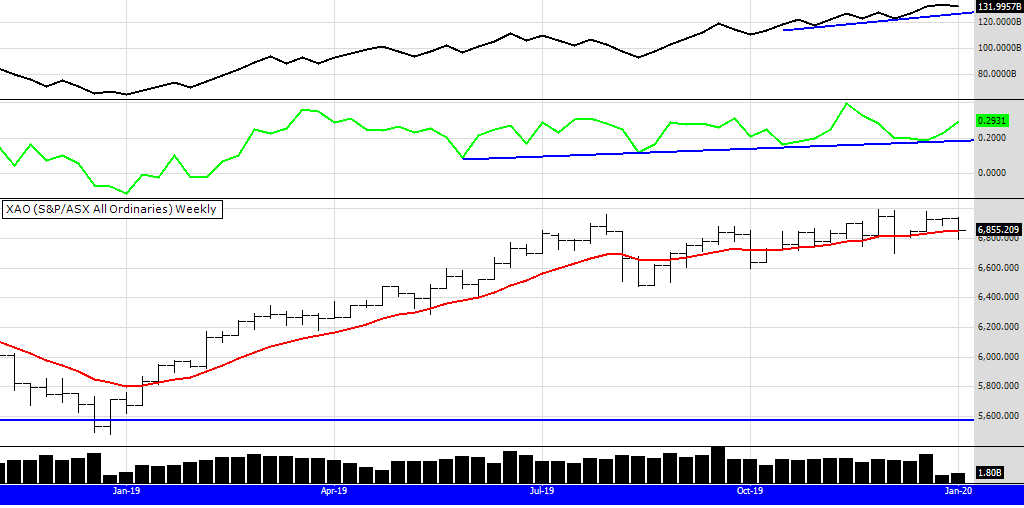
Another short trading week of 4 days due to the new years day holiday. The index continues to trade sideways despite indexes overseas continuing to rally up. We go into the new year with uncertainty, but of course this is always the case in the markets. Think of the uncertainty that existed this time last year and then the year of great results that followed. Our resources sector is one to watch, particularly the gold market as the gold price has a run up. However some of the gold stocks are not responding as strongly as I would have thought, perhaps they are telling us the gold rally may slow soon?
MARKET COMMENTS: As of 27/12/19: See chart below
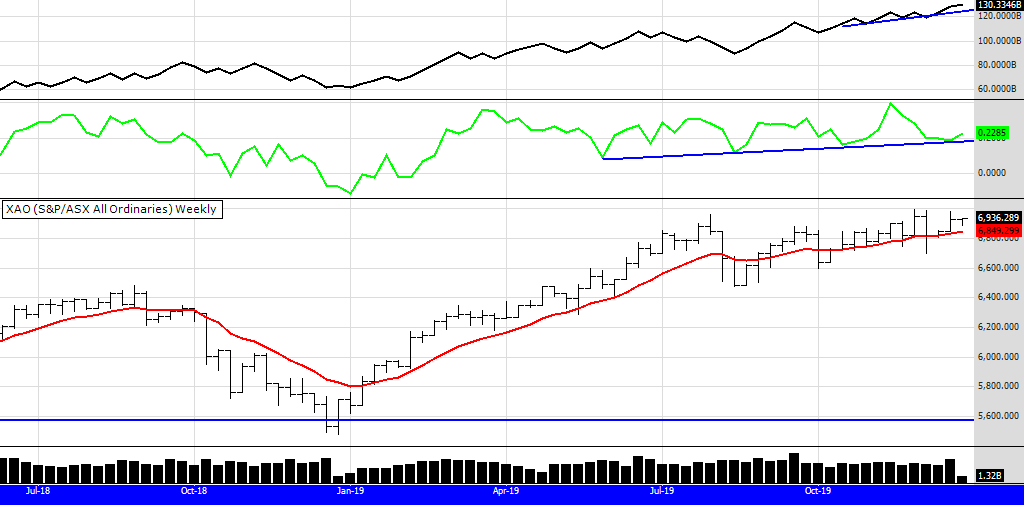
A quiet week this one, as is to be expected with the Christmas holidays. A reminder that although it is only a 3 day trading week, as is next week, they are still regarded as a weeks trading and the rules of weekly systems are to be followed accordingly. A fact there are no buy signals this week is a coincidence, it has nothing to do with the 3 day trading week.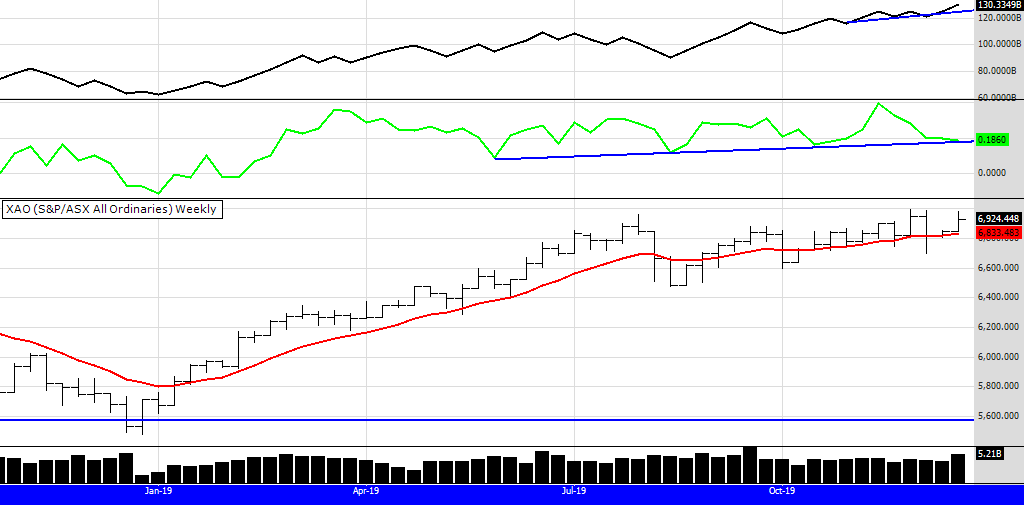
This week the XAO went up with some hefty volume behind it. Well "its all happening" as those of you who remember Bill Laurie the excitable cricket commentator, would say. Lots of new 52 week closing highs this week, perhaps as a result of the Brexit and English situation settling. Also those of you that attended my ATAA lecture at Newcastle on Saturday 14th will recall me saying it seems more money is coming into the market. It has certainly been a dynamic year and great rewards for those that have stuck to their system. The eBook system is now sitting on 31% p.a for 2019 (more if you were compounding from the year before) and as of the end of this week, Peters Portfolio is up over 50% for 2019. I wonder how the year will end? I wonder how next year will be? Perhaps you could ask not why, but what? What is happening and what can I do about it? Remember my mantra from the eBook...... There are 2 reasons why traders do not make money from the market. 1/ They do not have a method 2/ If they have a method they won't stick to it. I can help you with both those in 2020. Merry Christmas and Happy New Year.
MARKET COMMENTS: As of 13/12/19: See chart below

Well its hanging in there. A quiet week really. It looks like the conservative party in the UK have a decisive victory. As markets hate uncertainty I would think that this would be a confident booster for markets globally. In the short term I notice the FTSE 100 futures (top 100 in UK) has rallied. As I often say, time will tell on that one. Not many 52 week highs this week in the 300 as the XAO continues to consolidate. Most portfolios continue to track sideways to down, as some big trenders from early in the year get stopped out, a natural churning of the market as money reallocates into the next strong stocks.
MARKET COMMENTS: As of 6/12/19: See chart below
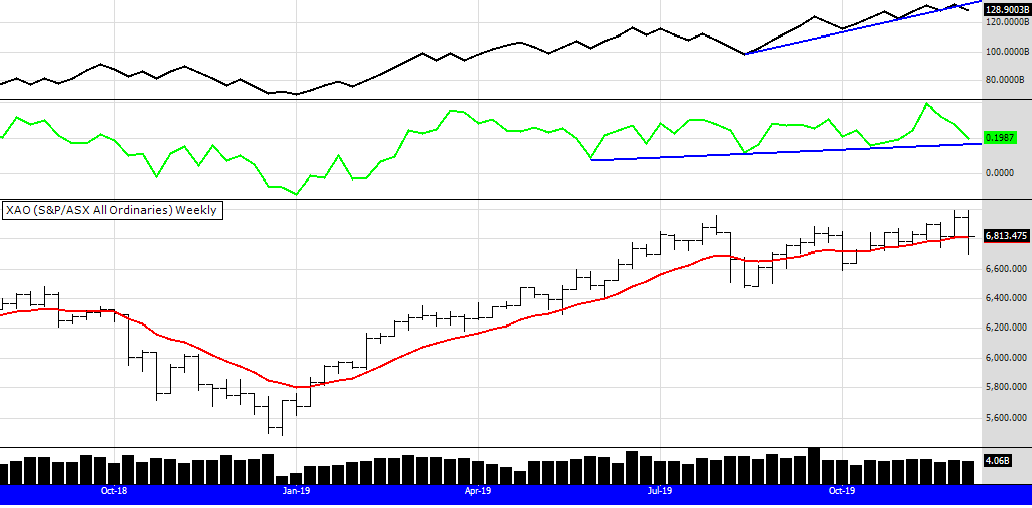
The short term trend line of the OBV has broken, although it is short term, and it has not made a lower low. The CMF (green volume indicator) is on support. The Bull filter is active (just). I did say quite a few weeks ago I thought the market would go sideways a while until it was ready to move up again. Last week it looked like it was breaking up, but Donald stopped that by increasing uncertainty. Nothing we can do except hang in there and follow our systems for no one has any idea of what will happen next. That is the good part about having a committed method, while others flounder we just follow our rules.
MARKET COMMENTS: As of 29/11/19: See chart below
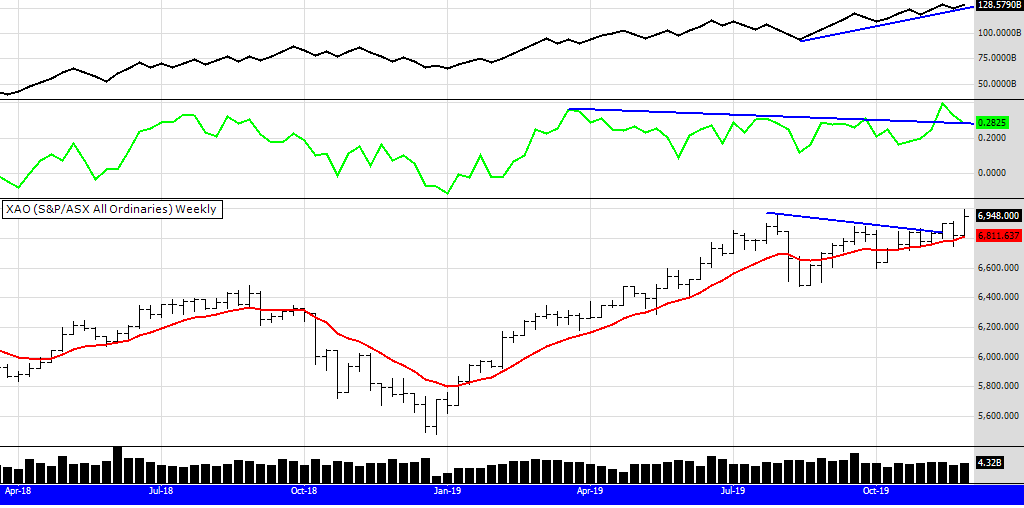
The index rallies. However it seems to be mainly in the top 50. The smaller stocks not responding as well. So, if you are like me and have a lot of holdings in small and mid caps you are probably not seeing the gains. In saying that, I notice the Russell 2000, the mid cap index for the US (which are still gorilla stocks by our standard) has made a 52 week high. We keep hearing how the economy is struggling, but if you look at the XDJ, the Consumer stock index, it's going ballistic. So something does not stack up. Are people spending more than what the figures are showing? The market can be a leading indicator, perhaps the economy is due for an uptick. Have a look at the XPJ too. The property sector looks strong which also bodes well, as we all know the property sector drives our economy.
MARKET COMMENTS: As of 22/11/19: See chart below
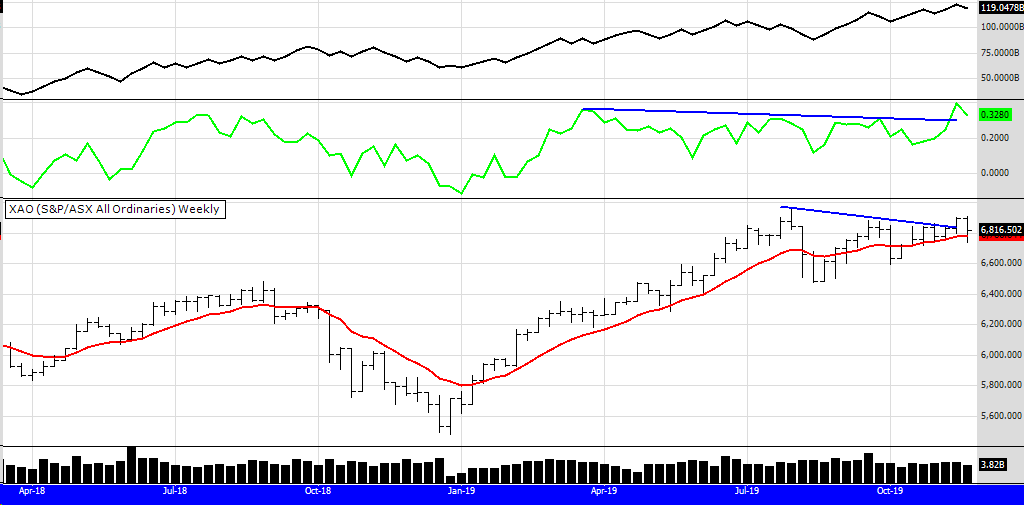
Is that a reversal bar for this weeks trading? One bar and one weeks trading does not make a trend. The XAO is above its Bull filter, volumes are up, trend is up. How are you going adopting a "don't know" philosophy about what will happen and sticking to the system? It was a lack lustre week really, on low volume, people are still nervous, anxiety rules, don't get caught up in it.
MARKET COMMENTS: As of 15/11/19: See chart below
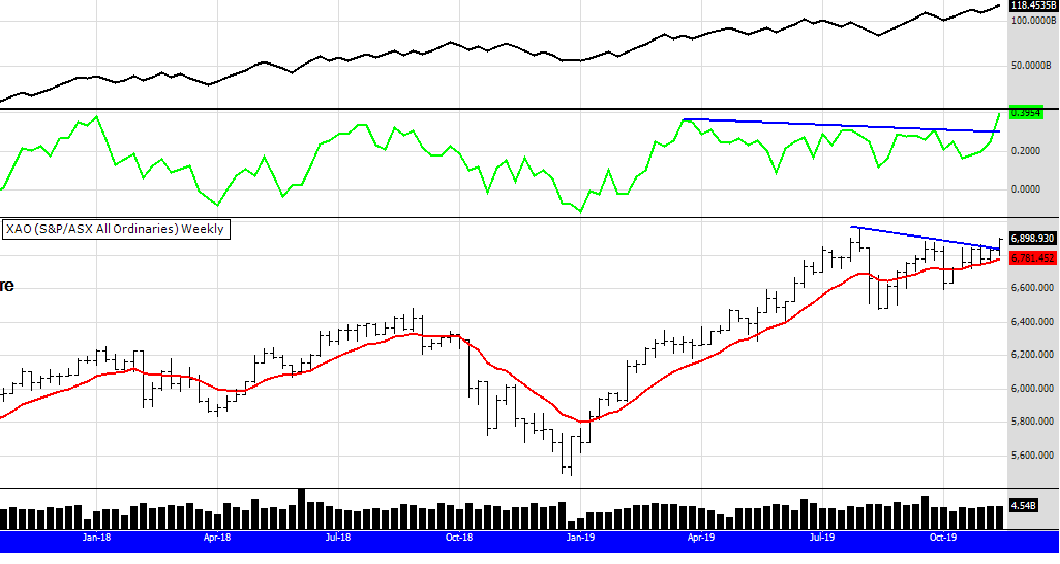
Last week I said: "So much doom and gloom persists in the news but the charts don't reflect this. The SP500 and the Nasdaq in the US continue to rally, it's only a matter of time before that positivity catches on here in Aus. A falling gold price bodes well for the markets in general, perhaps fear is subsiding and more confidence is creeping in about a US/China deal. Time will tell."
And a few weeks ago I said: "The overall market looks extremely bullish with a positive divergence between price and volume (the OBV)"
Well time didn't take long. The XAO has had a strong rally on good volume. Price and volume trend lines have been broken to the upside. Regular readers will know what I will say now.
Follow your system. If you don't have one, get one and stick to it. Its the best way to succeed in the market.
MARKET COMMENTS: As of 8/11/19: See chart below
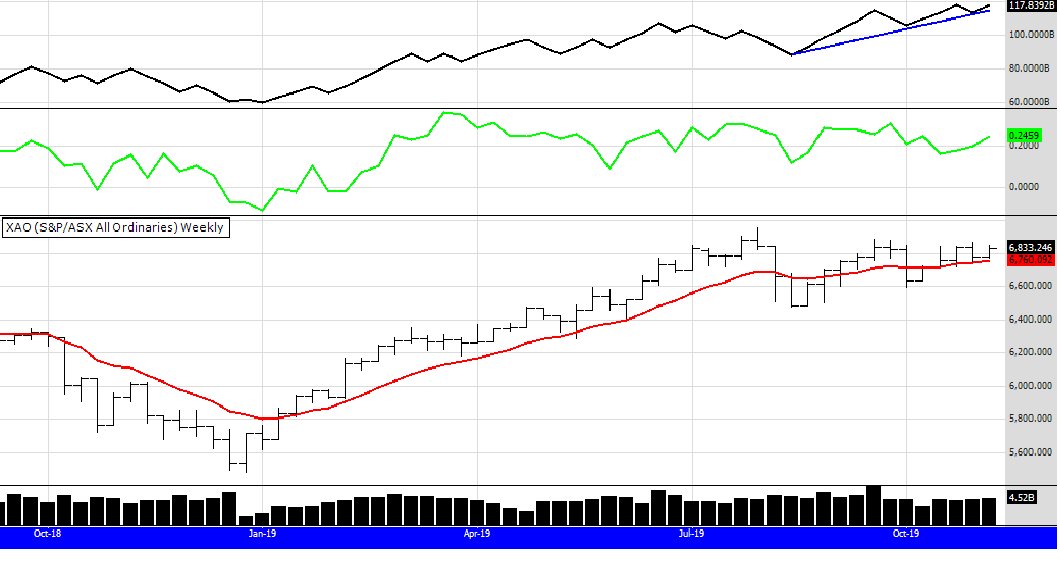
I mentioned a few weeks ago I thought the market (when I say the market I mean this index chart) needed to churn and perhaps go sideways a while. It seems to be doing that. Interesting to note their are 7 new signals in the eBook system this week, indicating the market has strength. The index chart above has been dragged down by the big 4 banks, Macquarie being an exception. So much doom and gloom persists in the news but the charts don't reflect this. The SP500 and the Nasdaq in the US continue to rally, it's only a matter of time before that positivity catches on here in Aus. Those holding gold stocks I hope have taken their stops, Peters Portfolio was stopped out of most gold stocks quite a few weeks ago, the gold price looks like it has further to fall....but as usual no predictions here! Just follow the system. I notice NCM has been stopped out from the eBook system. A falling gold price bodes well for the markets in general, perhaps fear is subsiding and more confidence is creeping in about a US/China deal. Time will tell.
MARKET COMMENTS: As of 25/10/19: See chart below

Despite the market index rising, this week ending 25/10/19 the eBook system fell 2.6%. Peters Portfolio fell 1.5% with some changes made last week (2 buys, 2 sells). The index gains were driven by the big 3 indexes, banks, resources and health. Tech fell. The eBook portfolio and my portfolio do not hold a lot of stocks in the 3 bullish sectors mentioned, so they suffered a pull back. The overall market looks extremely bullish with a positive divergence between price and volume (the OBV). Last night the Nasdaq broke up and out of a consolodation period which bodes well for tech stocks. I was saying to a client the other day this market could now really take off with many sectors chiming in for the rally. The strength of this market is not talked about much, doom and gloom persist, my experience is that means the market will run higher. We need irrational exubrance to exist in a big way before markets crash. We are not at that state of delusional thinking yet.
MARKET COMMENTS: As of 18/10/19: See chart below

The market started the week well but faded into Friday. The longer term volume indicator of the OBV looks very positive, the shorter term 13 period CMF is sitting on support. The Bull filter is active and there are some signals this week, more than last week so stocks are still trending up. There seems to be some churning going on as the market goes through a consolidation period. I have discussed churning before. It is when there is indecision by traders and investors as to what sector to be in. Will resources rally, will gold recover, can tech and health stocks continue their march upward, is the consumer sector really that bad? It's all enough to drive one crazy. However consider this, if you buy stocks that are trending up and sell the ones that are trending down, do you really need to know what sector will rally next? We don't really need to know to follow the system, the churners will decide for us. They will sell the stocks they feel will fall more, and buy the ones they think will go up. What will we do? Buy the signal, size the trade, sell the signal, repeat the process. Too simple? That method has returned 57% in 21.5 months. Peters Portfolio had a small rise this week, I have posted the PDF on the Peters Portfolio page.
MARKET COMMENTS: As of 11/10/19: See chart below

Last week I said this. "Personally I think the markets need a period of consolidation before the long term uptrend continues". This weeks bounce up on low volume may be confirming that thought, typical price action for a sideways period is up and down movement on low volume, which can mean "no conviction" from Bulls or Bears. That does not mean to say stocks won't trend because strong ones will continue to do so, like PNV this week. The bull filter is active , if you are wondering, but we have no signals (except WBA a takeover) so it's shut down the computer and come back next week. Easy share trading. Peters Portfolio rose nearly 2% this week.
MARKET COMMENTS: As of 4/10/19: See chart below
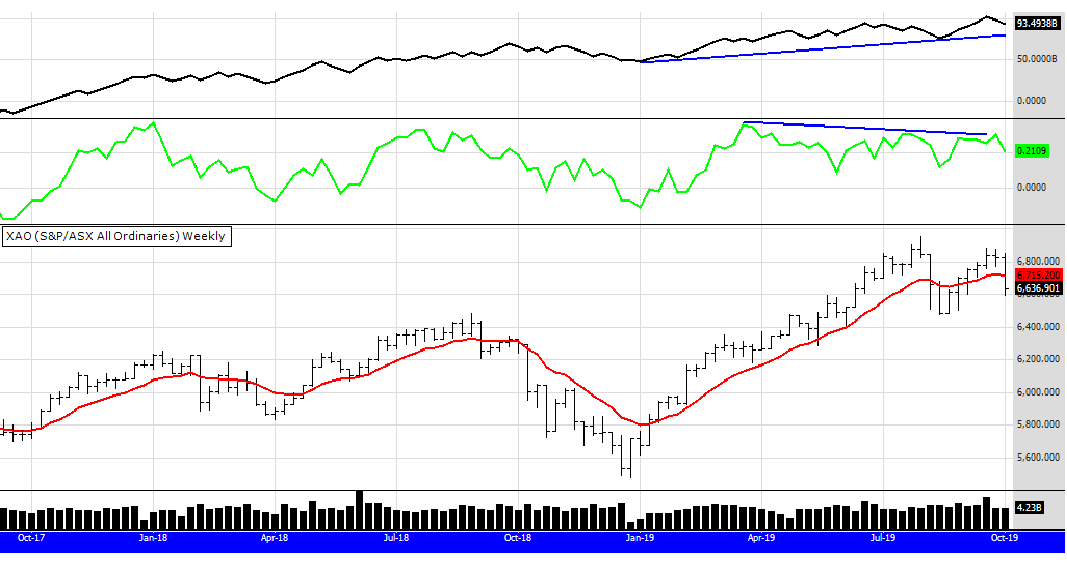
Ha! So the CMF warning had some merit after all. The market falling, from concerns of global growth. The market climbs a wall of worry and how valid that worry is only time has the answer. Looking at the chart above volumes still look solid, they are trending up, and price is trending up too but the XAO has closed below the bull filter so we stand aside for the time being. We watch with interest and without judgement, helping our minds to remain calm. You have a system or method (hopefully) so focus on sticking to it, not predicting or getting caught up in too much analysing. Personally I think the markets need a period of consolidation before the long term uptrend continues. I have posted a long term monthly chart below, the trend looks impressive and volumes judged by the CMF even better. Peters Portfolio rose a little this week, bucking the markets downtrend. After 2 years of trading the portfolio is up 62% compared to the All Ords up 12.7%.
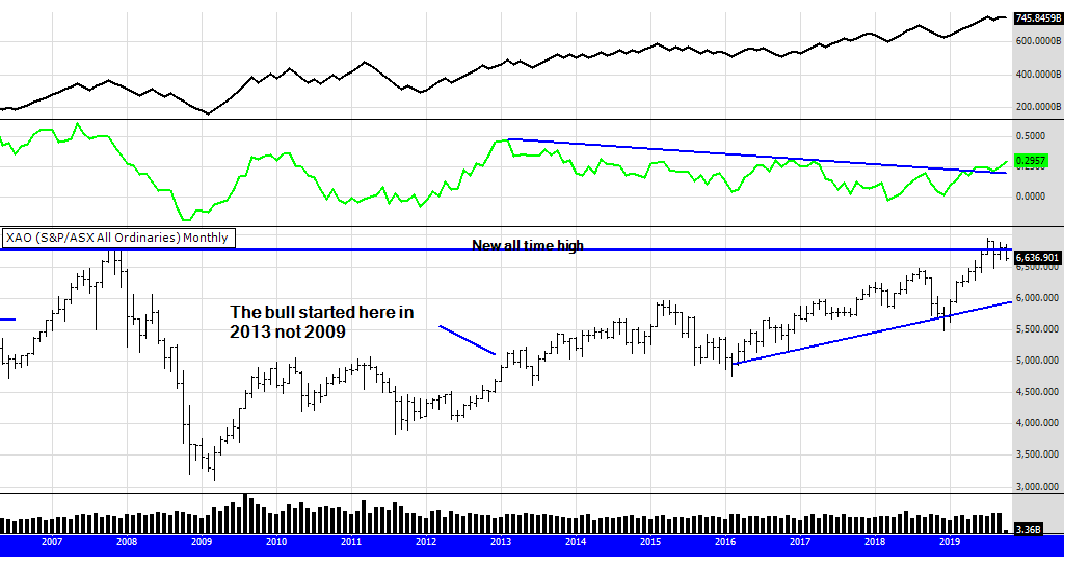
MARKET COMMENTS: As of 27/9/19: See chart below
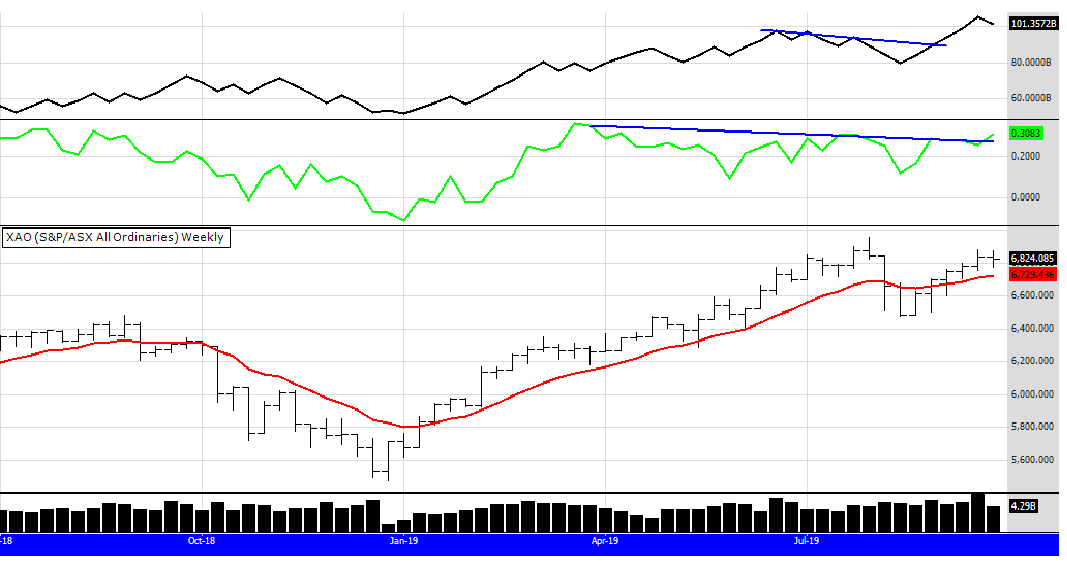
Now it is getting interesting. The 13 week period CMF breaks the trend line to the upside negating the negative divergence I mentioned last week. OBV is still positive. Price holds. The trades in the eBook system this week are a perfect example of why I adopt the Zen philosophy of "Don't Know" and use probability NOT prediction. If you panicked and sold out last week because of the divergence in volume, you would be full of regret. If you are regretting something, let it go, move on to the next trade and put it down to lesson learned. Peter's Portfolio fell a little this week, around one third of a percent, so I am leaving the equity curve on that site page unchanged. Quite a few changes in my holdings this week as I re weight the portfolio.
MARKET COMMENTS: As of 20/9/19: See chart below
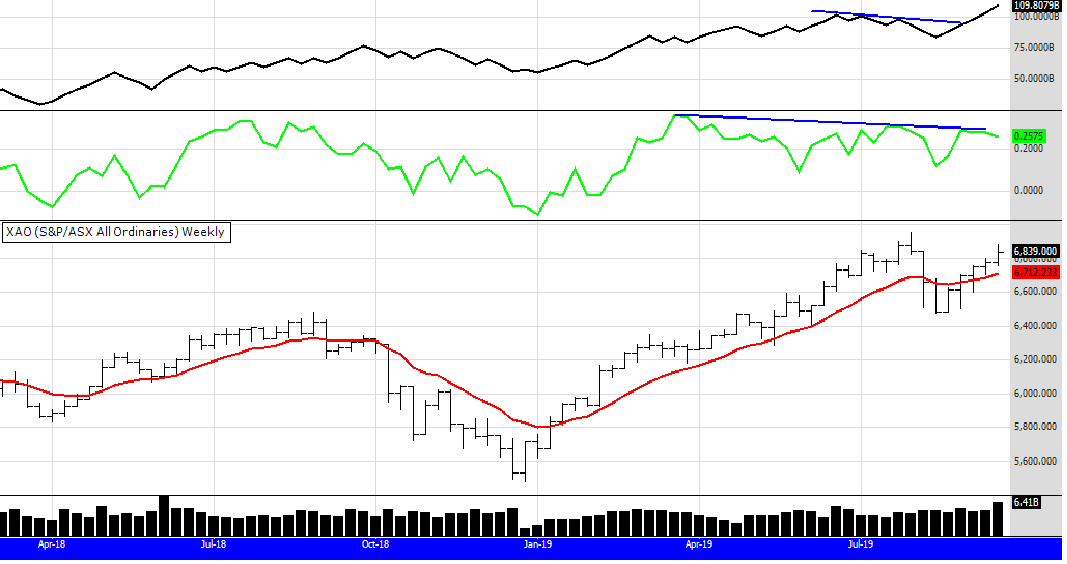
A similar looking chart to last week. The price rises, OBV indicator confirms, but the CMF lags. That is a serious looking divergence between price and volume, but it is only ONE indicator. I could find another indicator to support the big volume bar of this week, shown in the volume column graph. This is an interesting little discussion, because it is what most traders do, look, analyze, worry and get confused. So it would be wise to fall back on what we know, and what we know is this: The market is trending up, Bull filter is active, alerts are generated to buy or sell. It's all a process and it can be a simple process if only we allow it to be. Peters Portfolio had a stellar week rising nearly 5 %, helped along mainly by ALK.
MARKET COMMENTS: As of 13/9/19: See chart below

MARKET COMMENTS: As of 13/9/19: See chart below
This week the XAO continues its rise. The banks were the main drivers, and the resource heavyweights helped too, so the XAO looks good. However the mid cap sector fell, and Peters portfolio had a flat week, as it is mainly invested in mid caps. The chart above shows the OBV breaking the trendline but the CMF, using a 13 week period, is yet to confirm. As always, let us not read too much into this chart, the main thing is the bull filter is active and the market is trending up.
MARKET COMMENTS: As of 6/9/19: See chart below
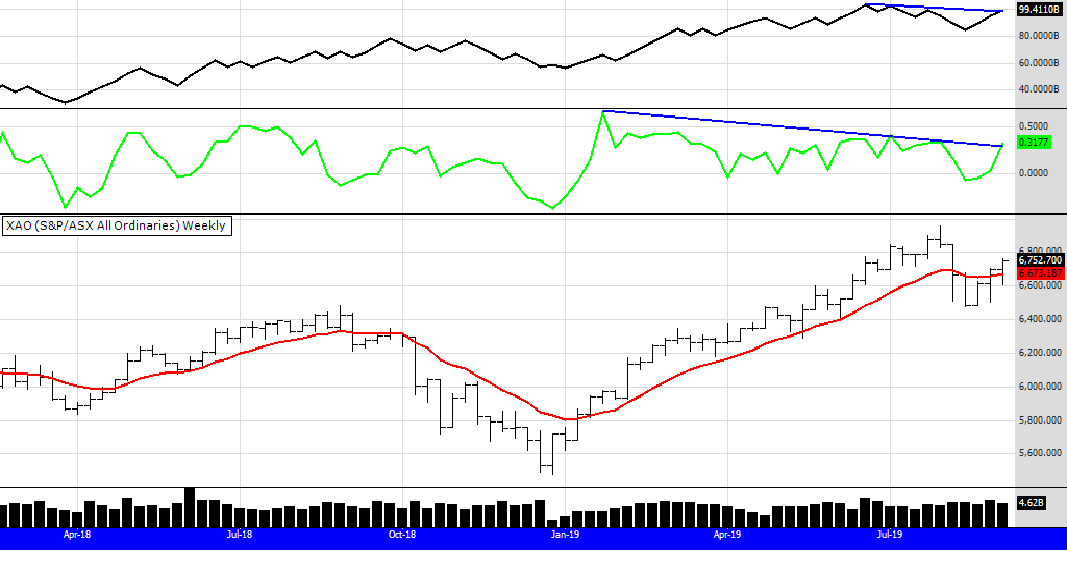
The XAO continues the recovery from the recent sell down. Volume indicators are approaching resistance points but we won't read too much into that because as always, the price is the main indicator. So, it is up, the bull filter is active, so we follow the process. Peters Portfolio rose around 1% and will be posted later this weekend or on Monday. There were no changes to it from last week. Have a good week. Peter.
MARKET COMMENTS: As of 30/8/19: See chart below

The Bull filter is active. Volumes are testing the upper levels of their trend lines. I think I said enough in last weeks market comments, and with the news letter this week.
"If it is not necessary to say anything, it is necessary to say nothing". A Zen saying.
"Stick to the system". A Peter Castle saying.
I wrote the above on Friday night, (it is now Sat morning) after some reflection I thought an explanation may be needed. The Zen saying refers to not falling into the trap of meddling, or thinking you need to meddle, when there is no need. As traders the greatest challenge is to stay removed from the crowd when negativity abounds. Often we feel we need to do something but often the best response is to do nothing. Or "sit on your hands" as some of the famous traders of the past have expressed.
As to the Peter Castle saying. I will repeat my teaching mantra. The two reasons why traders struggle to make money from the market is:
1/ they don't have a system or method
2/ if they do have a system or method they don't stick to it.
Your trading success or failure will revolve around one or both of those points.
Peters Portfolio will be updated on Saturday afternoon, I have not done the final calculations but it had another good week rising around 4%.
MARKET COMMENTS: As of 23/8/19: (see 3 charts below)
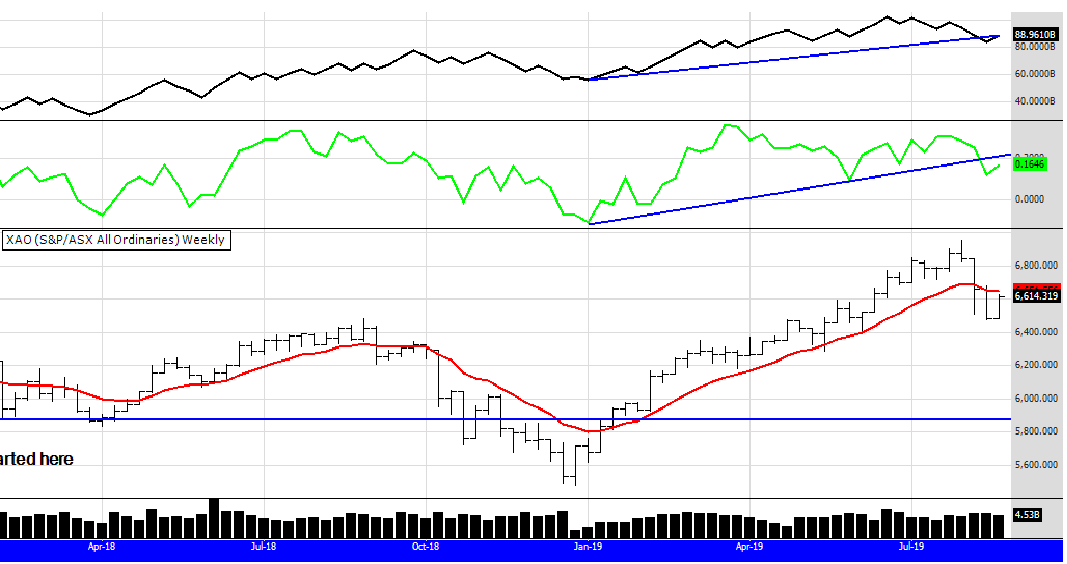
The XAO, dominated by the top 20 stocks, recovered a little this week. Volume indicators look weak, with the trend lines remaining broken to the downside. The bull filter for the eBook system is inactive. So our strategy is to stand aside and hold our nerve while the shakeout continues, which seems certain to happen as I know the US market had a fall on Friday so know doubt we will follow. The easy share trading systems had a good week, the eBook system rose 2.5 % and Peters Portfolio over 6% on the back of some good company reports, the Castle Fundamental Criteria doing its job well. It seems to be more of a stock pickers market at the moment, as the general euphoria of the recovery from Dec 18 slows, and fears become more intense. There are another 2 charts below with more comments.......

Last week I mentioned the longer term price trend line, I have drawn that 3 year line on the chart above, as well as a shorter term 2 year trend line on the influential OBV indicator. Now, this is important....if that OBV trend line breaks down it would indicate the probability of this Index to keep falling. It has already fallen to the first horizontal support line and could fall to the second one near 6200. Horizontal support lines are not as strong as sloping up trend lines, but the next sloping trend line of significance is at 5700 which is a long way from where we are now. One more chart below.........

The chart above is of the US SP500, arguably the most influential chart in the world. Looking at the OBV indicator in the short term, ( a few months) it looks like more falls will come. A revisit of the lows in May would not surprise me, considering we are now in the bearish seasonal period of May to October. However. Looking at the OBV trendline starting around April 18, it still looks quite supportive. I know that some market commentators are advising clients to sell up completely or go to significant levels of cash. I think it's a bit early to make that call as the charts above do not look that bad, as yet. Good traders work with the information we have in the present moment, and good traders do not allow the noise around us to govern our decisions. It will be an interesting week, stay calm. All the best, Peter.
MARKET COMMENTS: As of 16/8/19: (see charts below)

The XAO keeps falling towards the 6400 mark, where I have drawn the blue horizontal support line. Volume indicators confirm the sell off. Horizontal support lines are not as strong as trend lines and the next trend line of significance is at 5900. (not drawn on chart) It is far too early to suggest the market will fall to that level but the chart above does look like more falls could easily happen. Support between 6200 and 6400 is my guess at the moment. The eBook systems trades posted above are hanging in there well, with no stops signalled this week. Peters Portfolio bucked the market trend and rose a litttle, an indication of the benefit of selecting stocks with good fundamentals. The Castle fundamental rules are taught to clients only and not discussed on this website. Although of course you do get to see what I am buying and selling. There were three sells and one buy this week in my portfolio and a slight raising of cash.
MARKET COMMENTS: As of 9/8/19: (see charts below)
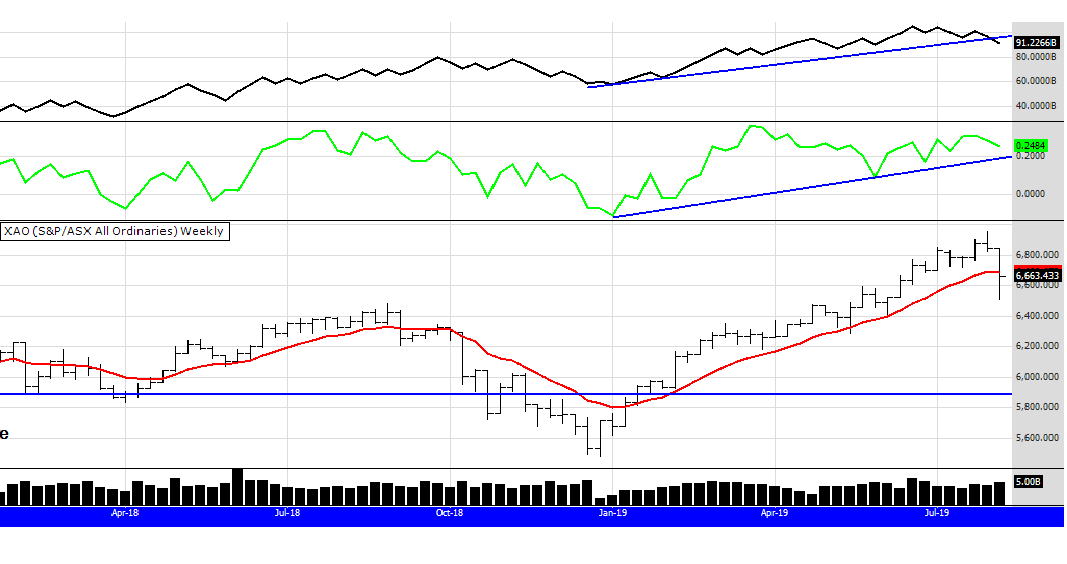
The XAO has fallen below the bull filter so there will be no more buying until it recovers. The OBV trend line has been penetrated to the downside but the CMF remains positive. The market has had a great recovery since the sell off late last year, when markets are high traders and investors get nervous and keep their fingers on the sell trigger. Donald Trumps comments through the week did the rest. It is too early to make a call about the market. This pullback is nothing in the big picture. All markets need to pause a while to decide which way they go next, to continue up, go sideways or sell. The market could fall to around 6400 and still be in a strong bull market so dont be surprised if we have some more volatility over the next few weeks or months. From a seasonal perspective the market often falls into Sept/Oct before it rallies into Christmas.
MARKET COMMENTS: As of 2/8/19: (see charts below)

The On Balance Volume is a slow indicator, but it normally gets it right, if divergence occurs between price and volume, they converge back. The OBV has not been confirming the recent rally of the XAO, it was heading down as price went up. However it need not be a big concern bearing in mind the XAO is dominated by big resource companies and the banks. The eBook system bucked the down trend, rising this week, helped by big rallies in NCM and TCL. Looking at the charts of the XAO and the volume, it does look as if a pullback is under way. How deep this will be is anyones guess, it may not affect stocks in the portfolios as the systems tend to steer away from the banks and big miners. Peters Portfolio fell a little this week, it has one more day to trade when I post it on Monday night. No new trades on either system, although NEA is showing a sell and will be let go next week.
MARKET COMMENTS: As of 26/7/19: (see charts below)

The market rises again. The unseasonal performance continues. The CMF volume indicator is strong but the slower moving OBV is not confirming. However price is the ultimate indicator and we follow the price. The Bull filter is in full flight but most portfolios of mine and those of clients are not buying because they don't have any money to do so. With few stocks being stopped out it's just a matter of holding on for the ride. It looks like at the end of this month the market will make an all time closing high. We will find out on Wednesdays market close.
MARKET COMMENTS: As of 19/7/19: (see charts below)

Despite the strong close on Friday, and the CMF volume indicator breaking the short term trend to the upside, the OBV is reluctant to be positive. Never forget that this index reflects mainly the banks and resources, other stocks can be performing well despite what this index does. However this index is so widely watched that it does affect the mood of the market.
The eBook system stalled a little last week but Peters Portfolio had a good week, I will post the portfolio either Monday night or sometime Tuesday. A reminder that the eBook system trades only the ASX300 and Peters Portfolio trades a stock list created from the Castle Fundamental rules. Some of these stocks may be in the ASX300 and some may not. Stocks that are outside the ASX300 but meet the Castle Fundamental criteria are included in the list of stocks I trade. This list is made available to clients and students.
MARKET COMMENTS: As of 12/7/19: (see charts below)
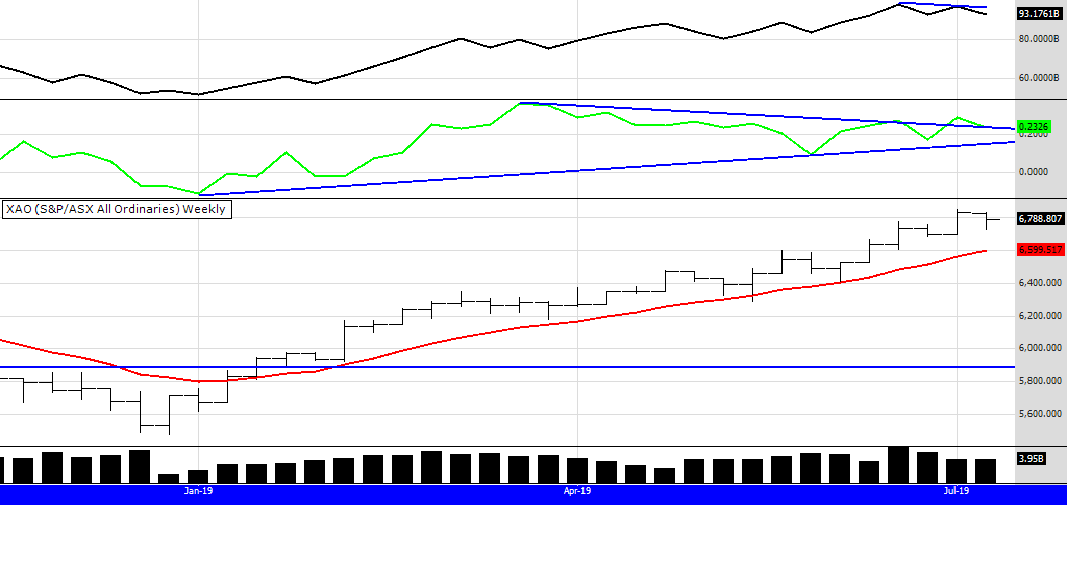
Not much to say this week. The market paused a little, perhaps respecting the indecision about volume and price, which I mentioned last week. It didnt stop the eBook system though, up another 1.3 % as strong stocks continue to trend up. Peters Portfolio pulled back a little, it holds different stocks to the eBook system. I will post the portfolio early next week, there were a few stocks sold and bought. Remember if you can to detach emotionally from what sells and buys, it's just a process of buying strength and selling weakness. Think like a football coach on the sideline, replacing weak or tired players with fresh stronger ones.
MARKET COMMENTS: As of 5/7/19: (see charts below)

The market rallies again but on low volume. The OBV (the black volume indicator) is not confirming the rally, note the flat lining of the trend line on that indicator where I have drawn a short blue line. However the shorter term volume indicator (the green CMF) is looking like a breakout. So as is often the case with indicators they can conflict and confuse. What to do? Price is the ultimate indicator. The price is up so we hold our positions. We reflect on our methodology and some of the time proven advice.
"Let winners run".
"The trend is your friend until it bends at the end".
and my favourite Zen saying
"If it is not necessary to do anything it is necessary to do nothing"
I have a very important chart for you to consider, in a week or so I will write a news letter about it. Those of you that follow my work will need no explanation. I will give you a clue, look what happened the last time the XAO made a new all time high. Now think about how the banks and resource stocks have been performing lately.

MARKET COMMENTS: As of 28/6/19: (see charts below)
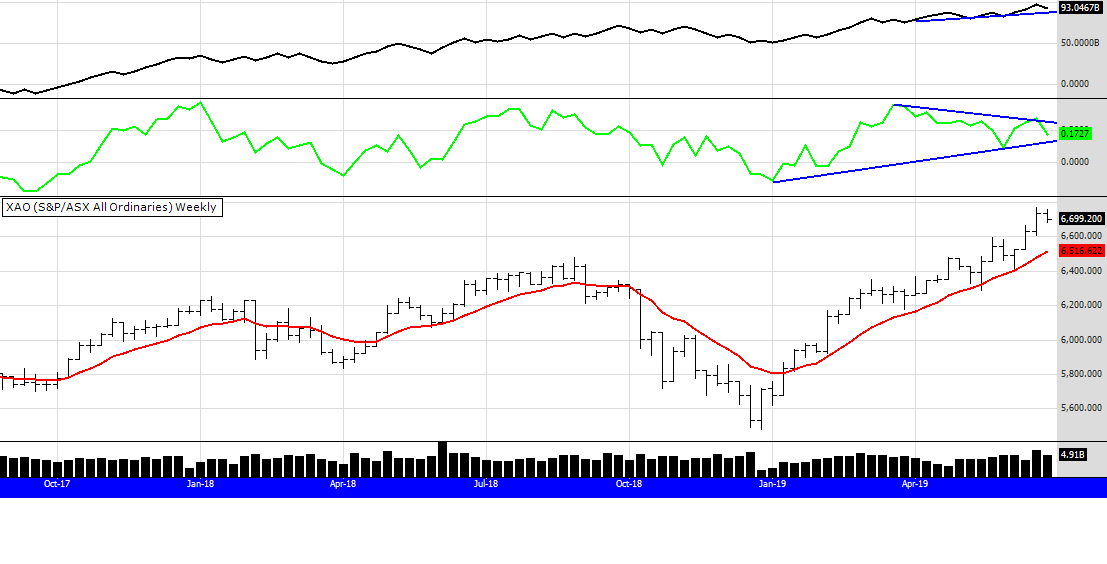
Some caution this week as the market took a breath. The trend is up and volumes are good. Despite seasonal factors being against the market (Sell in May and go away tradition) and the sabre rattling from the US and Iran, the market continues to defy the bears and continue up. This weekend marks the end of the Australian financial year, the end of the 2nd quarter in the US (globally too) and the end of the month. I would expect some re-arranging of portfolios next week as traders and investors attempt to position themselves to be in the best stocks and sectors. We don't care what they do, we have a system that is working well so why change it? See you next week and stay calm, stick to your chosen method.
MARKET COMMENTS: As of 21/6/19: (see charts below)

Well the eBook system continues to surprise even me! I knew it was a good system but boy its flying, up 5.6 % this week and outperfroming Peters Portfolio, maybe it's time for me to swap back to it :) It was helped along a lot this week by the gold stocks, goes to show you should just follow the signals as they come, the system will put you into the strongest stocks. The chart above of the XAO pulled back a little on Friday. My guess is because it is flirting with the old market high back in 2007 and the T.A. traders kicked in and sold the resistance point. There is now a divergence between price and volume, the CMF line is pointing down and the price up. But the OBV remains strong so its hard to say what it means. The price is well above the Bull filter line so one would "expect" a pull back or slow down, but I will repeat again what I said the last 2 weeks
" I think this market will surprise to the upside and there is a chance we will see a parabolic move up as we did during the tech boom of the late 1990's and the lead up to the GFC in 2006 and 2007. Lets hope we dont get the same ending. Its very interesting times and a great time to be in the market."
I also suggest you have a look at the property chart I posted in late May, scroll down to see it, the level is now 1643 up 2% from 1610.
MARKET COMMENTS: As of 14/6/19: (see charts below)
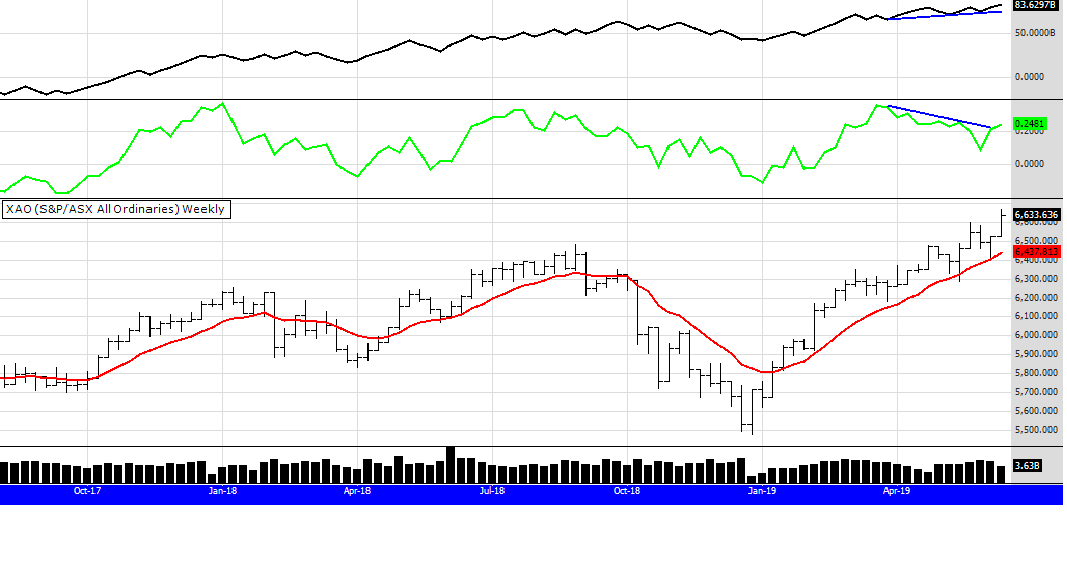
" I think this market will surprise to the upside and there is a chance we will see a parabolic move up as we did during the tech boom of the late 1990's and the lead up to the GFC in 2006 and 2007. Lets hope we dont get the same ending. Its very interesting times and a great time to be in the market."
Thats what I wrote last week and this weeks price action indicates the probability of that statement has merit. No predictions here.........but this market is STRONG. Some consolidation now would not surprise me, but I wouldn't count on it. Trade your signals and stick to your method. The ride may get fast and volatile so stay calm, dont screen watch and if you don't already do so, adopt some calming modalities like meditation, walking, exercise, writing....whatever grounds your thinking.
MARKET COMMENTS: As of 7/6/19: (see charts below)

A rebound in prices this week as the bull market continues. I think this market will surprise to the upside and there is a chance we will see a parabolic move up as we did during the tech boom of the late 1990's and the lead up to the GFC in 2006 and 2007. Lets hope we dont get the same ending. Its very interesting times and a great time to be in the market.
MARKET COMMENTS: As of 31/5/19: (see charts below)

Last week I mentioned the CMF was pointing down indicating volume was not aligned with price action. The CMF continued to fall and the price of the XAO fell, affected by some of the bigger stocks giving back some after the post election rally. However it didn't bother the eBook system as it rose 1.4% bucking the trend. Why? The eBook system, because of the 52 week closing high, only buys stocks trending up. Sector analysis looks after itself as weak sectors tend not to trigger 52 week highs. The chart above still looks ok, the OBV (slower moving volume indicator) is still trending up. In the U.S. the influential SP500 continues to pull back from its double top but until we get any sell signals, which we are not, then it's STICK TO THE SYSTEM. If you are having trouble sticking to your method either your method does not suit you or you have some mindset issues to investigate. Email me or give me a call, first consult is free.
MARKET COMMENTS: As of 24/5/19: (see charts below)

The XAO rose again this week as the Banks and Property sector went bananas after the LNP win. There are 2 volume indicators on the chart above, the OBV and the faster moving CMF. The CMF is showing a divergence to the price action. Now this could be a short term thing but it's worth watching cosidering the sudden jump in the dominant financial sector. Those of you that attended my seminars in Febuary and again last Sunday will remember the chart below. With the recent election, possible rate cuts, the property taxes off the table and the banks freeing up more money (apparently) the property market may be in for an upswing, the cycle certainly suggests it.

MARKET COMMENTS: As of 17/5/19: (see charts below)
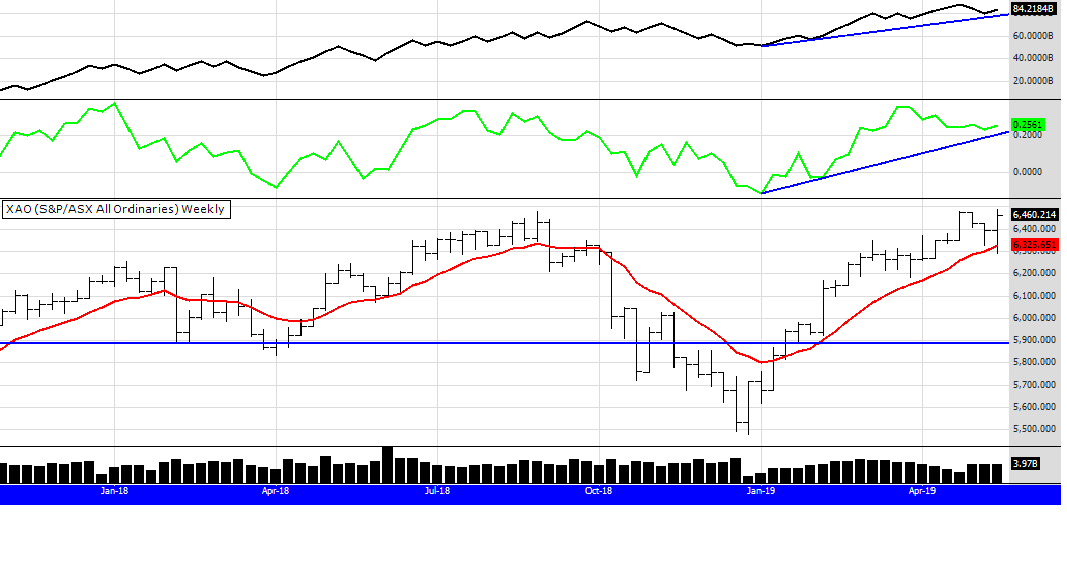
The market rallies from the short term sell off with good volume backing the move. The eBook system and Peters Portfolio put on nearly 4% each. A good week to be a trend trader. I will save any more comments for this Sunday at the seminar in Sydney. I am looking forward to meeting everyone and discussing this dynamic market we have at the moment.
MARKET COMMENTS: As of 10/5/19: (see charts below)

The markets threw us a curve ball this week with Trumps tweets. However the double top has many nervous and it was an excuse to sell. The faster moving 13 period CMF warned a few weeks ago volume was receding, but the OBV looks supportive. The bull filter is still well in play. The eBook system churns a few stocks this week as it follows its process, sell weak stocks buy stronger ones. Simple is it not?
MARKET COMMENTS: As of 3/5/19: (see charts below)

Big volume this week, it was a full weeks trading compared to last week and also the end of the month. The eBook rose again this week despite the index falling a little. I notice in the US on Friday night the Russel 2000 broke up out of consolidation. To me this indicates more rises to come particularly in the mid and small cap shares. Interesting times.
MARKET COMMENTS: As of 26/4/19: (see charts below)

Price crashes past the old highs in August 18, on the way to the all time high of 6873 set way back in 2007. When markets are running like this they confound most market analysts, the reason why the great trend trader Ed Seykota quipped many years ago "The trend is your friend until it bends at the end". I assure you this trend will bend sooner or later but until then we let the market decide when to sell, and the plan is to hold our positions and be grateful.
MARKET COMMENTS: As of 18/4/19: (see charts below)
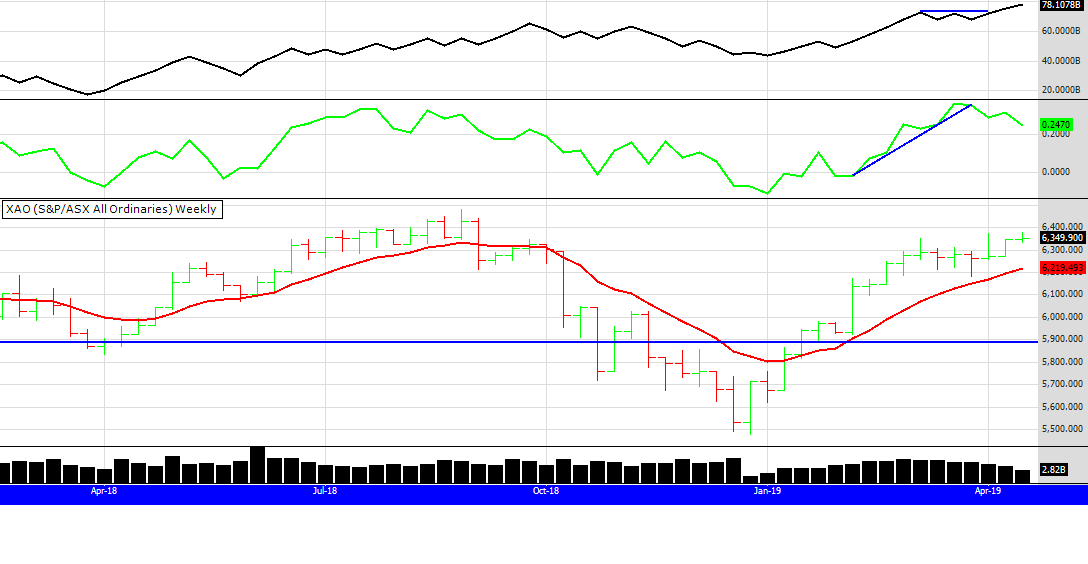
The Market rose again this week but volume is dropping and I notice some volatility in the smaller stocks and mid caps. After bagging the Gorilla stocks last week, this week they did well!......holding up the index. Traders and investors must be getting nervous as the index approaches the old highs in August 18. Many "expect" a sell off, it would seem probable, a pull back of some kind, however this market is strong and the US indicies continue to rise. The eBook system pulled back a little this week as its stocks has had a great run, so it took a breather. Volume is trending down signifying buyers could be drying up, for a while anyway, but really who knows with this market. Stay calm and stick to YOUR method.
MARKET COMMENTS: As of 12/4/19: (see charts below)
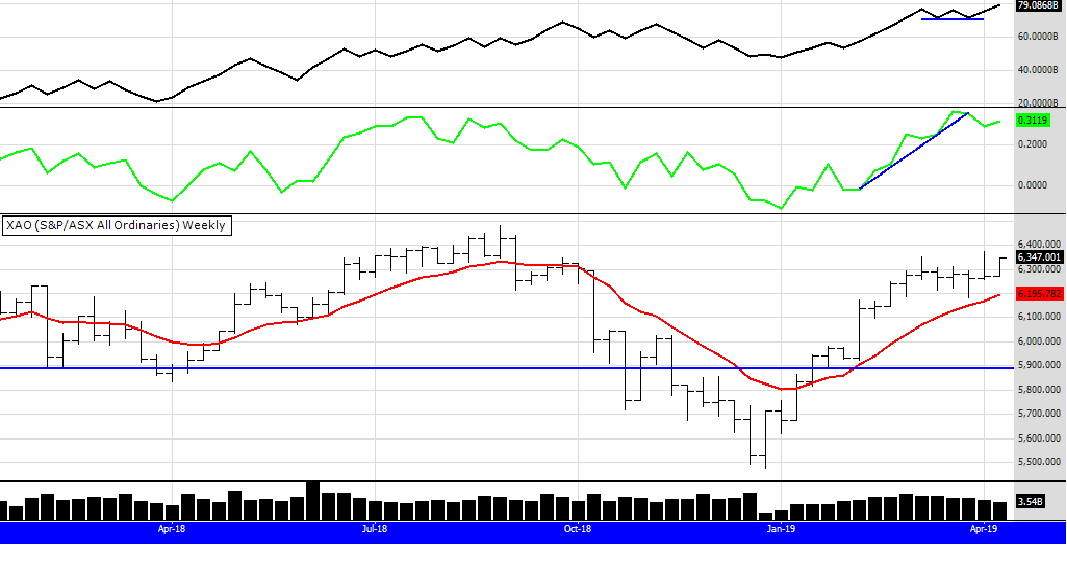
The market rises again this week. The eBook system had a great week rising nearly 5%. That's a lot and it surprises even me. Peters Portfolio in comparison notched up a measly 2.5% but it does not include this coming Mondays trading. As you can see the XAO didnt rise that much so why the big gains? Because big gains are not in Gorilla stocks like banks, the gains are in low priced stocks with growth prospects, exactly what the eBook system targets by buying 52 week highs. Peters Portfolio does a similar thing but is a little more conservative. Look at the chart below, the XNJ is the industrials sector. Along with this sector and others like Health and Technology, these sectors are driving the market, not banks and not many of the Gorilla mum and dad stocks of old.

MARKET COMMENTS: As of 5/4/19: (see charts below)

This weeks price action is arguably more negative than last weeks, however it was on small volume indicating sellers are not dominating. Volumes indicators are conflicting, the faster moving 13 period CMF is looking negative but the slower moving OBV is holding up. I was reminding myself this morning uptrends can last a lot longer than thought and surprise many, The US market continues to rise and we will follow despite the "expected" fall that may come here in the Aussie market. As hard as it is psychologically the best thing to do is stick to your system/method. Remember too the XAO is dominated by the financial sector, I encourage you to look at sectors like resources, health and particularly technology, where you will see more strength than what is displayed above. However investors mindset is often influenced by the overall market, the reason I display this chart with comments.
MARKET COMMENTS: As of 29/3/19: (see charts below)
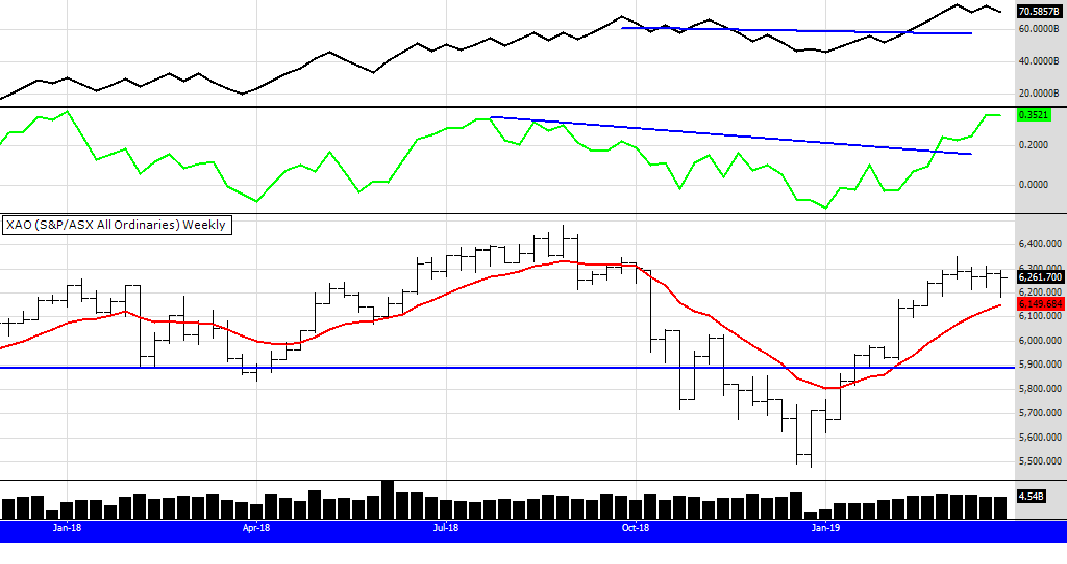
It was the most bearish week we have had since the recovery. The market fell below the lows of the last 3 bars, but it closed up quite strongly towards the end of the week. There is no warning sign yet from the volume indicators, one weeks price action does not make a downturn. At the moment (and that is all we have the present moment) the market is taking a breath. It's good to see because the more this market rallied up hard the greater the chance of a sell off to compensate. Trend traders hold your nerve.
MARKET COMMENTS: As of 22/3/19: (see charts below)

Another good week for the systems. The eBook rose around 1% and so did Peters Portfolio which will be posted on Mondays close. It's looking like a classic V shaped recovery on the chart above. I spoke to a few trading clients this week that have been doing very well the last few years, why? They stuck to their system. My mantra remains the same, the two reasons traders fail is they don't have a method, if they do have one they don't stick to it. The technical side of trading is easy, the mental side is hard, thats why you need a method that suits YOU, your objectives and personality. Developing that system for you is my job. Good luck next week.
MARKET COMMENTS: As of 15/3/19: (see charts below)

Everyone is waiting for a pullback but we may not get one until this market reaches the highs set in August 2018. Then we still may not get a pullback.........its why I always say prediction is so difficult. Remember always that this index is often governed by the dominant stocks of finance and resources, mid cap stocks can power along without really affecting the look of the XAO. The index fell a little this week but the eBook stocks continued to rise, as did Peters Potfolio which will be published after Mondays close. This market continues to look strong, volume indicators are not weakening and there were a good number of new 52 week closing highs this week. Last week there were only a few, suggesting things were slowing but this week shows strength again with more new signals. TLS being a notable signal.
MARKET COMMENTS: As of 8/3/19: (see charts below)

Is the market finally taking a pause? Not a lot of change this week. The OBV continues up but the CMF points a little down, price is flat. Next week will be interesting. Both the eBook system and Peters Portfolio had a good week rising 1.5%.
MARKET COMMENTS: As of 1/3/19: (see charts below)
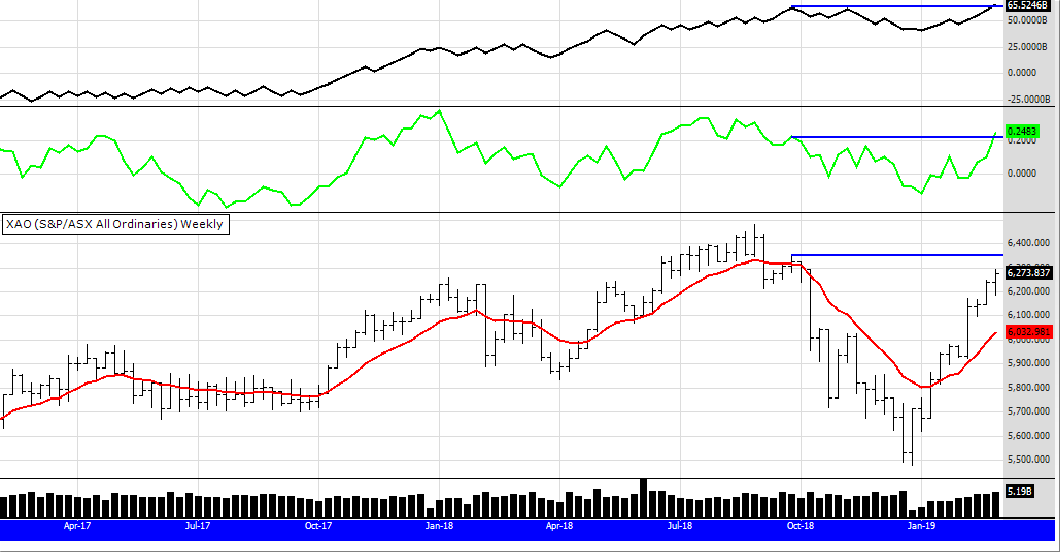
What a difference a week can make. I often say PRICE is the ultimate indicator. Even though the volumes were looking a little weak last week, price has continued up, with now a lot of volume supporting the upmove. In fact price now is chasing volume, both the OBV and the CMF suggesting the price will go higher as they outpace the price. We know in the US on Friday the market had a rally so we would "expect" (nothing is certain) the XAO to rise as well on Monday. The US 500 is hitting resistance. It needs to break through 3 old highs to continue on and looks over bought on the daily charts. (see chart of US 500 below) The weekly chart looks stronger. (not displayed)
I have made a change to when I publish Peters Portfolio. It will now be published Monday nights to show the stocks bought and sold on that day as the majority of my buying and selling is done on a Monday. Thank you to those that logged in on Thursday night to the webinar. I may have missed some of your questions whilst I focused on the presentation. If so feel free to email me if you have any questions about the content discussed.

MARKET COMMENTS: As of 22/2/19: (see charts below)
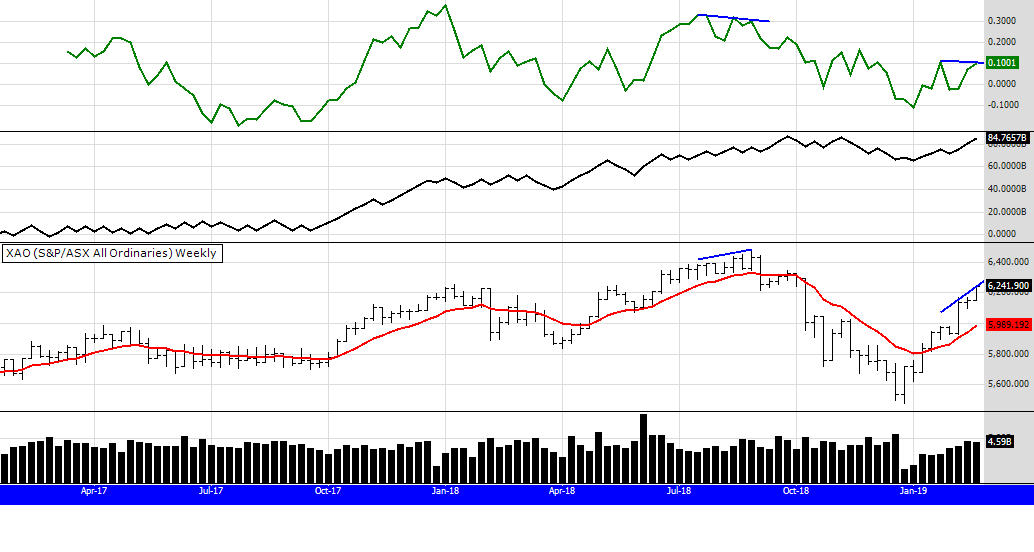 As most people following technical analysis will say, the market looks over bought. Many signals are flashing warning, perhaps not so much for a fall but a slow down at least. The confusing thing is that I have agressive momentum systems that are signalling to buy the market. The chart above shows a negative divergence on the CMF between price and volume, this does not mean to say the index will fall or crash, but it is an indication (and that's all indicators are, indications) that perhaps the bulls are becoming less commited after the recent big rally. It makes sense as markets do not rise in a straight line forever, but this market is strong and could go on to meet the highs made back in August 18 sooner than later. So what to do? As usual it comes down to following the method you have selected to suit your mindset and objectives. (if you don't have a method get one) The eBook system has had a stellar run since entering the market again 6 weeks ago, putting on almost 9% from its cash out lows. Going into March portfolios will now be supported with coming dividend payments. Will the index of the XAO looking overbought slow the strong trending stocks? I am not sure it will but time will tell.
MARKET COMMENTS: As of 15/2/19: (see charts below)

The index takes a breath. But its a misleading chart because its dominated by the financials which fell this week. Many stocks continue to rocket as is indicated by the rally in the eBook system this week as well as the good performance of Peters Portfolio, the small and mid cap system . For example look at the chart below of the materials sector, a sector without the financials. A much stronger looking chart and the volume indicators confirming the upmove. However we dont need to do sector analysis too much, the 52 week highs will tell us where the strength is. That's why you havn't seen a 52 week high in many banks because they lack strength. Trend trading is about buying strength and selling weakness. Simple.

MARKET COMMENTS: As of 8/2/19: (see charts below)
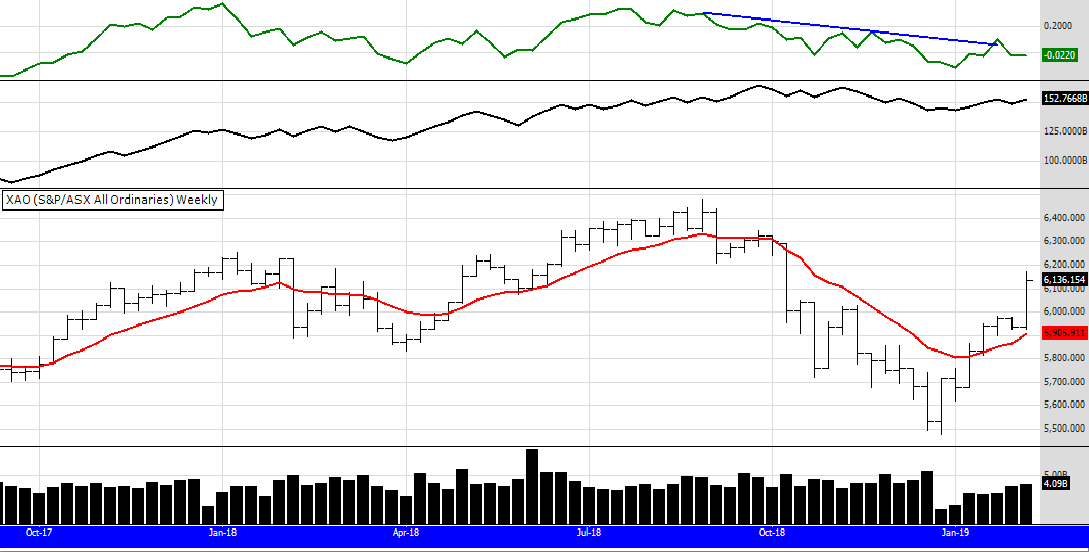
Well. It goes to show you should follow the trend. A big week and those that had the courage to buy a few weeks ago when the signals came are being rewarded. The OBV has kicked up but the CMF lags a little, a big volume bar though supports the bullish move up. I notice many comapnies are reporting strong results indicating the long term bull market has perhaps legs yet. Its been quite a recovery from the lows only 7 weeks ago indicating how oversold the market was. For many traders they will be feeling confused and frustrated as the fear of loss is replaced with the fear of missing out. If thats one of you I suggest you work on getting a good method...........and sticking to it.
MARKET COMMENTS: As of 1/2/19: (see charts below)
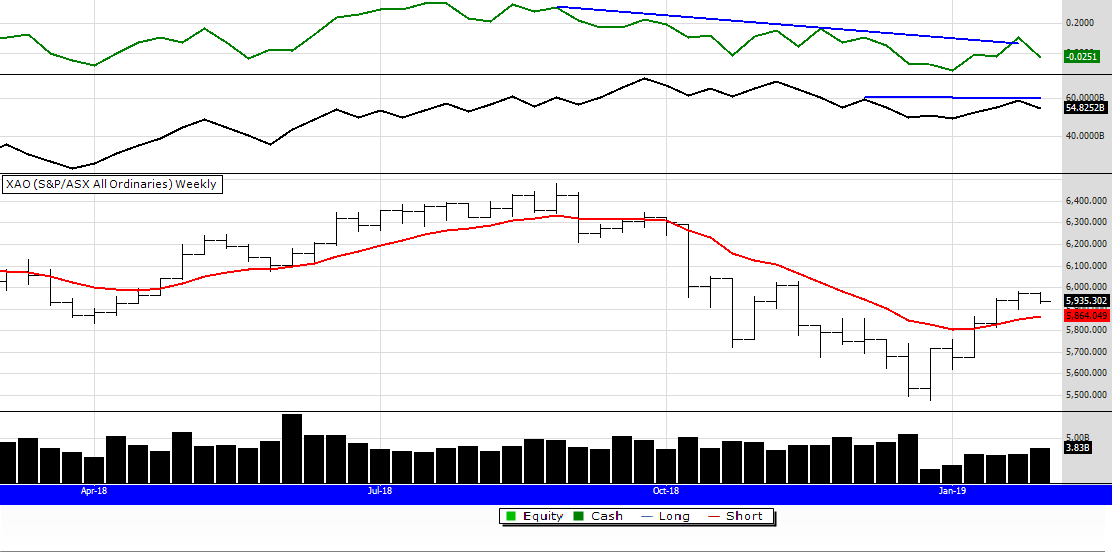
This week volume is up but price slightly down. To me (and each persons view is subjective) the chart above shows uncertainty and reserve. The US SP500 has now reached the 61.8 Fibonacci level of around 2700 points surpassing the 50% point. I have never been a fan of Fibonacci however many traders put great store in it perhaps making it a self fulfilling prophecy. The markets have had a strong rally off its lows, a pause, consolidation or drop back is due. However if this does happen, and it might not, this may not stop the strong trending stocks from still out performing, which of course is the whole idea of trend trading as we hopefully position ourselves in only those stocks that are rising.....and have a good probability of continuing to do so.
MARKET COMMENTS: As of 25/1/19: (see charts below)
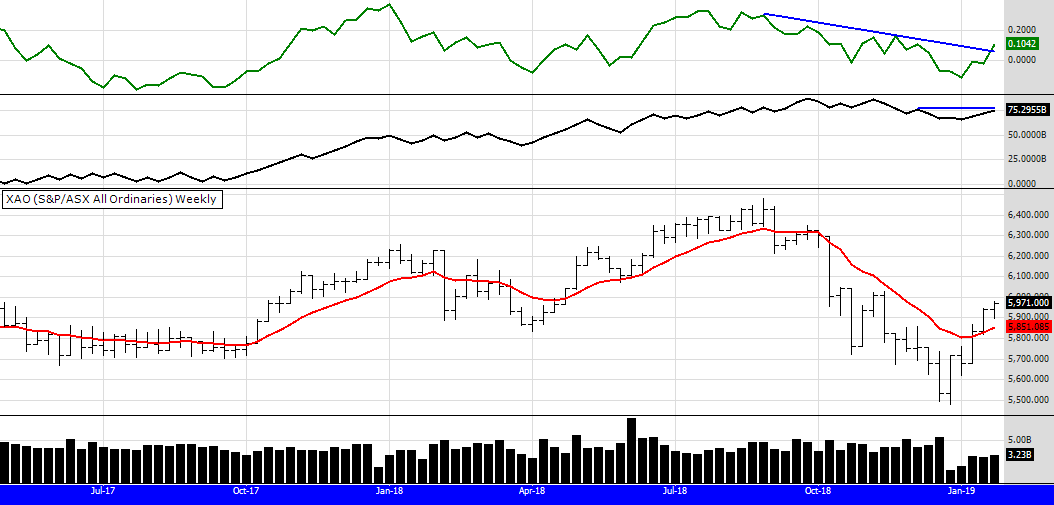
The recovery on the Aussie market continues. The US market did have a pause this week(but I write this with one more trading day to go in the U.S. for this week). Volume on the XAO has picked up, as can be seen by the volume bar plus the CMF has now broken its down trend line to the upside. However the OBV is not confirming the rally, still flatlining despite the price rising. Its not a big concern but an indication that buyesr are still cautious not convinced this is a recovery but a bear market rally. The eBook system will be all in next week, my own portfolio is flatlining as I wait for my systems mid cap bull filter to kick in, as it has not done so. The recovery is more in the top 300 so far. I have taken the time out to do some more testing and developing on monthly systems, and prepare for the Feb lecture at the ATAA in Sydney.
MARKET COMMENTS: As of 18/1/19: (see charts below)
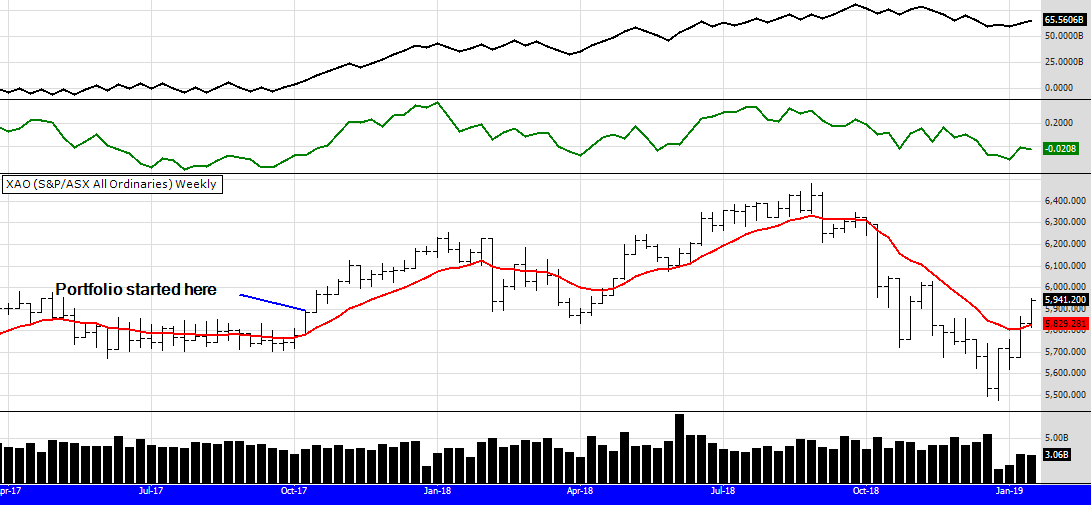
The XAO has another rally this week on lowish volume. Investors are cautiously buying back in although some stocks are rocketing as can be seen by looking at the charts of the 52 week high signals above. Looking at the US market (chart below of the SP500) one would think a pause would happen soon now that it has pulled back up over 50% from the low to the high. The problem is that's a subjective statement and no one knows what will happen.....however we do have probability to work with which is the best tool. The challenge with trading is following your system, experienced traders know that. So is this a recovery in a bull market or a bear market rally? I think it's the former and time will tell.
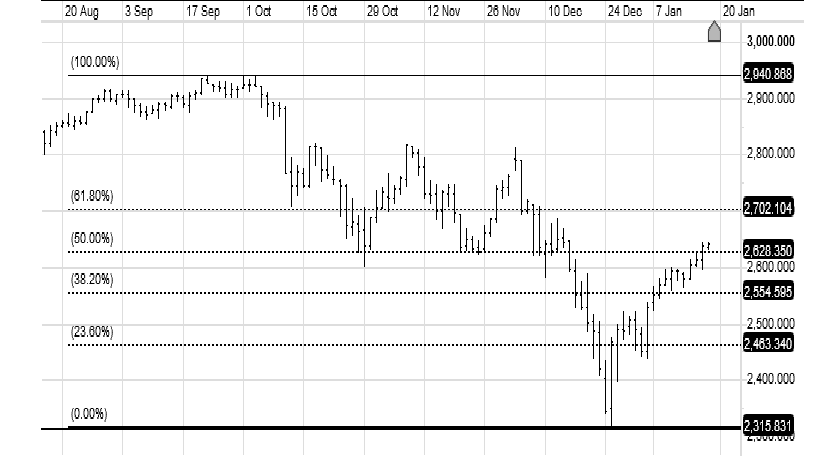
MARKET COMMENTS: As of 11/1/19: (see charts below)
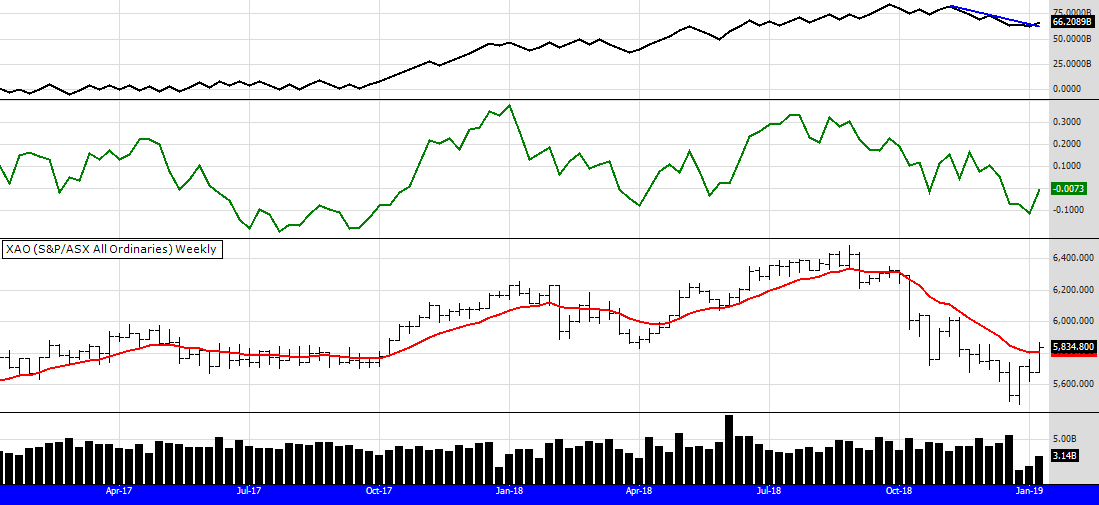
Ok. The rally I suggested last week has come and the eBook filter is in buy mode. I posted some extra comments about the eBook above this XAO chart, I suggest you read it if you have not done so. Volume is low this week. I am not sure if this is because some investors/traders are still in holiday mode or if there is another reason. OBV has broken a short term trendline to the upside but I wouldnt get too excited about that. The CMF looks postive but yet to break its downtrend line. Despite what we read into the chart above (and we will all see something different) the fact is the eBook system is saying buy. If you are following this method its challenging emotionally to buy after the pullback of the last few months. However if you have chosen to trade a mechanical system, its part of the commitment.
My system in Peters Portfolio trades a slower Bull filter. It has not yet given a signal to buy. Now...this is not because my system is "better" than the eBook. It's because I have been trading that filter for many years and I do not want to change it. Regular readers will know my philosophy of pick a system and stick to it!
MARKET COMMENTS: As of 4/1/19: (see charts below)
Post holiday trading returns to normal next week, the past 2 weeks have been reduced volume so price action could be regarded as less telling. A good week could put the XAO back in buy mode if it can cross above the eBook Bull filter moving average marked in red. The filter has kept many from buying for 14 weeks now, as the market goes through its correction. I seem to be the only one not calling this a bear market. Until long term trendlines are broken to the downside I still see this as a correction. Looking at a daily chart of the US market (posted below) I notice it has made a short term technical breakout to the upside, next week will be interesting, a big rally would not surprise me.
MARKET COMMENTS: As of 28/12/18: (see charts below)

The XAO fell to the 5500 area I had been talking about for weeks, in fact it hit 5478 as the low. Very low volumes because of the holiday break (only 3 days trading) but price action is significant. US markets bounced off long term monthly trend lines I talked about in my last newsletter. Click on the link below if you missed it. This may be the start of consolidation before the next rise, or it could be a pause in the falling. Its wait and see and let the market tell us what the future holds.
MARKET COMMENTS: As of 21/12/18: (see charts below)
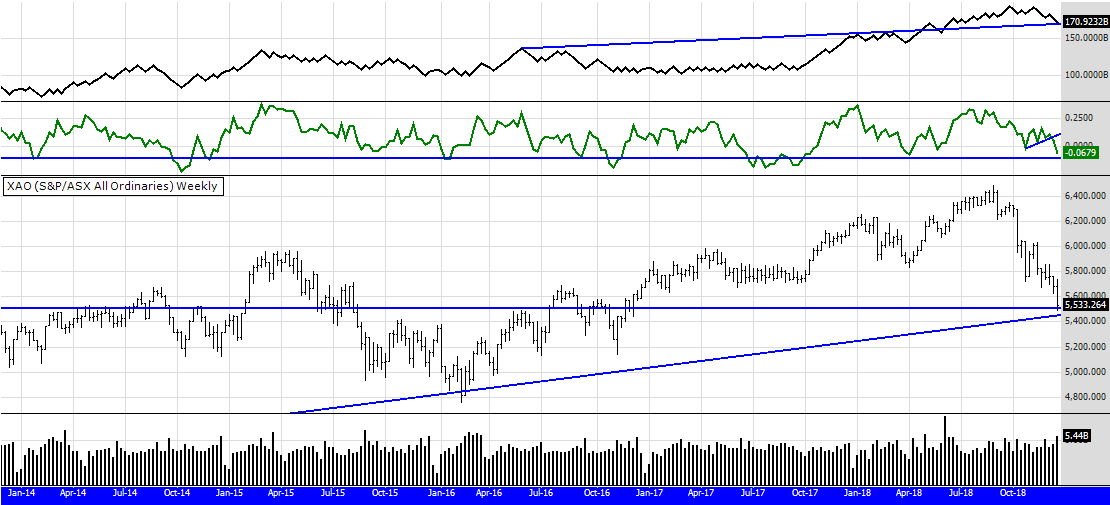
The XAO has reached the 5500 level I have been talking about for some time, US markets are on long term support lines too like our local market is. This market looks oversold to me, volumes still look supportive long term as shown by the trendline of the OBV. It has come back to the breakout area it had a few years ago. The breakout that started the euphoric stage that is now correcting. Try and remember (always) that markets are driven by emotion more than fundamentals or technicals. Attempt to detach from your pain and look at whats happening in a removed state of mind. You will see it all so much more clearly.
MARKET COMMENTS: As of 14/12/18: (see charts below)

The above chart was posted after 2 days trading of the week, so I posted in on the 19/12/18 before Wednesdays trading. However not a lot has changed from last week.
The market looks to be seeking the 5500 level particularly with US markets continuing to fall. Last weeks CMF indicator shown in the chart below
has now broken its short term trend line to the downside. Longer term the market looks well, we just have to sit out this correction.
MARKET COMMENTS: As of 7/12/18: (see charts below)

Not a lot has changed this week. Volume indicators have kicked up a little, this "feels" and looks like a bottoming process,
however with the continual falling of the US markets our market wont go anywhere. In fact we may visit 5500 sooner than later.
It might take this to exhaust the sellers. The chart below shows again the US500, its a daily chart so we cant read too much
into it. Fridays reversal of price now makes the chart look like it wants to fall more, despite volume indicators suggesting
support. Its wait and see.
MARKET COMMENTS: As of 30/11/18: (see charts below)

Volume picks up and the price falls a little. OBV verifies what I said last week, buyers are on the sidelines waiting. The 13
week CMF indicator looks stronger, its a slower moving indicator, however it does show good support in the longer term.
It would not surprise me to see the index reach down for the 5500 region, it may only be for a day or two but perhaps we
need to do that to exhaust the sellers. This is a correction, not a bear market. Once sellers are exhausted the
balance of power (emotion) will change to buying and the market will rally. The US market (see chart below) looks stronger
but thats been the trend for years. The Australian markets big 3 sectors, banking, resources and property all underperformed
this week.
MARKET COMMENTS: As of 23/11/18: (see charts below)

I have posted 3 charts this week, lets look at the one above first. A concern is the breakdown of the OBV trendline, even
though the 13 period CMF looks much more supportive. Its not a good sign that the OBV has broken down, it often indicates
more falls. Lets look at the 2nd chart.
Below you can see a longer term chart, I have drawn the longer term trend lines on it. There is long term support around
5500, this market could fall to that level before regaining the uptrend. We are not in a bear market, not yet, it would need
to fall below the trendline at 5400 for a bear market to really take hold. Scroll below for the 3rd chart.

I have posted again the US 500. Its a daily chart and you can clearly see the divergence between price and indicators,
although volume is not strong, its not weak either. Daily charts lead the weekly charts, and weekly charts lead the monthly,
so this positive looking daily chart could produce a strong performance next week in the US.
It appears to me there is indecision as if to buy this market or not. Whilst the indecision remains, downside out weighs the
upside.
MARKET COMMENTS: As of 16/11/18: (see charts below)

The market reverses this week after two up weeks. The volume indicators are hanging in there. The eBook system buy filter
is keeping traders of that system out of the market, which may prove to be the best strategy. Peters Portfolio continues to cash
up with another stock sold this week. This week I have posted below a chart of the US SP500. It's in a daily format and you
can see last nights trading (their Friday) shows an up bar with volume supporting the rise. The Australian market correlates
closely to this index and if it holds up ours should too.
MARKET COMMENTS: As of 9/11/18: (see charts below)

The market continues to recover from the sell off. I notice now market commentators are saying it was irrational and over
done, I didnt hear that 2 weeks ago! Ignore the news, trade your method. The volume indicators above are suggesting the
index has more to rise next week. Peters Portfolio had another strong recovery week. Two new 52 week highs in ASX 200
this week, a good sign confidence is returning.
MARKET COMMENTS: As of 2/11/18: (see charts below)

Well we got the bounce the volume and price indicators were suggesting. I have gone back to a weekly bar chart, it shows
this weeks price action more clearly than the line chart. I would have liked to have seen a stronger week, but considering
the Aussie market jumped out of the gates before the U.S. did, it was a good week. Peters Portfolio bounced even better,
it has more cash now in reserve, to either sit out further falls or buy into stocks as they trigger. I notice the rhetoric from
some market commentators is already changing, saying that things may be not be as bad as first thought. Ignore all talking
heads and trade your method. No one knows.
MARKET COMMENTS: As of 26/10/18: (see charts below)

So it's been a horrible 2 weeks (if you are long the market, great if you were short) let's look at a longer term chart first to
see if it is as bad as some people are thinking. The monthly chart above shows the long term price of the All Ords still trending
up, with the long term blue trend line still rising.
The two volume indicators the CMF (displayed in green and adjusted to a 3 month period to reflect the monthy scale)
and the OBV (in black) are showing a positive divergence, (price down but volume still holding up) It could verify what I said 2 weeks ago,
sellers seem non commited, now let's look at the weekly chart.

The price of the All Ords has come down to the blue horizontal resistance line. My experience is that horizontal resistance lines are
not as strong as trend lines, so it could fall below that line, but then it has the monthly up trend line to meet, as shown in
the monthly chart above. The CMF has been adjusted back to a 13 period, as it is normally displayed. Both weekly volume indicators reflect
what the monthly chart does, price falling but positive volume dvergence. There are 3 trading days left to the end of the month, to
me the probability of a rally outweighs the probability of more falls, but it's wait and see, we are not in the game of prediction, so the best
thing as always, is stick to YOUR plan.
MARKET COMMENTS: As of 19/10/18: (see charts below)

The XAO has a small bounce this week. Hopefully you have not been stopped out of too many positions. If you have,
they dont deserve to be in your portfolio. I am having server problems, some of you may not have received my newsletter
last week, click on the link from last weeks comments below, to access it.
MARKET COMMENTS: As of 12/10/18: (see charts below)

Tonight I sent a newsletter, you can read it here.
The market has price and volume sitting on support. For those that believe in the Bull market its a great time to buy. Those
volume indicators above on the chart look very strong, this could be the correction we had to have before the next rally.
Peters Portfolio, like everyones got smacked this week, down around 4.5%. However only one stock is giving a sell signal which
is a good sign. I notice Nick Radge put an email out today too, saying his portfolios were down between 8 and 14 %, there is
always someone worse off than yourself! Last week the Bull filter worked a treat, not allowing any buying before the big fall.
MARKET COMMENTS: As of 5/10/18: (see charts below)


The XAO continues to flounder a little. The eBook system filter wanting us to wait. 52 week highs are mainly in the resource stocks,
reflected in the 2nd chart above of the XJR. Those not using a bull filter can buy, those that are wont. It's important to make your
decision about filters and stick to it. Sometimes bull filters make you miss a trade, but they can also save your backside if the market
turns south quickly.
MARKET COMMENTS: As of 28/9/18: (see charts below)

The market recovers slowly. The bull filter is in positive mode. Volumes look to be confirming the trend. Nothing more to
say except follow your method. If you don't have a method, seriously consider getting one. The last 4 weeks were a testing time for some,
particularly those without solid rules. Peter's Portfolio rose a little, around 0.4%, it will be posted on the site in a day or two.
It's up 20.5% in 11 months, which is line with the back testing. It's always heartening to see portfolios perform in line with the testing.
Not all portfolios perform in line with back testing, mainly because of the different start dates. Two traders using the same system will often
get different results, as their portfolios differ. This is a good thing, as if everyone had the same start date, and so the same stocks, they
would be competing for the same buys and sells, limiting opportunity. Whatever system you trade it takes patience and discipline.
Keep good records, execute the process to the best of your ability. Until next week. Peter.
MARKET COMMENTS: As of 21/9/18: (see charts below)

Volumes are back and price rises. The OBV looks very strong, the CMF still a little weak. The eBook system is still waiting to buy,
next week may bring confirmation of what to do, wait more or buy. In the mean time most stocks are holding. No trades this
week for Peters Portfolio and there will be none next week either, which is great, it means stocks are trending and nothing to
do except let the process take care of itself. Stick to the system. Peters Portfolio rose almost 1% this week as the market
rose 0.4%.
MARKET COMMENTS: As of 14/9/18: (see charts below)

The XAO has a quiet week. Volumes are low. The OBV is holding up well and the CMF volume indicator (13 week
period) while looking bad is just confirming what we know. Price and volume have fallen. The bull filter for the eBook
system is still saying step aside and wait. Very few new 52 week highs this week as the market rally takes a breather.
Peters Portfolio had a good week, making a new equity high and rising around 2.5% helped along by some dividends.
MARKET COMMENTS: As of 7/9/18: (see charts below)

The XAO fell this week, below the eBook Bull filter, so its stand aside for those using that method. Volume support remains
with both the OBV and the CMF (13 period) holding up. Looking at the chart above the recent sell off looks like its overdone,
a panic on low volume. However we are not in the game of predicting but responding, so dont second guess the market. As I
always say, trade your method and be as detached as possible. Next week will be interesting. Peters Portfolio held up very well
this week, a main contributor being NST with its merger announcement.
MARKET COMMENTS: As of 31/8/18: (see charts below)


This week its the Mid Caps that rallied. As I said last week the market seems strong across the board. Trade your system.
Stick to the rules, get out of way, and let the market and your method do its thing!
MARKET COMMENTS: As of 24/8/18: (see charts below)


This week was another indication of how the XAO can be a deceiving index as to what's really going on in the market.
I have posted 2 charts this week, the usual XAO and also the Small Ords, which you can see had a big week. There are
19 stocks this week in the top 500 making a new closing 52 week high, thats a lot, indicating the breadth of this market.
Breadth meaning the market is strong across the board, not just the top 10 that dominates the XAO index. Peters Portfolio
had a strong week, a benefit of the fact it is dominated by small and mid caps with good fundamentals.
MARKET COMMENTS: As of 17/8/18: (see chart below)

The index breaks up and out of its 5 week consolidation, read last weeks commennts and also the comments I made going back
a few weeks. The market looks strong again, indicated by a large number of 52 week highs (12 in the top 500) this week.
MARKET COMMENTS: As of 10/8/18: (see chart below)

The All Ords continues to track sideways. This was the 5th week that the index found resistance around the 6400 area.
The OBV indicator is suggesting higher prices, the CMF appears positive too. The strategy is trade your system and be patient.
Higher prices will come, this is a traditional slow time of year before the market often rallies into Xmas.
MARKET COMMENTS: As of 3/8/18: (see chart below)

The market backs off a little this week but its not telling us much. Stick to the system is the best option.
MARKET COMMENTS: As of 27/7/18: (see chart below)

The big picture I mentioned last week dominates. Volume picks up and the market rallies. There is no short term sign of
weakness. The old market highs pre GFC are really not that far away (around 470 points or a little over 7% away).
We could be there by Christmas.
MARKET COMMENTS: As of 20/7/18: (see chart below)

Price continues to push higher but volume is decreasing, the same pattern as the last few weeks. Its wait and see what
happens over the next few weeks. The big picture looks strong, the monthly chart below shows a healthy trend channel
and large volume coming into the market in May and June.

MARKET COMMENTS: As of 13/7/18: (see chart below)

The XAO continues to rise, but there is now a divergence betwen price and volume. Volume is weakening suggesting buyers are
tapped out. Also there is only one new 52 week closing high in the alerts this week, indicating weakness. A pullback or at least consolidation
looks probable.
Peters portfolio managed a small rise this week because some stocks rallied well, but others are falling. Interesting times. I suggested
last week the market was churning, money is being re alloctaed and my portfolio is certainly showing that. One of the good things about
buying 52 week highs is that the strategy normally puts you where the money is going, without having to think about it. It will be
interesting to see what stocks and sectors start to trigger in the coming weeks and months as the churning subsides and decisions are
made.
MARKET COMMENTS: As of 6/7/18: (see chart below)

The XAO goes higher but with less volume. Not all stocks are rising, it seems there is some churning happening. Money being
relocated into other sectors. Peters Portfolio got whacked again this week with the fall in ELD.
MARKET COMMENTS: As of 29/6/18: (see chart below)

Prices and volume recede a little this week, the XAO seems to be getting help from the falling Aussie dollar, as the market
has been resilient to falls on overseas indices. One would expect more consolidation, but it is dangerous to expect or
predict. The trend is strong and up. Peters Portfolio suffered a little this week due to falls in HSN, any stock not perfroming
fundamentally well is punished and MTS and HSN are recent victims.
MARKET COMMENTS: As of 22/6/18: (see chart below)

Well when I said last week the high in January looks to be taken out soon......I didnt think it would be this week. Goes to show
what I always say, no one can predict. The best we have is probability. This market has been rising, even when it was dipping it
never lost volume support, so probability of more rises was greater than the probability of market falls. Re read my comments below
on the 20/4/18 and the 4/5/18, and learn to read the OBV filter, it will tell you more than any analyst or market commentator. The CMF
looks in over bought territory, but it doesnt mean the price will fall, its just letting us know volume is high, and we knew that didnt we?
MARKET COMMENTS: As of 15/6/18: (see chart below)

The market continues to rise. More volume chimes in. The high in January looks like it could be over taken sometime soon,
Peters Portfolio had a good week rising over 2 percent.
MARKET COMMENTS: As of 8/6/18: (see chart below)

The XAO bounced off volume support with prices following, huge volume last week, I dont know why, I suspect a corporate
action. If anyone knows please email me. Looking at the chart above it seems primed for more upward price action. I notice in
the U.S. the Russell and the Nasdaq are now in all time, new high territory, the Dow and the SP500 are catching up. Those that
shorted the markets a few months ago must be hurting. Peters Portfolio managed a small rise this week, but was negatively
impacted by the fall in MTS.
MARKET COMMENTS: As of 1/6/18: (see chart below)

The market has pulled back a little in the last 3 weeks since I have been away on holidays. Volume indicators are on support,
the medium term trend line that the eBook system uses is still in tact. The market looks like it needs more consolidation
before the next upthrust, of course that doesnt mean to say individual stocks will languish, some will rally and others wont,
thats trend trading. Peters Portfolio managed a small rise despite the Index falling.
MARKET COMMENTS: As of 11/5/18: (see chart below)

We have now had 6 weeks of recovery, volumes are high, the price is double topping, but I would not be brave enough
to call a slow down. In the U.S. the mid cap index of the Russell 2000 and the Nasdaq are threatening to break to new highs
while the SP500 and the Dow drag behind. In Australia the Mid Cap 50 index has already made a new high, is it leading the
way for other indexes? See chart below. The distribution from big caps to mid caps continues, not just here in Australia
but it seems overseas as well. Perhaps the Dow is no longer the most logical market barometer with other indexes now
leading the market.

MARKET COMMENTS: As of 4/5/18: (see chart below)
Rising price, rising volume, the CMF (13 period) the only non conformer. This is a very strong market, I suppose some
resistance will happen around 6230 (the last highest close) as the technical traders sell, but I wouldnt like to be shorting
this beast at the moment. Peters Portfolio bounced back up this week by 3% while the eBook system put in a stellar 4%
rise, some more, some less, depending on each traders holdings.

MARKET COMMENTS: As of 27/4/18: (see chart below)
I suggest you read the last 2 weeks comments, nothing has changed except the eBook system is back in buy mode.
The bull is back, so we go with the flow and follow our systems.

MARKET COMMENTS: As of 20/4/18: (see chart below)
In the chart below I have changed the CMF indicator to a 13 period, to reflect the markets quarterly calendar oscillations.
I like the CMF indicator but it does seem difficult to find the best time period. Perhaps thats why the OBV is possibly more
relaible, as it does not depend on time. Anyway, the market is improving and recovering from the recent sell off, a theme
I have repeatedly commented on the past few weeks and months. The Bull seems in tact, the OBV has made a new high
suggesting the price will follow. Next week the eBook system Bull filter will probably allow buying of new signals, other systems
with shorter term filters or that use filters on other indexes apart from the AllOrds, are already buying.

MARKET COMMENTS: As of 13/4/18: (see chart below)
Huge volume this week, one of the biggest volume weeks in the last year, and the market price rises. One weeks price action
does not make a trend, or a recovery rally or anything really, but it is a sign the buyers dominated last week, despite much
negative rhetoric by some market commentators. It will be an interesting week this one to see if the momentum can be maintained.

MARKET COMMENTS: As of 6/4/18: (see chart below)
Very little change this week. Another low volume week because of the Easter break.
The price is below the medium term moving average, indicating a wait and see approach. The CMF on the chart below has been changed
back to its usual 24 week period. Re read last weeks comments.

MARKET COMMENTS: As of 29/3/18: (see chart below)

Its obvious the trend line starting in Oct 17 has broken. My bull filter systems are saying wait and do not buy, but many stocks
are holding up well. I only have one sell in my portfolio this week. Volumes do not support a melt down. I have changed the
parameters of the Chaiken Money Flow indicator to a 6 period (6 weeks) you can see it is sitting on support. The OBV has
not fallen like the price has, until the volumes support the price action I think this is a pull back not a major correction.
Price is still the ultimate indicator, so its wait and see. Trade your system.
Looking at the monthly chart below....now that we have completed the first quarter of trading for the year......you can see
volume (OBV) and price are in tact and trending well.

MARKET COMMENTS: As of 23/3/18: (see chart below)

Lets look at the XAO in a simple line chart, the price trend line has broken, most bull filters are saying do not buy, hold positions,
only sell trades that are giving a sell signal. Looking at the volume indictors above, they do not support the sell bias but show
support. Last weeks volume was the lowest in 8 weeks, in my opinion sellers are not committed, our system says wait,
so we do. Waiting is a valid strategy, it is not doing nothing.
MARKET COMMENTS: As of 16/3/18: (see chart below)

The market goes sideways this week. More consolidation it seems.
MARKET COMMENTS: As of 9/3/18: (see chart below)

I might as well just repeat what I have been saying for the last few weeks. This market is strong, a lot stronger than what
some others think. Charts dont lie, our minds get in the way and create negative thoughts from fear. The above chart indicates
more upward prices next week.
MARKET COMMENTS: As of 2/3/18: (see chart below)

Despite last weeks pull back the chart of the XAO looks strong. Volume indicators remain in tact showing upward momentum.
There is a lot of fear in the market at the moment. We probably need a few weeks of sideways movement so the minds of
traders can settle and regather, before we see the uptrend start again. This major trend is in place, and as hard as it may be to keep
riding it, it is still the best option rather then selling out completely, as some people are doing or suggesting.
MARKET COMMENTS: As of 23/2/18: (see chart below)

The chart last week suggested higher prices, and thats what we got. Volume indicators on this chart look very strong, suggesting
the recovery rally after the recent sell off, has more to go. Also in the ASX 200 there were 7 new 52 week highs for the simple
weekly trend trading system I talk about on this website, a strong indicator that buyers are back!
MARKET COMMENTS: As of 16/2/18: (see chart below)

The market recovered a little this week, respecting the price trend line and the volume support lines. This is still a healthy looking
price chart, the medium term trend still in place. Strong volume indicators suggest higher prices to come. The market
often rallies into May, so we could still have 3 months of strong upward price action before the next slow down or pull back.
MARKET COMMENTS: As of 9/2/18: (see chart below)

Well what a week. As you can see from the chart above, price is on trendline support and volume indicators are holding up well.
I will borrow a famous quote from an ex prime minister, it was the correction we had to have. The US market was over heated
and it wasnt going to take much for it to sell off. I see this sell off as a typical pull back in a stage 3 bull market. Its a great buying
opportunity for short term traders, the next few weeks will be interesting.
MARKET COMMENTS: As of 2/2/18: (see chart below)
The market rallies on good volume, I still feel we are consolidating, maybe even pulling back a little, before the next rally up.
But the systems are still buying and holding trending trades, its been a good time to be a trend trader the last 8 months.

MARKET COMMENTS: As of 25/1/18: (see chart below)
Interesting chart. One volume indicator is positive one is not so. It seems the consolidation I suggested last week may be occurring.
The index recovers this week, low volumes are because of the 4 day trading week, due to the Australia day holiday.

MARKET COMMENTS: As of 19/1/18: (see chart below)
Prices fell. Last weeks chart gave us warning. However the index stays above the medium term moving average and
the CMF indicator holds up, suggesting some consolidation may happen this week.

MARKET COMMENTS: As of 12/1/18: (see chart below)
The 3 month long rally may be tiring, the upward momentum of the volume indicators is slowing. Not
many new 52 week highs this week. Buyers can only maintain their enthusiasm for so long before they
back off, for prices to keep going up buyers need to remain committed, or prices go sideways or fall.
We may get some sector rotation now, as traders look for the best place to be, is it resources?

MARKET COMMENTS: As of 5/1/18: (see chart below)
The rally continues. more volume this week with a 4 day trading week. Peters Portfolio (s) performed ok, go
to the portfolio page for details.

MARKET COMMENTS: As of 29/12/18: (see chart below)
low volumes and price action this week because of the three day trading week, next week may be similar,
although we do have a 4 day trading week. My two portfolios went sideways this week.

MARKET COMMENTS: As of 22/12/17: (see chart below)
As the volumes of the last few weeks have been suggesting, the market continues to rise putting on another 80 points, or
around 1.3 %.

MARKET COMMENTS: As of 15/12/17: (see chart below)
THIS WEEKS CHART LOOKS THE SAME AS LAST WEEK, BIG VOLUMES, SIDEWAYS PRICE.
MY PORTFOLIO WENT SIDEWAYS AGAIN THIS WEEK, HOWEVER VOLUMES SUGGEST HIGHER PRICES ARE COMING.

MARKET COMMENTS: As of 8/12/17: (see chart below)
Hardly a change from last week, except volumes look stronger.

MARKET COMMENTS: As of 1/12/17: (see chart below)
The rally continues but slows. However the OBV indicator is outperforming the price suggesting more upward price action
is to come. Notice too the high volume bar this week, as buyers and sellers compete in their feelings about what will happen
next.

MARKET COMMENTS: As of 24/11/17: (see chart below)
Observing the weekly bar chart below the rally continues, its follow the trend at the moment until our systems tell us otherwise.

MARKET COMMENTS: As of 17/11/17: (see chart below)
The rally slows but strength remains. A few less 52 week highs this week, indicating the buyers are sated, as is indicated
by the small pullback in the index. I wrote a news letter this week giving more detail, if you did not receive it re subsribe
or go to the newsletter archives to read my recent comments.

MARKET COMMENTS: As of 10/11/17: (see chart below)
The Aussie market continues to play catch up to the US markets. The breakout from consolidation becoming more obvious
every week. Volume indicators continue to confirm the rally. You may like to revisit a news letter I wrote in April, before my
study break, nothing has changed, if anything the analysis I made back then has ramped up. Click on the link below.

MARKET COMMENTS: As of 03/11/17: (see chart below)
Keeping things simple with a line chart, its clear to see the strength of the XAO. Its a 2.5 year breakout to the upside,
volume supports the move up. As I said last week, sometimes markets wait for no one, as has been the case this week with
the index continuing to rise. Another 12 new 52 week highs this week in the top 500. If the US market does not fall over
a big rally into Xmas is possible, as mentioned in last weeks comments. Also look at the monthly chart I have posted, there is a
beautiful Zen saying "if it is not necessary to do anything, it is necesssary to do nothing", so look at the chart,
I dont need to say anything.


MARKET COMMENTS: As of 27/10/17: (see chart below)
The market pauses this week but volumes remain upward. Now one would "expect" a pause at these levels but this market
is strong and it may not wait for anyone. Another 10 new 52 week highs in the ASX 200 this week, indicating buyers are
far outweighing sellers. We have just 2 more days of trading before the end of the month, it will be interesting to see how
the monthly chart looks then, institutions drive the market, so will they buy more or back off before the end of the month?
We may get 2 volatile days, other reasons will be given, but it will mostly be caused by the big money adjusting portfolios
as they postion for the probability of a strong rally into Christmas. Last calendar year the market rose 14%, if it does it
again this year it will rise to around 6500 points, leaving a 500+ point rally till end of year, who knows.

MARKET COMMENTS: As of 20/10/17: (see chart below)
Price, its the ultimate boss in trading, you can speculate and analyse all you want, using volumes, trend lines, indicators, cycles
etc., but at the end of all the gnashing of teeth, hope and worry, price tells all. This week I have posted a simple line chart to remove
the noise our minds create when looking at more detailed charts. Price has broken up past old resistance, 17 new 52 week highs
this week, this market is behaving like the release of a coiled spring, held down for months of consolidation. Once 6000 points
consolidates the next target is 6800, the old highs of the pre GFC......see the 2nd chart this week which is a monthly with adjusted volume
indicators.


MARKET COMMENTS: As of 13/10/17: (see chart below)
Take off! the market comes to its senses with small and mid caps leading the way, as can be seen above with most new highs in the 300 to 500 sector. A few clients have emailed and rung, saying their portfolios have rallied well the last month, patience for sticking out the grind of the long sideways period being rewarded, the only consistent clue to this rally coming was that the OBV never really dropped off, or flashed big selling volume, as I mentioned 3 weeks ago.
I am back in the market after a very enjoyable break, when I finish loading I will post the portfolio. 
MARKET COMMENTS: As of 6/10/17: (see chart below)
Is the consoidation period in the XAO coming to an end?
The price closes above the medium term EMA. The most impressive volume indicator of the three below is the CMF as it looks to break its 24 week downtrend line. The OBV and the volume bar chart still look lacklustre.
However my momentum systems are saying buy, with many new signals this week. Small and medium cap stocks again begin to move up, leaving their gorilla counterparts (the top 20) behind, as can be seen in the the 2nd chart posted this week of the XSO (Small Ords). The probability this week is a pause inthe rally. Dont expect it, have no expectations, trade your system.


MARKET COMMENTS: As of 29/9/17: (see chart below)
The market continues to go sideways to down, but volumes are low suggesting sellers are not committed. OBV shows upward momentum, suggesting too that there is underlying strength. October is often an upward month. 
MARKET COMMENTS: As of 22/9/17: (see chart below)
The market continues its bearish look, its still a sideways market, not a sell off, the bull filter keeps us out of the market. The old saying "if the market doesnt shake you out it will wear you out" is certainly apt at the moment.
MARKET COMMENTS: As of 15/9/17: (see chart below)
This sideways pattern in the XAO has now continued for 18 weeks, I have been trading for over 20 years and I dont recall a pattern like this, goes to show (again) how markets are unpredictable. The weekly close on the last bar on this chart looks bearish, but one bar does not make a trend or pattern. Volumes indicators are alittle conflicting, with OBV up but CMF down, indicating sellers dominate. Its a weak time of year, September is often bearish, the bull filter is saying wait, which means dont buy but hold positions until stopped. Simple techinically, difficult emotionally. Stay strong. 
MARKET COMMENTS: As of 8/9/17: (see chart below)
Regular readers will notice I missed last week, apologies for that. This market continues to experience a long sideways move. Volumes as you can see from the chart are on support. September can be a weak month and with whats been happening OS the US market could sell off and we will probably follow. However in our market the battle of the heavyweights continues with resources up and banks down, until we get those 2 sectors going in the same direction
the sideways look of the XAO will continue. 
MARKET COMMENTS: As of 25/8/17: (see chart below)
There are 2 charts below, a weekly bar chart and a monthly line chart, the monthly is displayed in its line format to remove the "noise" we often read into trends. Volume indicators on the monthly chart have been adjusted to suit the longer time frame. The trend is a grinding slow one, but the main thing to notice is, its up. Looking at that monthly chart it seems set to continue, despite the chop the weekly chart has provided the last few months. The OBV on the monthly chart is particularly impressive, will the price catch up to the indicator soon?


MARKET COMMENTS: As of 18/8/17: (see chart below)
OK, now its getting interesting. Despite the doom and gloomers, the overseas political rhetoric (just dont listen to it because no one knows what is truth and what isn't) and our local political garbage, the market hasn't crashed.
The big 4 banks, Telstra and other "Mum and Dad" stocks are struggling, but many small and mid cap stocks are not. Look at the number of 52 week highs, particularly outside the top 200. The make up of the index is changing, money is flowing from large caps to medium, which in time will become large caps. The XAO index is still dominated by the big 4, BHP, Telstra and the performance of those stocks reflects on the index. To prove my point, look at the Mid Caps chart below this chart of the XAO, and how much stronger it has been of late. I can't wait for the day our market has a more balanced index, but until then we need to keep looking behind the scenes to get the real story, which isn't as bad as we are often led to believe. Be that from our own fear, or those of others.

MARKET COMMENTS: As of 11/8/17: (see chart below)
This is now the 13th week, except one, that the XAO has closed below the medium term trend line in the chart below. This time of year can be seasonally weak, the market looks to sell and it got a reason with Trumps speech about Nth Korea. This market is not rising, but it has not broken down either.
Trending stocks with good fundamentals still exist, as a trend trader they are the ones to be in, but in the mean timemarket filters keep the money safe while we wait out this sideways period.

MARKET COMMENTS: As of 4/8/17: (see chart below)
The chaiken money flow chart has broken below the trendline, and the ON Balance Volume indicator rises. Investor trepidation continues and volumes are up and down and prices sideways, the XAO price closes below the medium term trend line. Some stocks have clear up trends, trading is a matter of risk control (trade sizing) and taking buy and sell signals until the market trends strongly again, which could happen at any time.
MARKET COMMENTS: As of 28/7/17: (see chart below)
What can I say but its more of the same, the volatility between banks and miners dominate this market, resulting in a sideways movement. No real trend in either sector so no trend in the XAO. Some mid size and small stocks are trending, but the market is nervous, expects a sell off, which may or may not happen, so that mindset affects the broader market. Volume indicators look threatening, are they on support or are they at breakdown point? It all depends on ones perspective. Its times like this the best thing to do is follow your rules.
This chart below shows two volume indicators, the On Balance Volume and the Chaiken Money Flow (displayed in green) using a 24 period format.
MARKET COMMENTS: As of 21/7/17: (see chart below)
More sideways movement from the market. Volume stll looks supportive of higher prices. 
MARKET COMMENTS: As of 14/7/17: (see chart below)
The market goes up this week, closing above the medium term moving average trend line. This is a buy signal for a lot of weekly trend trading systems, depending on what filter (if any) you use.
In this case its been an effective tool, keeping the trader out of the market during 8 weeks of sideways movement in the XAO.

MARKET COMMENTS AS OF 7/7/17
Same Same but different? Volume support remains, price still tracking sideways.
Bull filters stopping many trend trading systems from buying. More waiting seems the best strategy.

MARKET COMMENTS AS OF 30/6/17
The chart of the All Ords this week looks very similar to last week, volume rising but the price action is flat.
Lots of buying and selling but no conviction on direction. With the US market looking overbought, if it falls our market normally follows.
Not many new highs this week indicating the market is resting and waiting.


MARKET COMMENTS 23/6/17
After the big rally last week the market fades a little. Volume support remains but the price in the medium term is trending down. A trader should not expect anything, but the probability looks to me of more sideways movement until the price behaves as the volume suggests, up.
The WEEKLY chart above shows 2 volume indicators. The Chaiken Money Flow (24 period and in dark green) and the On Balance Volume (in black)
MARKET COMMENTS 16/6/17:
Well what a difference a week makes. I said the market was undecided if to go up or down and this week we had a big up surge will it be sustained? I notice the Bull filter for the eBook system is still not positive, so its wait and see. monthly chart still looks strong, but of course weekly charts turn first. I think we need more price action to say if the market has turned up.
Lots of 52 week highs this week, always a good sign of underlying market strength.

Market comments as 9/6/17: Prices and volumes reversed this week, as shown above with monthly and weekly charts. The market is in an uptrend but it seems undecided.
2/6/17: 5 weeks ago I mentioned the volumes were lagging the price a little. Since then the price has fallen, however the market is now sitting
on volume support levels, as the MONTHLY chart above shows and unless we get a sell off overseas, I expect price to consolidate and rise. I notice a lot of 52 week highs this week.
A sign the market is strong.
This seems to be verified by the weekly chart below, the OBV resistance I discussed in late April has been broken, and the CMF is on support. <span style="colo
 There are two main parts to money management:
1) Risk control and
2) Position sizing.
Money management can involve other things as well, like your overall business or financial plan, but with trading it’s mainly about risk control and position sizing.