New 52 Week Highs
Closing Highs posted each week for Free
Market comments for 17th July 2026

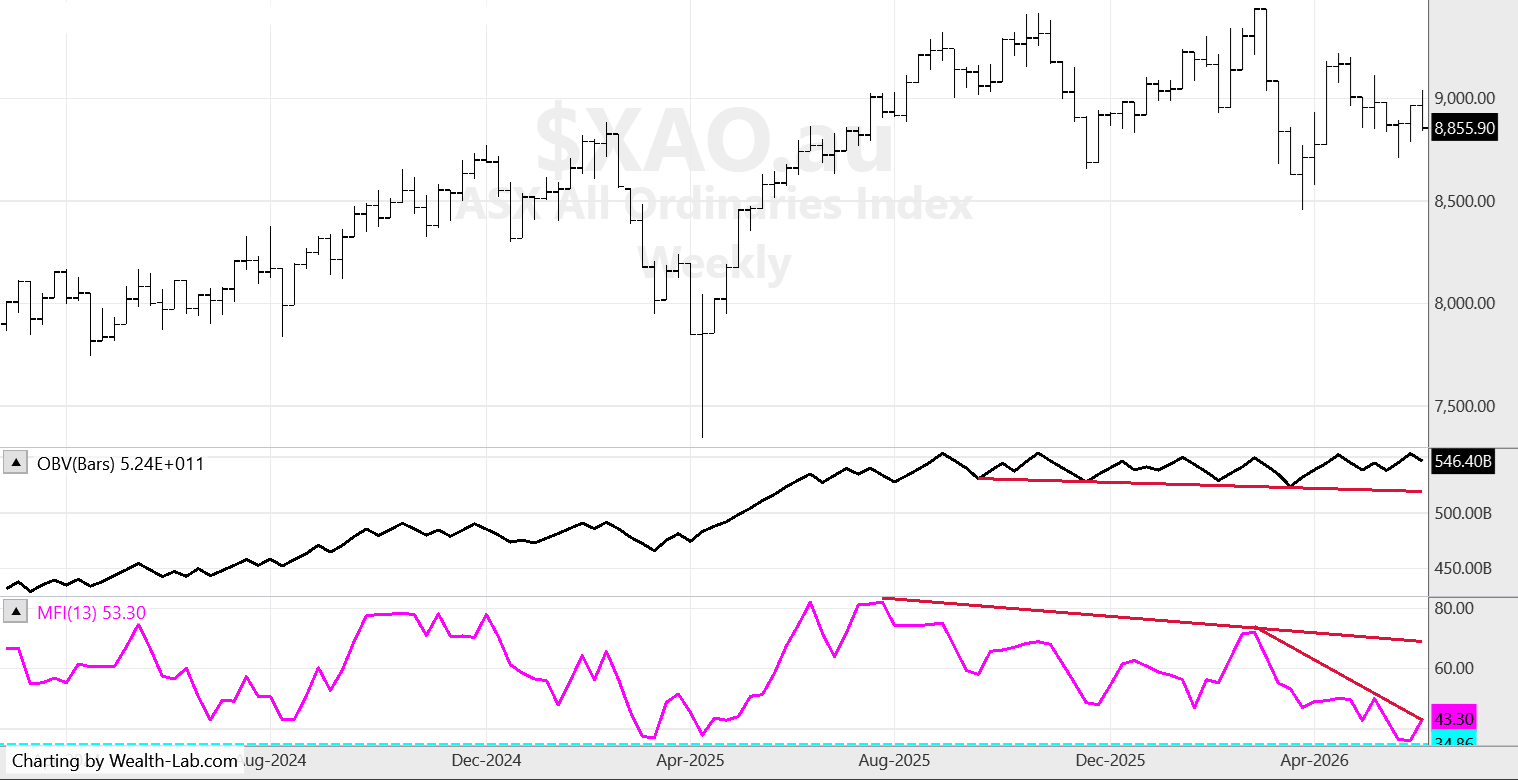
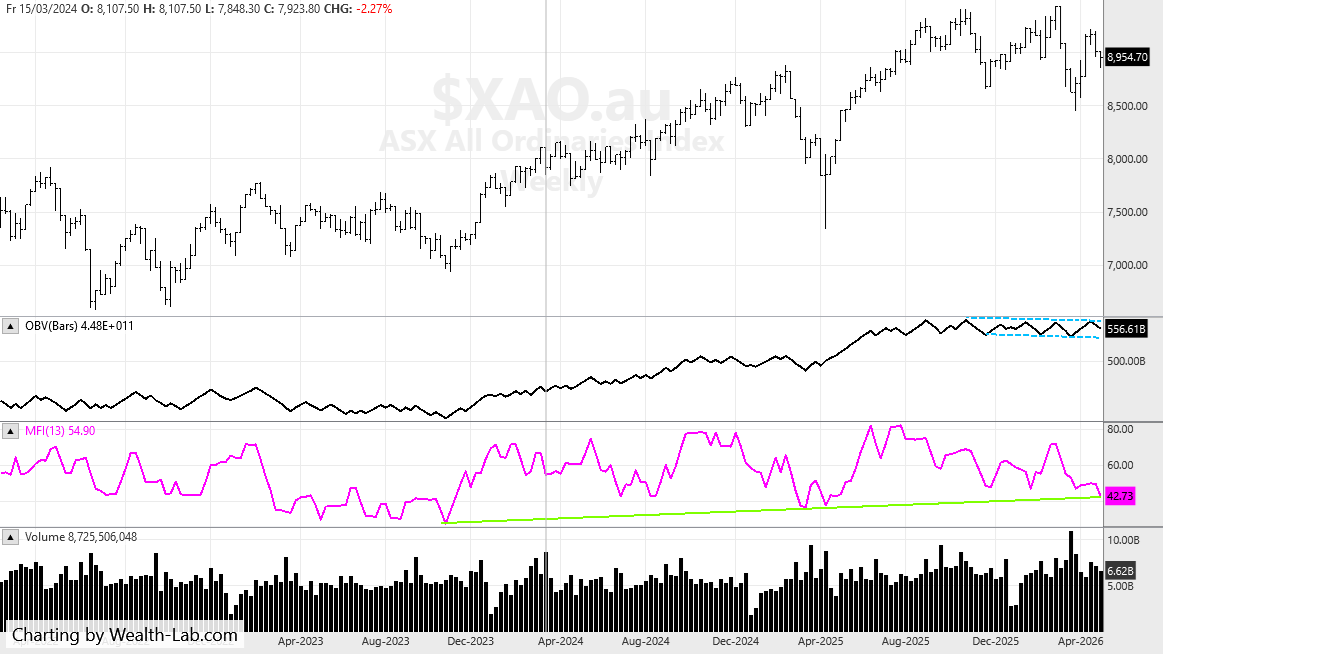
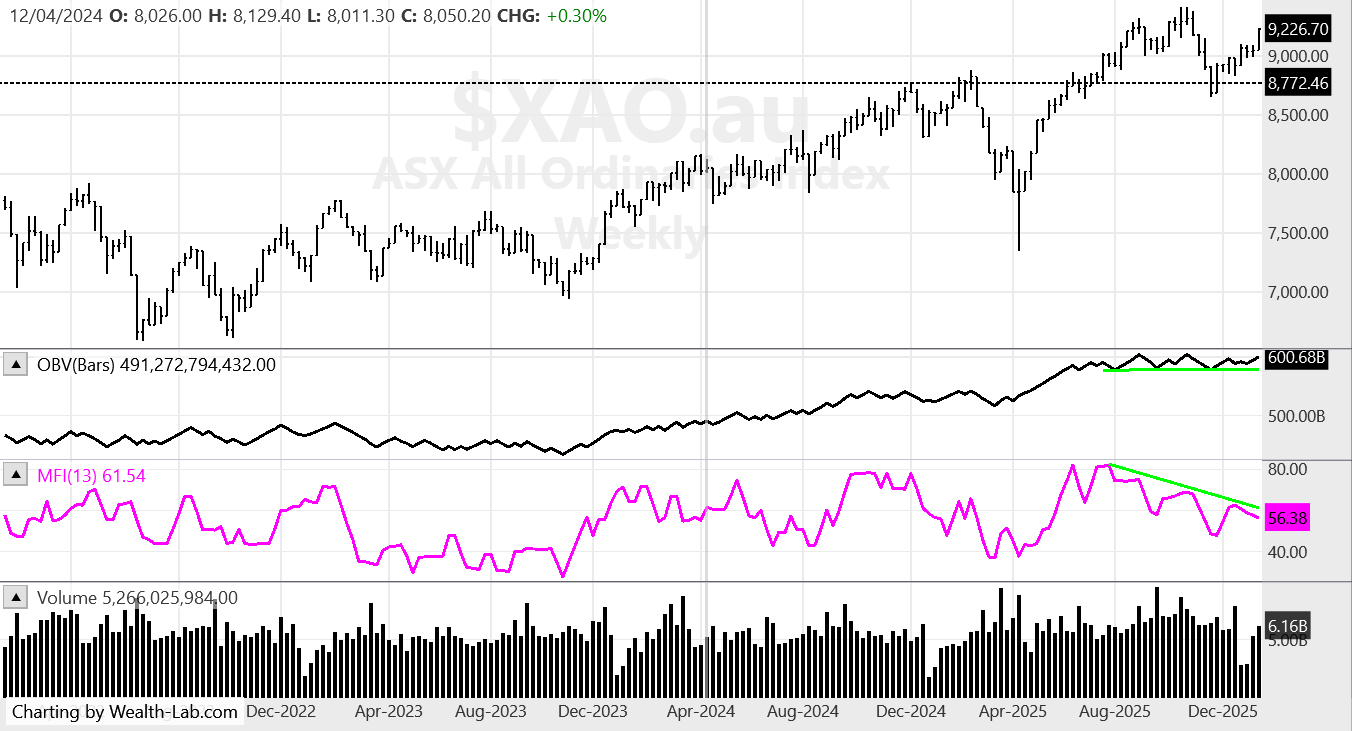
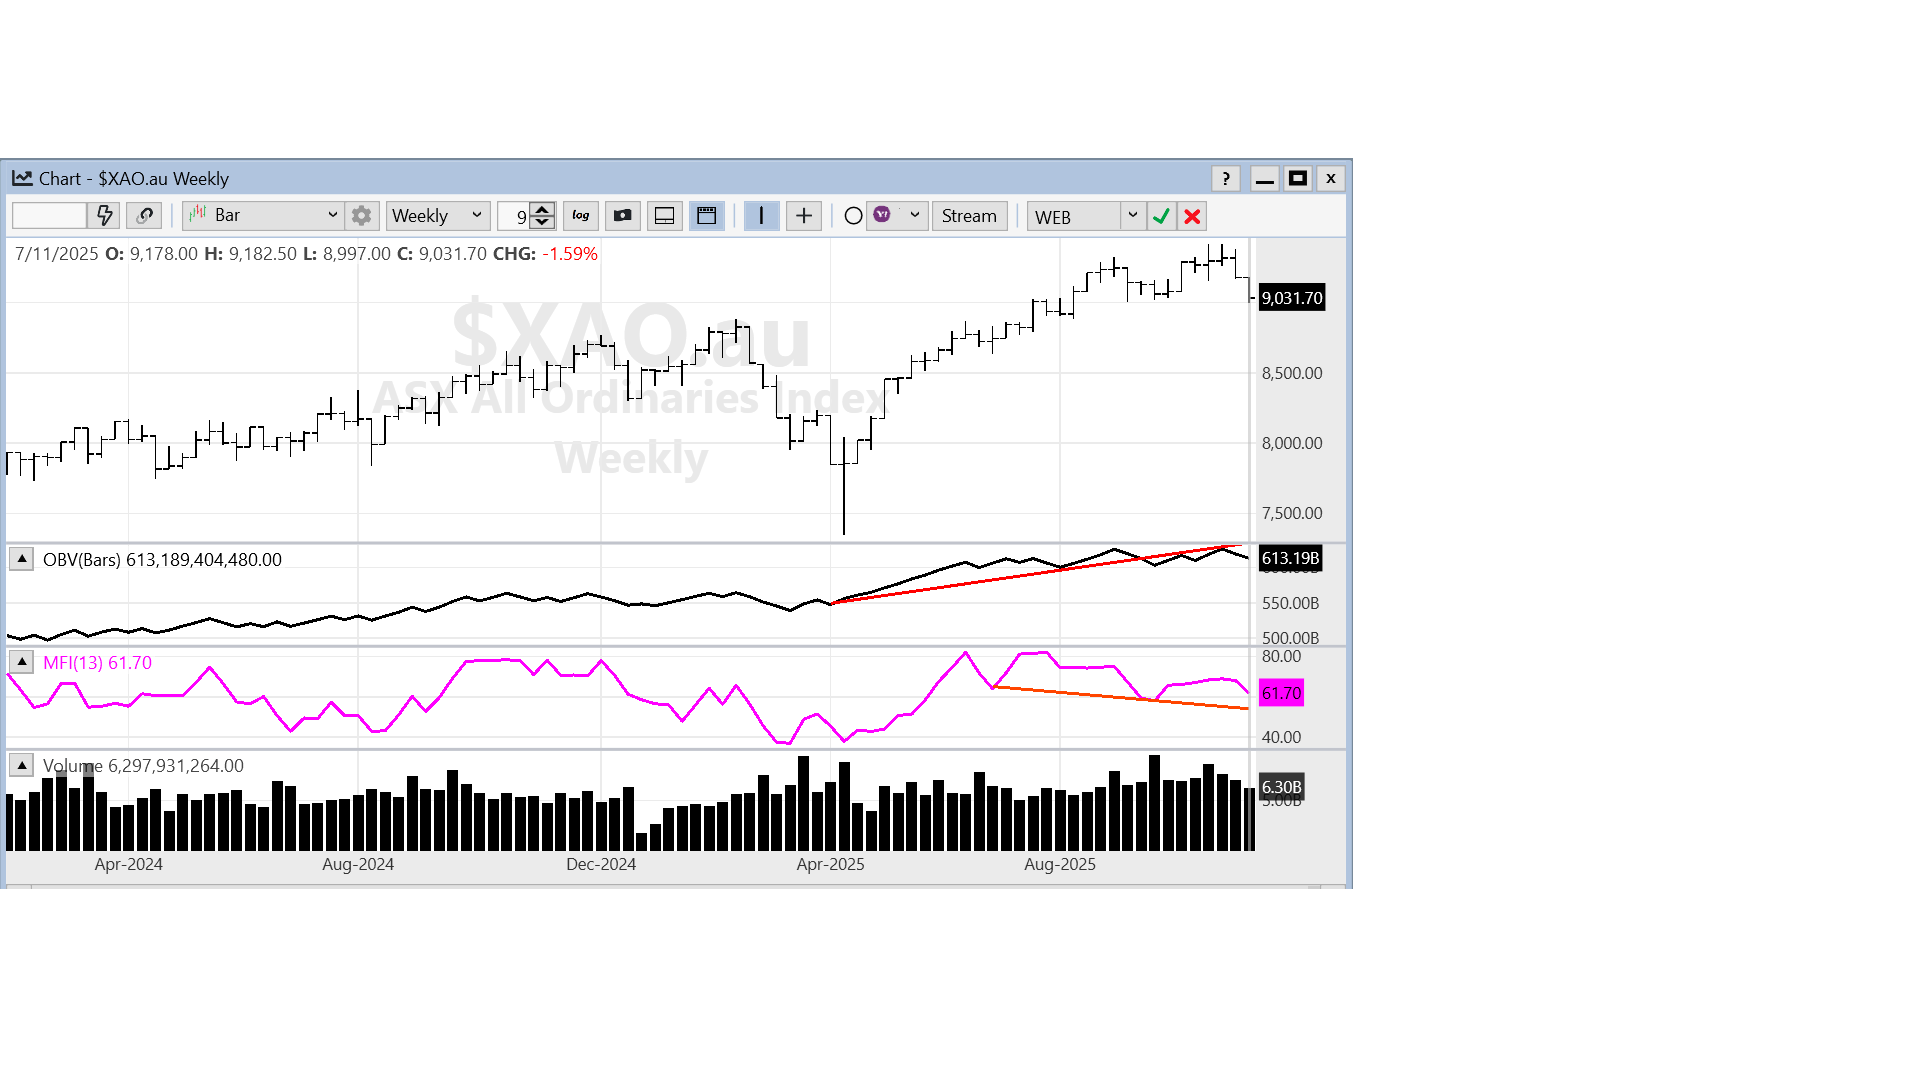
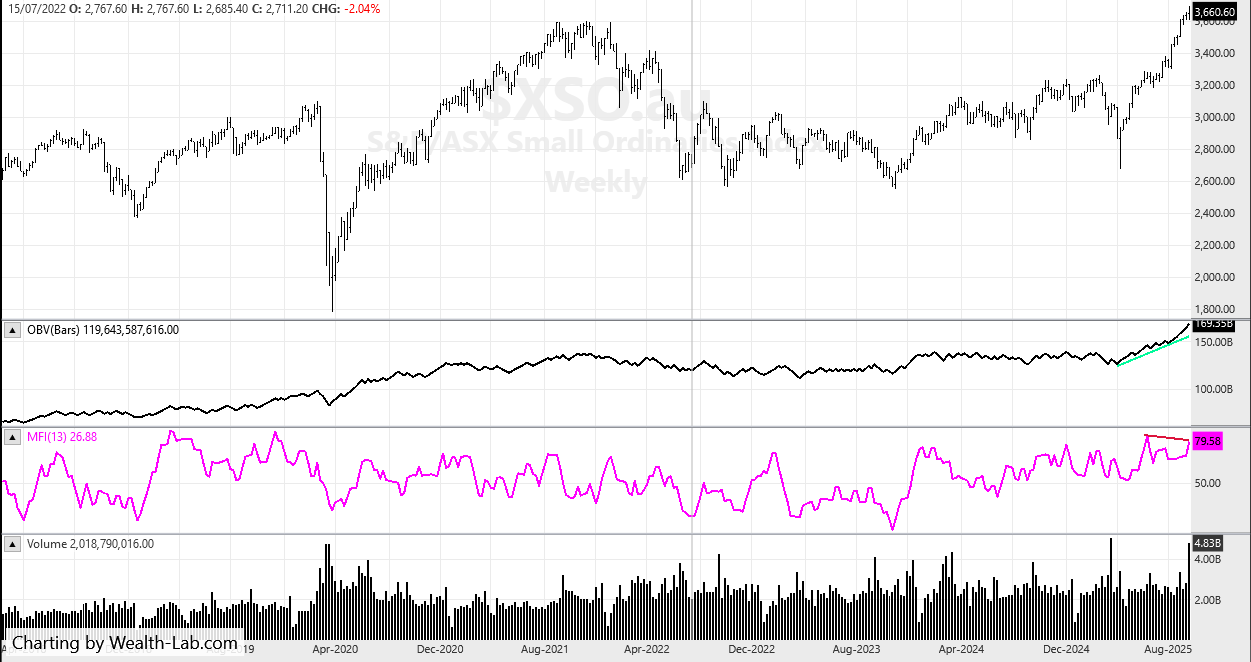
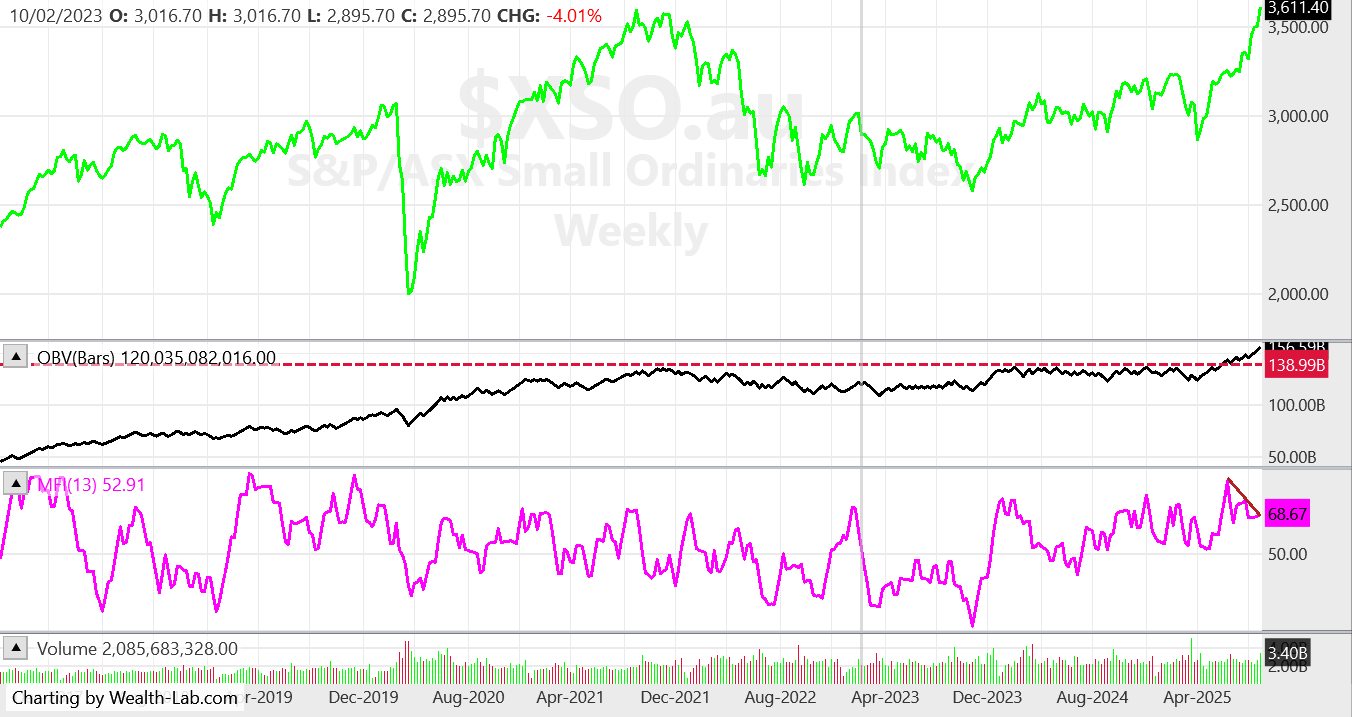
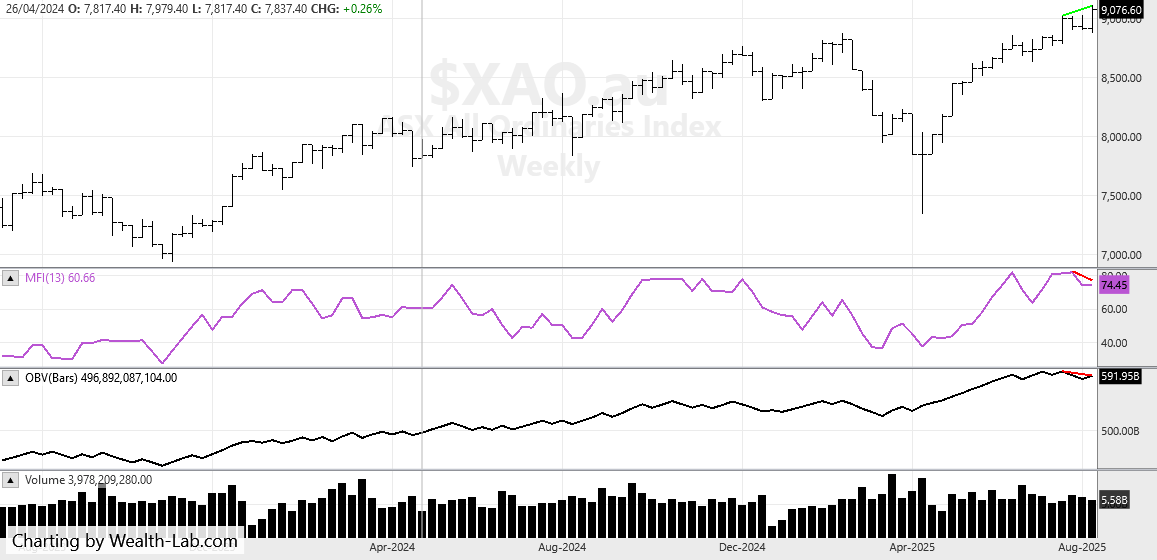
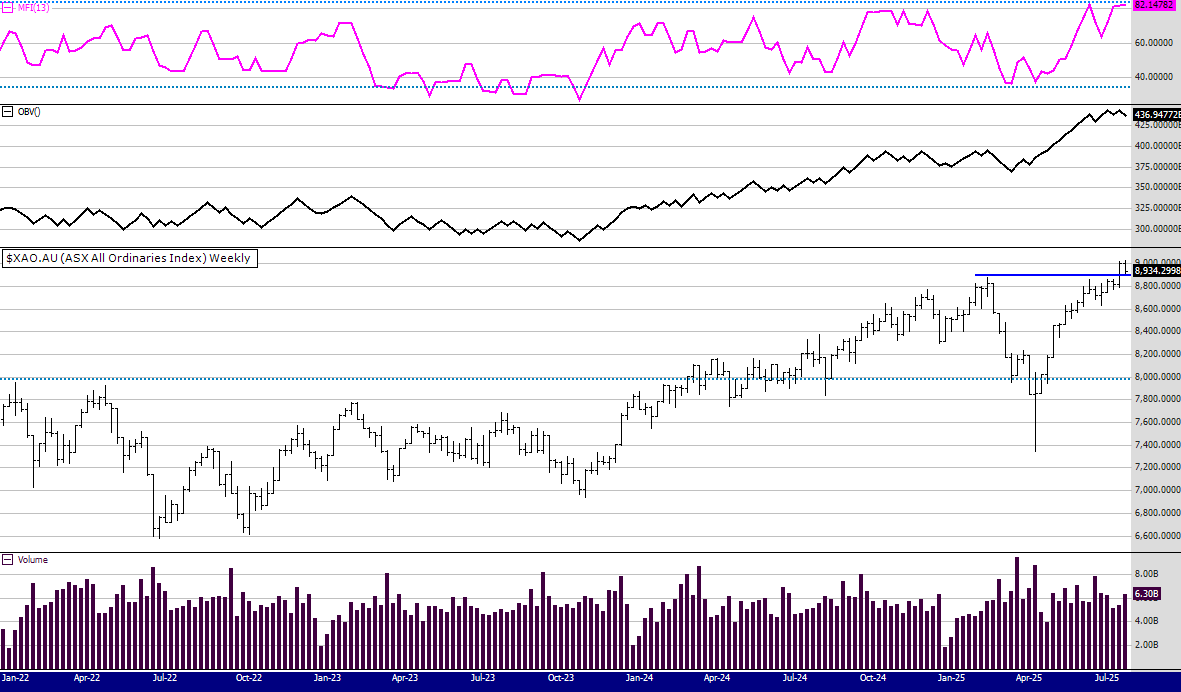
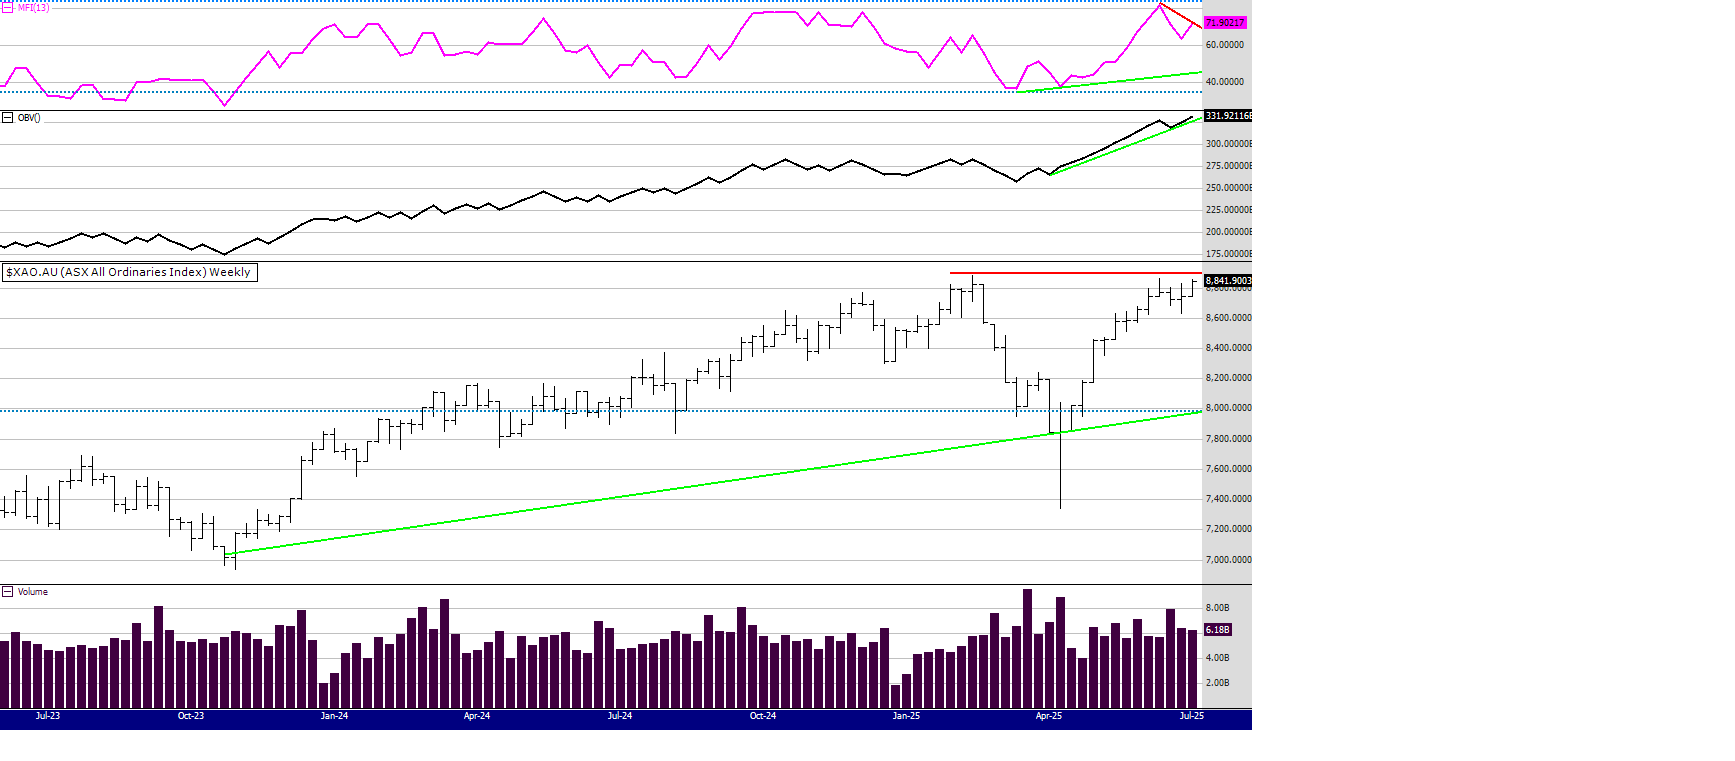
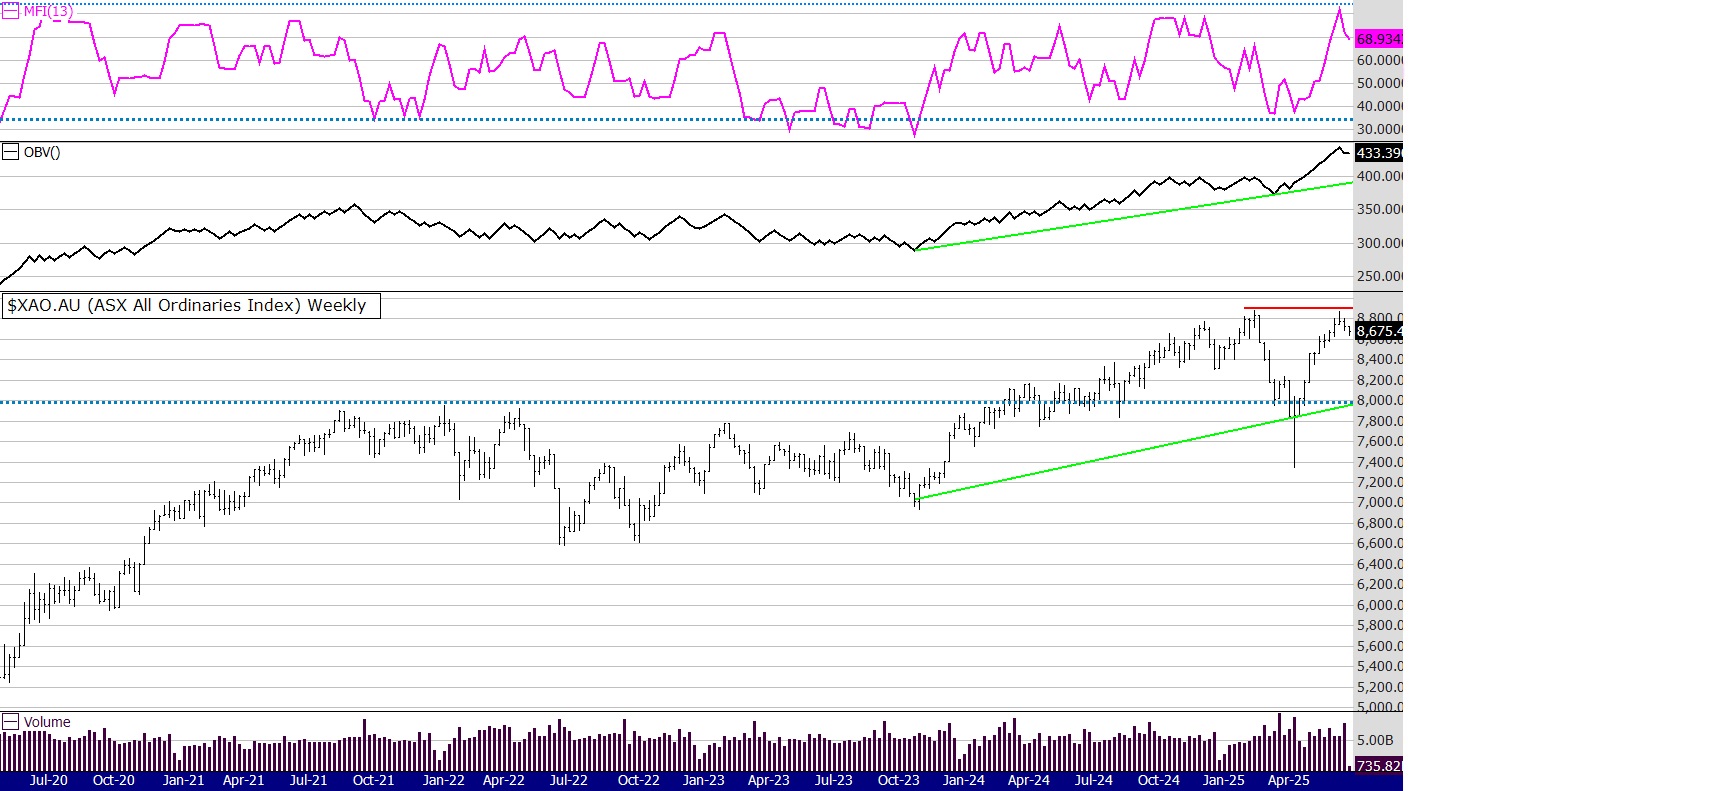
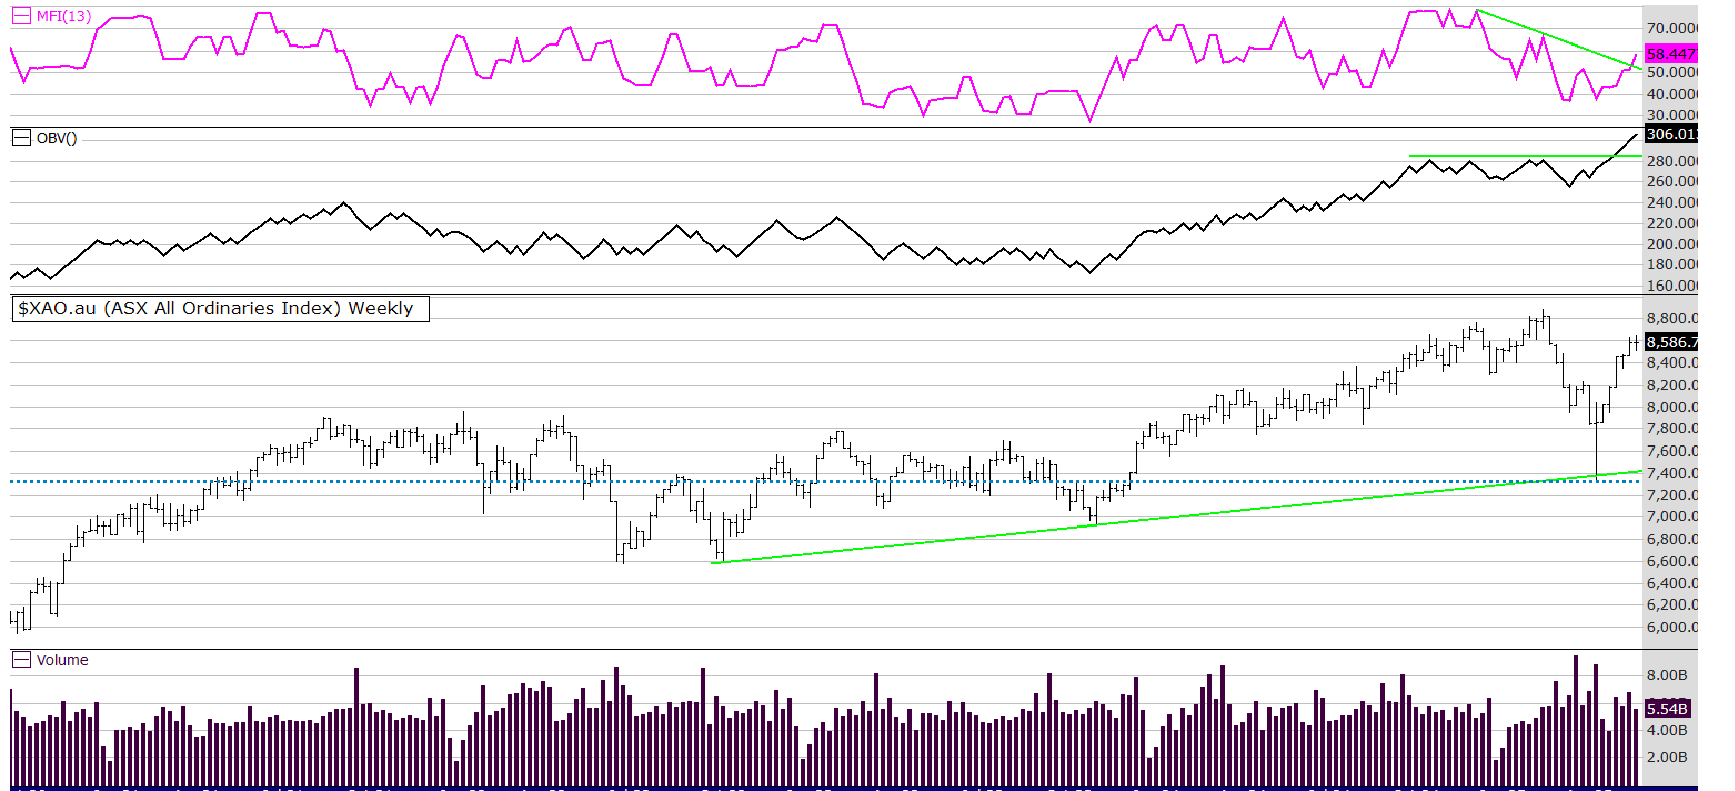
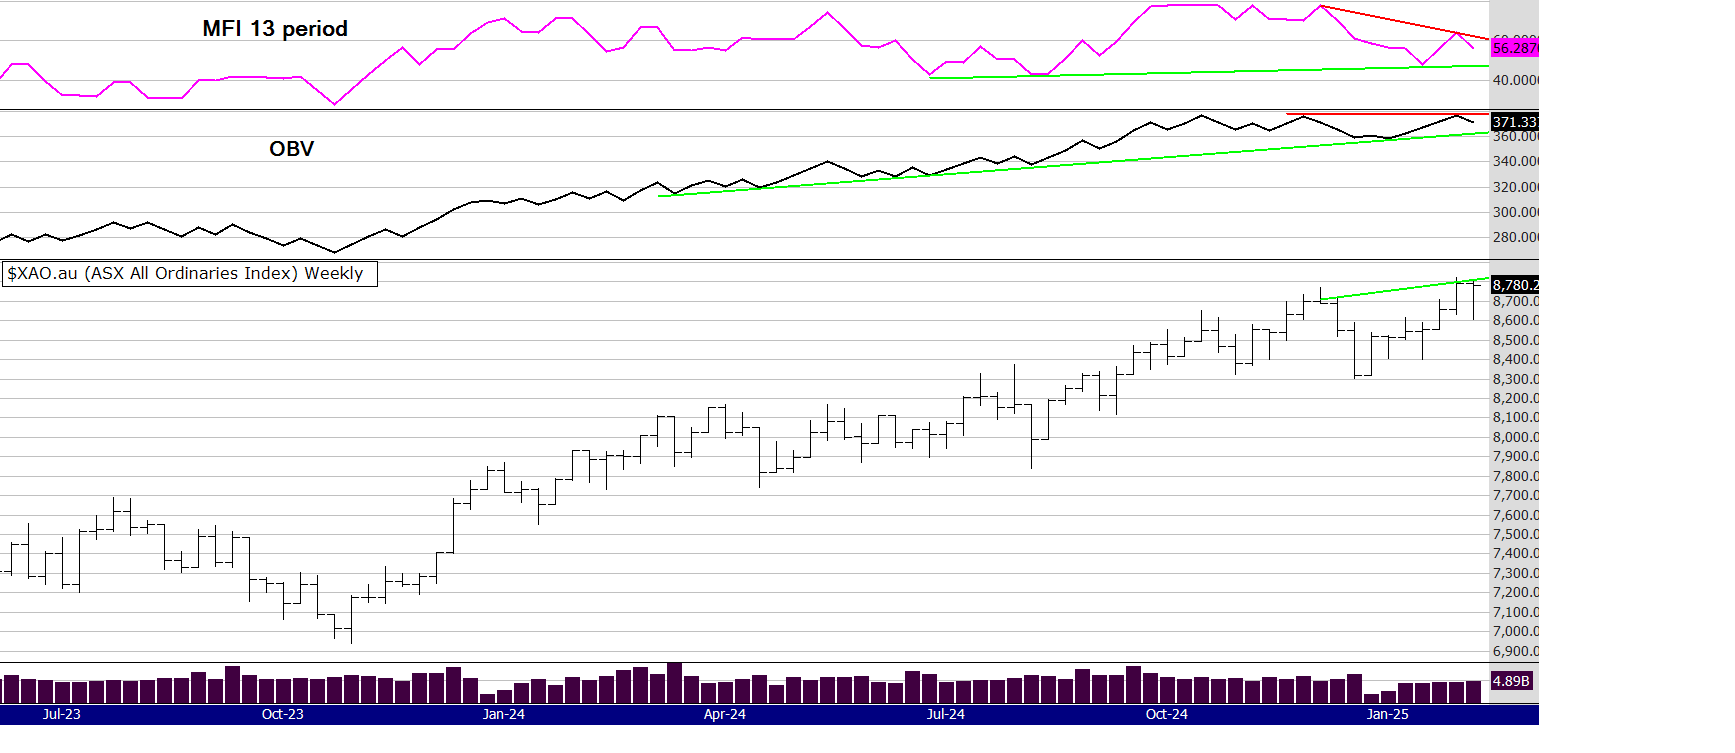
Last week I said the index above was going sideways. Not a lot seems to have changed - except for possibly one big thing, the OBV trend line has broken down. It has just poked down below the trend line. Also, as we have been watching for some weeks now the 13 period MFI (one calendar quarter) is trending down with no reprieve in sight yet.
As I write this on Saturday morning I know the US had another weak days trading on Friday - although it did close up off its low. No doubt we will see some impact of that on Mondays trading here in Australia, however its been very difficult lately to pick how our market will respond to the ongoing ME situation.
All is not lost with the 52 week closing highs (below) giving 3 alerts this week. The stand out being AMP with a big rally which I am yet to investigate why. I have again looked at the percentage of stocks trading above their 200 day MA. Comparing last week to this week.
Percentage of stocks in different sectors with closes above the 200 day MA:
Last week / this week
ASX 20. 60% / 60
ASX 50. 54% / 54
ASX 100. 49% / 51
ASX 100 to 300. 31.5% / 36.5
ASX 300 to 500. 30.5 % / 29.5
So a slight improvement in the ASX 100 and an even better improvement in the ASX 100 to 300 - the Small Ords. Despite that slight pick up in the 200 MA stats the Small Ords index is trending down (chart not shown) so its understandable why many of you are perhaps being stopped out or sitting on losing trades.
The strength is still in the Top 20 which is also understandable because bank and insurance stocks have been impressively strong and of course so has WES, Coles, WOW, ALL and now Woodside is recovering from a steep sell off.
Ideally we need a resolution to the ME situation, however as times goes on that seems an increasingly low probability.
So much of trading is about observation, non judgement and not attempting to predict, we will have to sit on our hands and wait to see what the market delivers.
Until next week.
Peter
The exit used FOR THIS METHOD is the 5/12 EMA crossover. Therefore, some stocks will be re signalling a new high buy signal if they have been recently exited by using the 5/12 exit within the last 12 months. This is important and you need to understand this.
Of course the 5 EMA needs to be above the 12 EMA to make the 52 week high valid, (otherwise we would be selling straight away) nearly always this is the case, but rarely if a stock spikes it is not.
So to repeat, the rules are: USING WEEKLY PARAMETERS!
Entry:
Share price to make a 52 closing (or equal to) week high (when selecting a buy, favour the cheapest stock)
The 5 ema to be above the 12ema
Exit:
if the 5 ema crosses below the 12 ema
The above system contains no position sizing, bull or bear filters or fundamental stock selection, these are discussed and taught to private clients or at my courses.
If you want more information about the Mindful system, or my latest book The Zen Trader, click here
https://www.easysharetradingsystems.com.au/products-and-services/e-books
52 week closing high alerts for 17th July 2026
ASX 100: AMP
ASX 100 - 300: (The Small Ords) MYS RFF
ASX: 300 - 500: None
Market comments for 10th July 2026

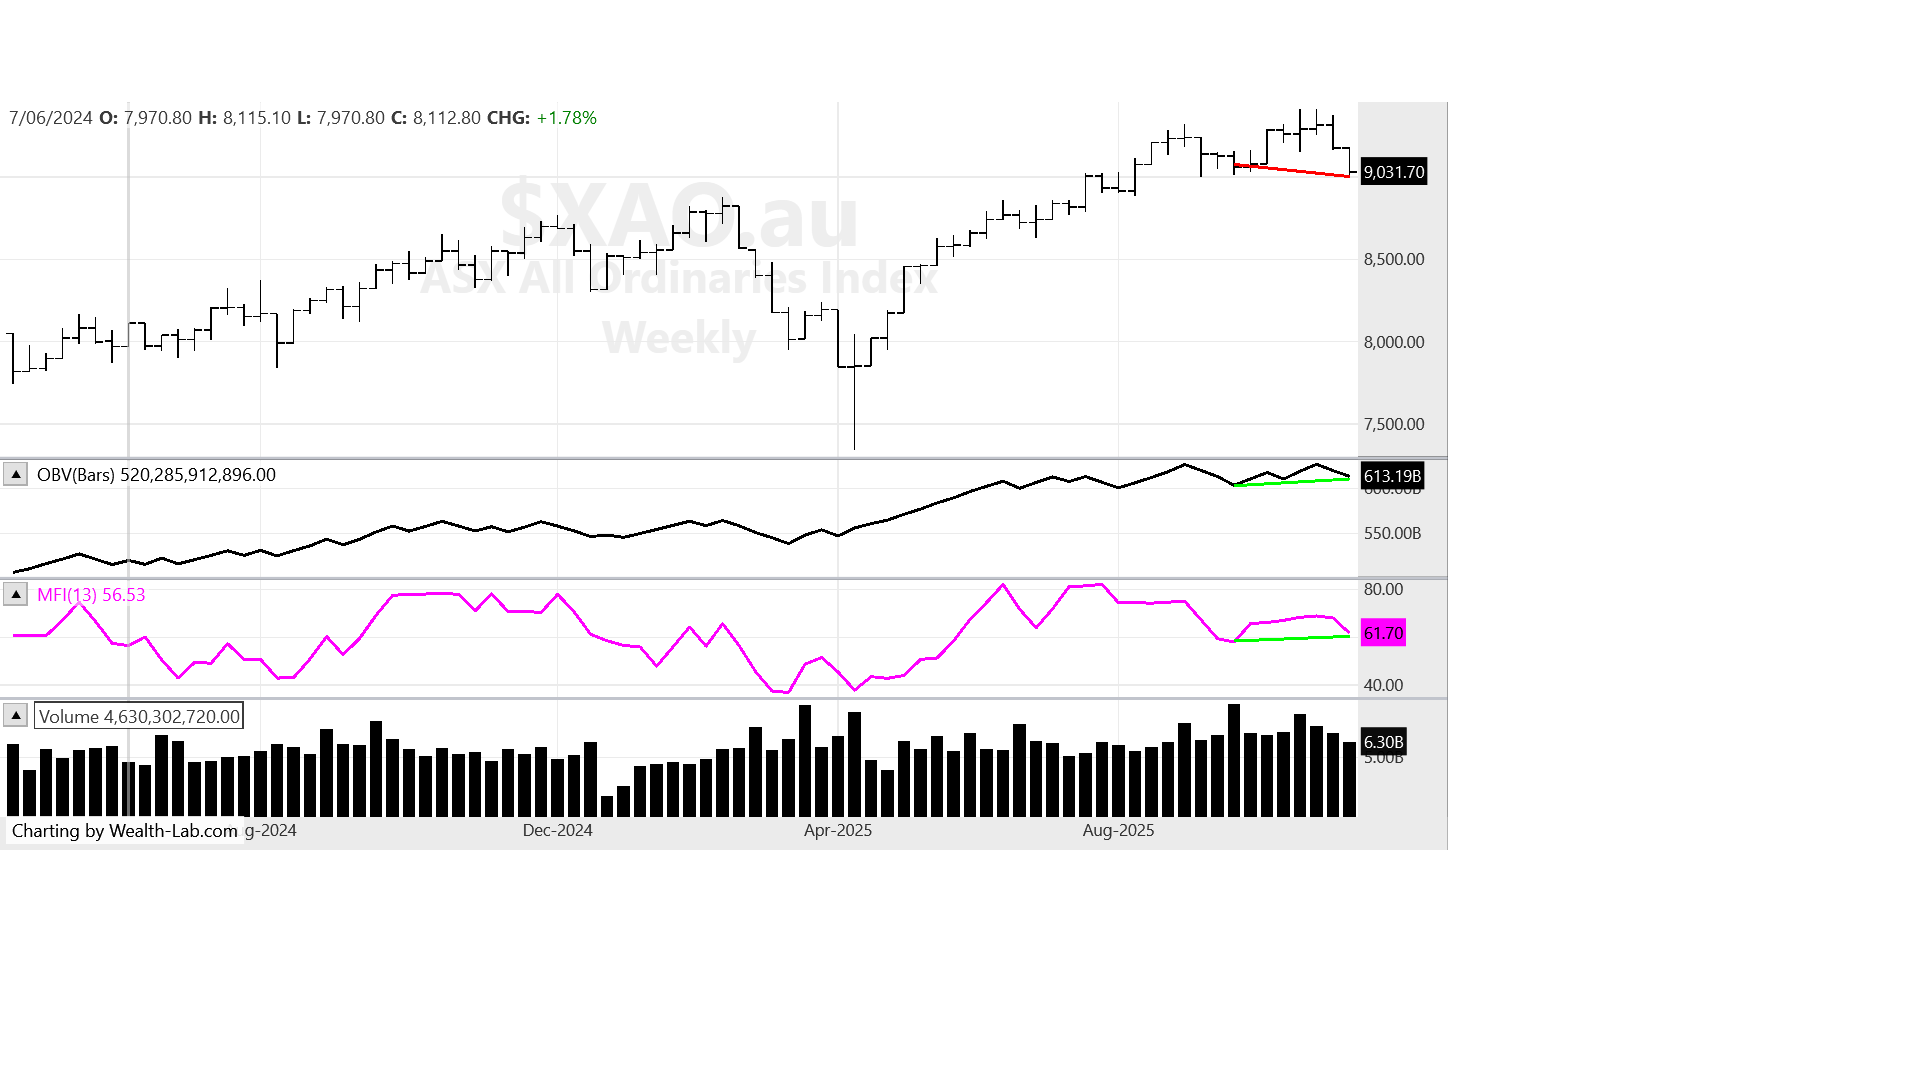
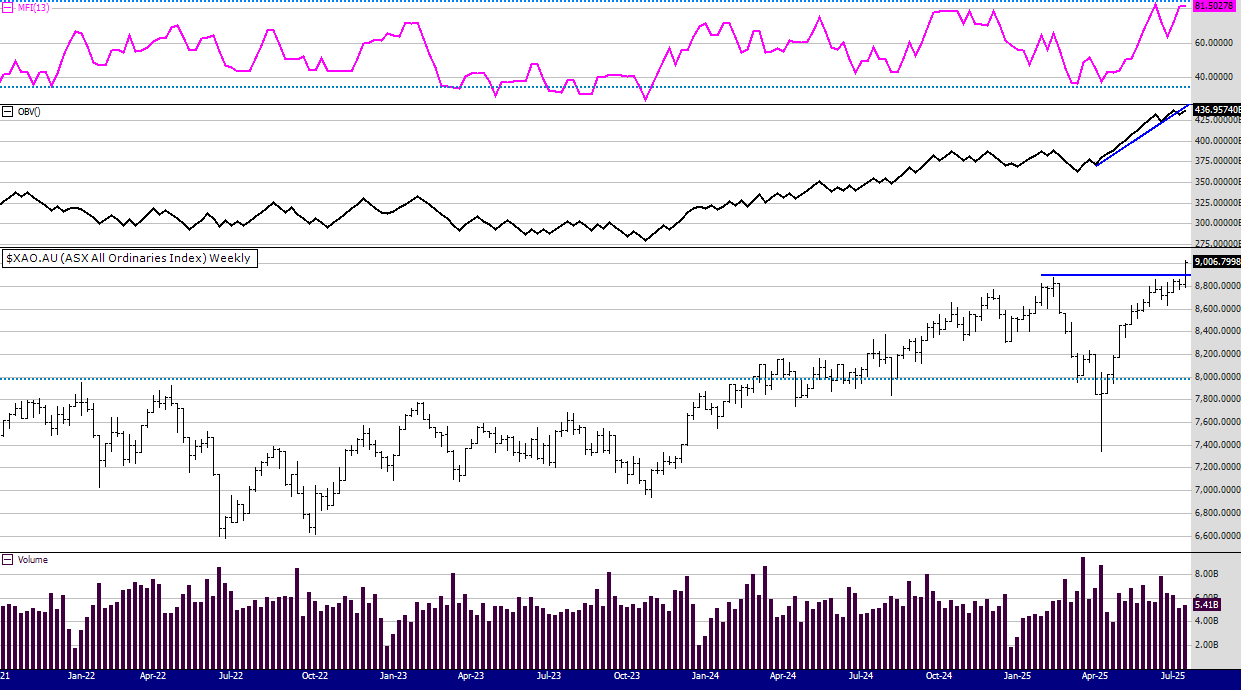
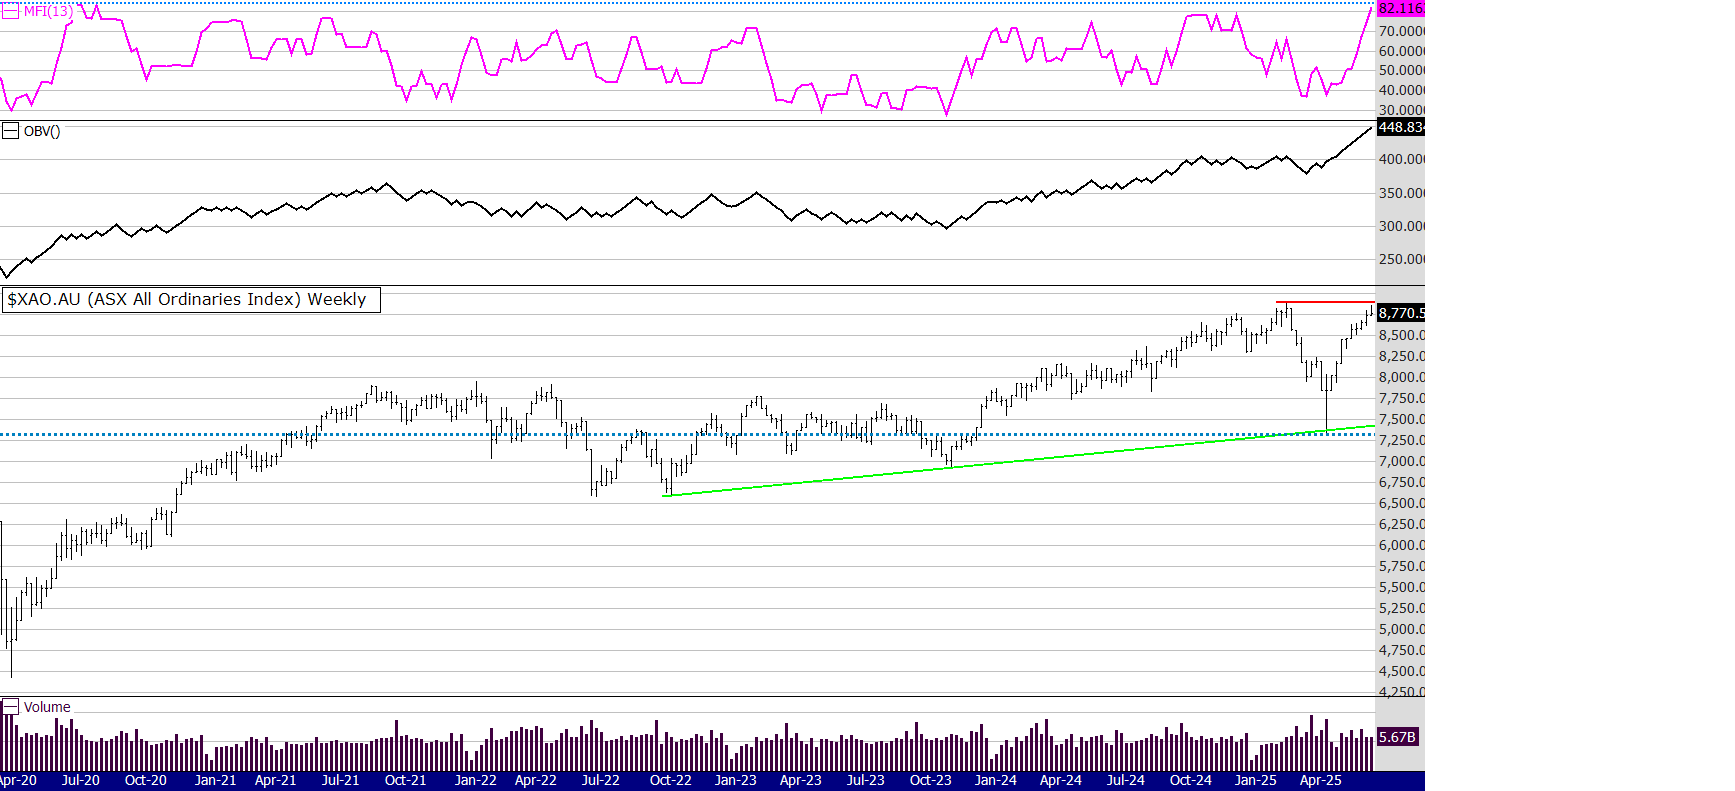
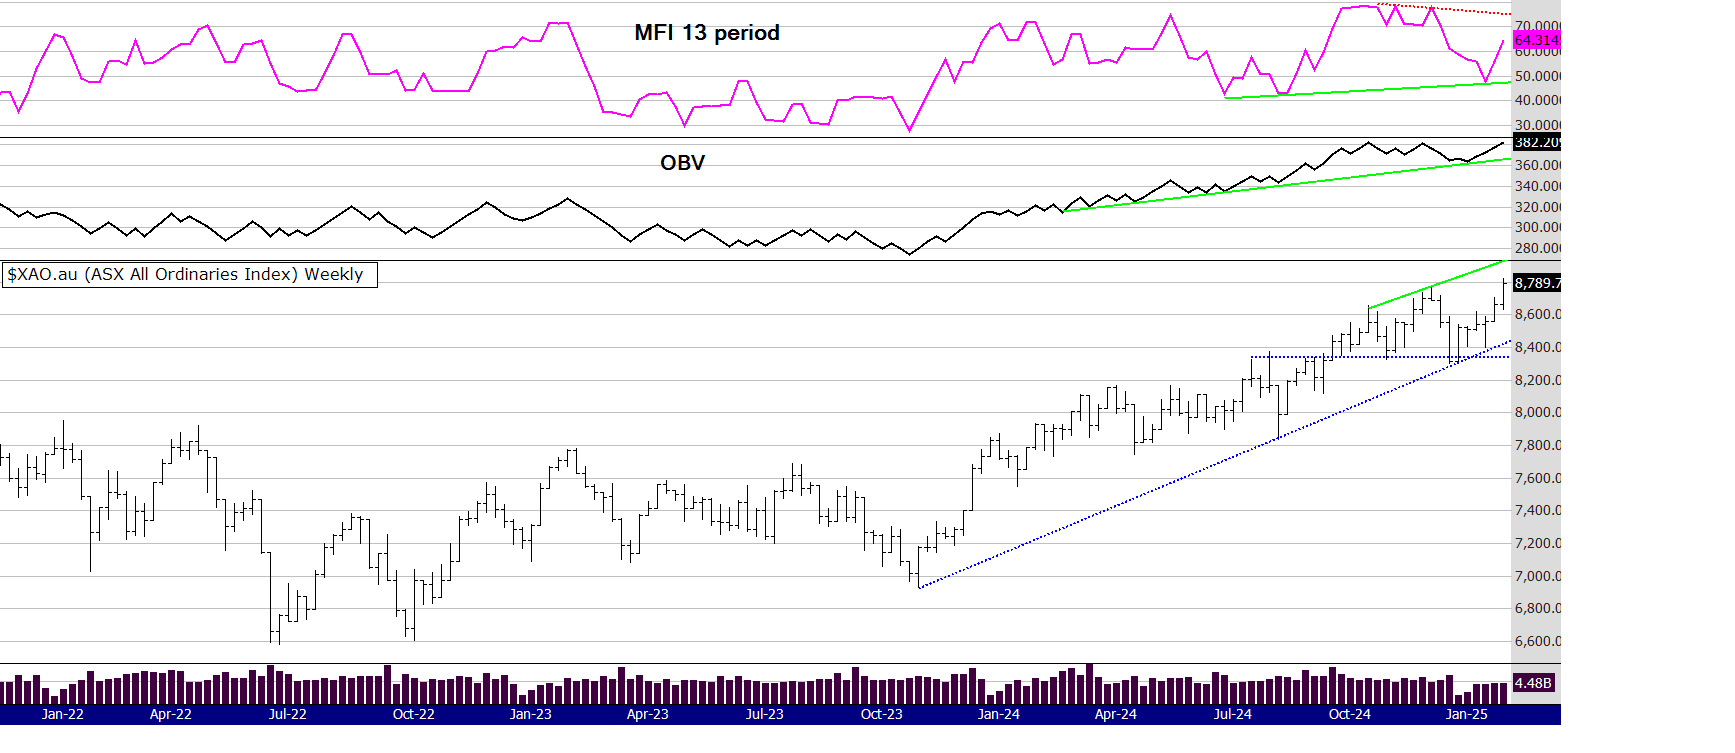
There is hardly a change from last week. The Australian All Ords continues to track sideways. The 52 week high alerts this week are again dismal only producing one signal in the 300 to 500 sector.
During the week I was discussing with some trader groups about market filters - or some sort of indicator to tell you the probability of market gains. The 52 week closing high alerts is one such signal. If there are not many stocks making 52 week highs (particularly closing highs as stocks can spike up to a high mid week but then fall down at end of week) that is as good a sign as any to the health of a market.
So we are just tracking sideways. It seems money continues to rotate from sector to sector as traders and investors look for the best place to be. Will Tech rebound? Will commodities be the next play. What about oil? How are the banks and Insurance companies coping with the current uncertainty?
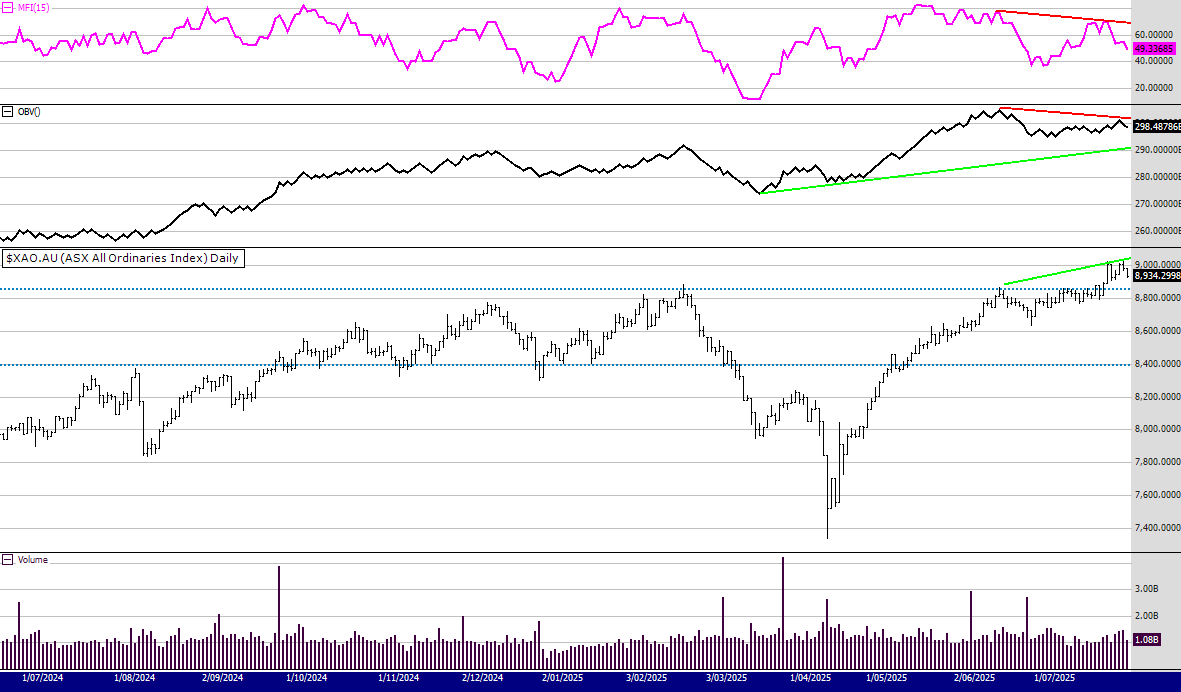
When I look at a daily chart of the All Ords (not shown here) the 20 day moving average is going sideways and some indicators are in overbought areas. So we may be nearing an inflection point, some good news or a little confidence may see a rally. July is normally a better month than June but lets wait and see what happens.
I have again listed the percentage of stocks above their 200 day moving average. The top 50 still dominates with the smaller stocks struggling.
And now just for fun I ran my comments through chat gpt for a review, here it is :)
Here's a polished version that keeps your tone while making it read more smoothly and professionally!
There has been very little change since last week. The Australian All Ordinaries continues to trade sideways, and the 52-week high alerts remain disappointing. This week produced just a single signal in the 300–500 market capitalisation sector.
During the week, I was discussing market filters with several trader groups—indicators that can help gauge the probability of future market gains. One of my preferred measures is the number of stocks making new 52-week closing highs. I place greater emphasis on closing highs rather than intraday highs because stocks can briefly spike to a new high during the week, only to give back those gains before Friday's close. When very few stocks are achieving new closing highs, it is usually a good indication that the market lacks broad underlying strength.
For now, the market continues to move sideways, with money rotating from one sector to another as investors search for leadership. Will technology stocks regain momentum? Will commodities become the next area of strength? What role will oil play? And how will the banks and insurance companies perform amid the current economic uncertainty?
Looking at the daily chart of the All Ordinaries (not shown here), the 20-day moving average has flattened, while several momentum indicators are approaching overbought territory. This suggests we may be nearing an inflection point. A positive news event or an improvement in investor confidence could provide the catalyst for the next rally.
Seasonally, July has historically been a stronger month than June, but for now, it is a case of waiting for the market to reveal its next move.
As always, I have included the percentage of stocks trading above their 200-day moving average. The Top 50 continues to outperform, while the smaller companies remain under pressure.
Until next week,
Peter (the unpolished one - authors comment)
52 week closing high alerts for 10th July 2026
ASX 100: None this week
ASX 100 - 300: (The Small Ords) None this week
ASX: 300 - 500: BFG
Market comments for 3rd July 2026
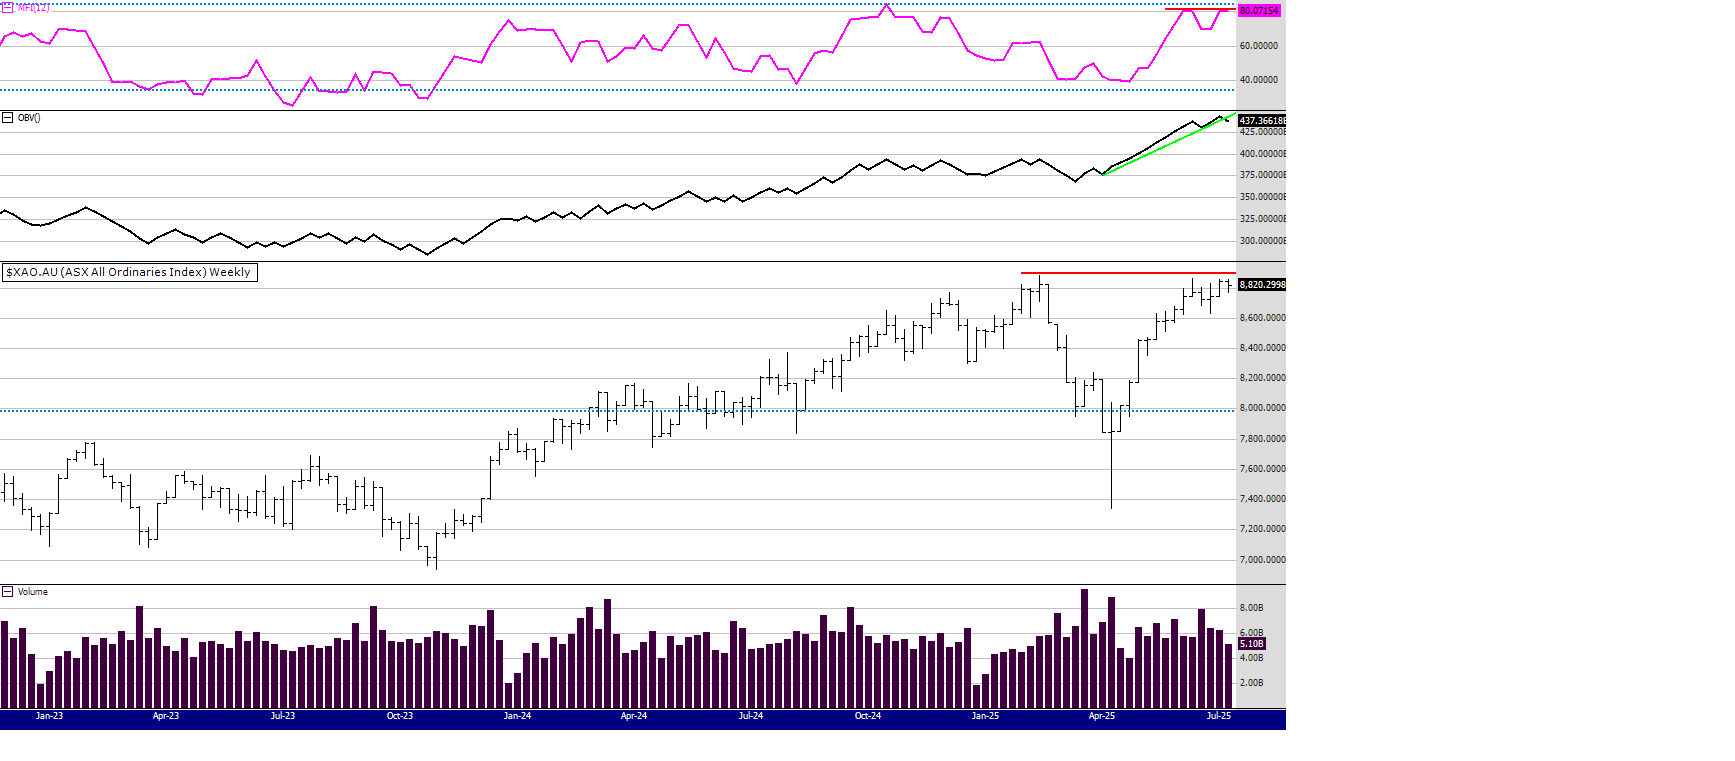
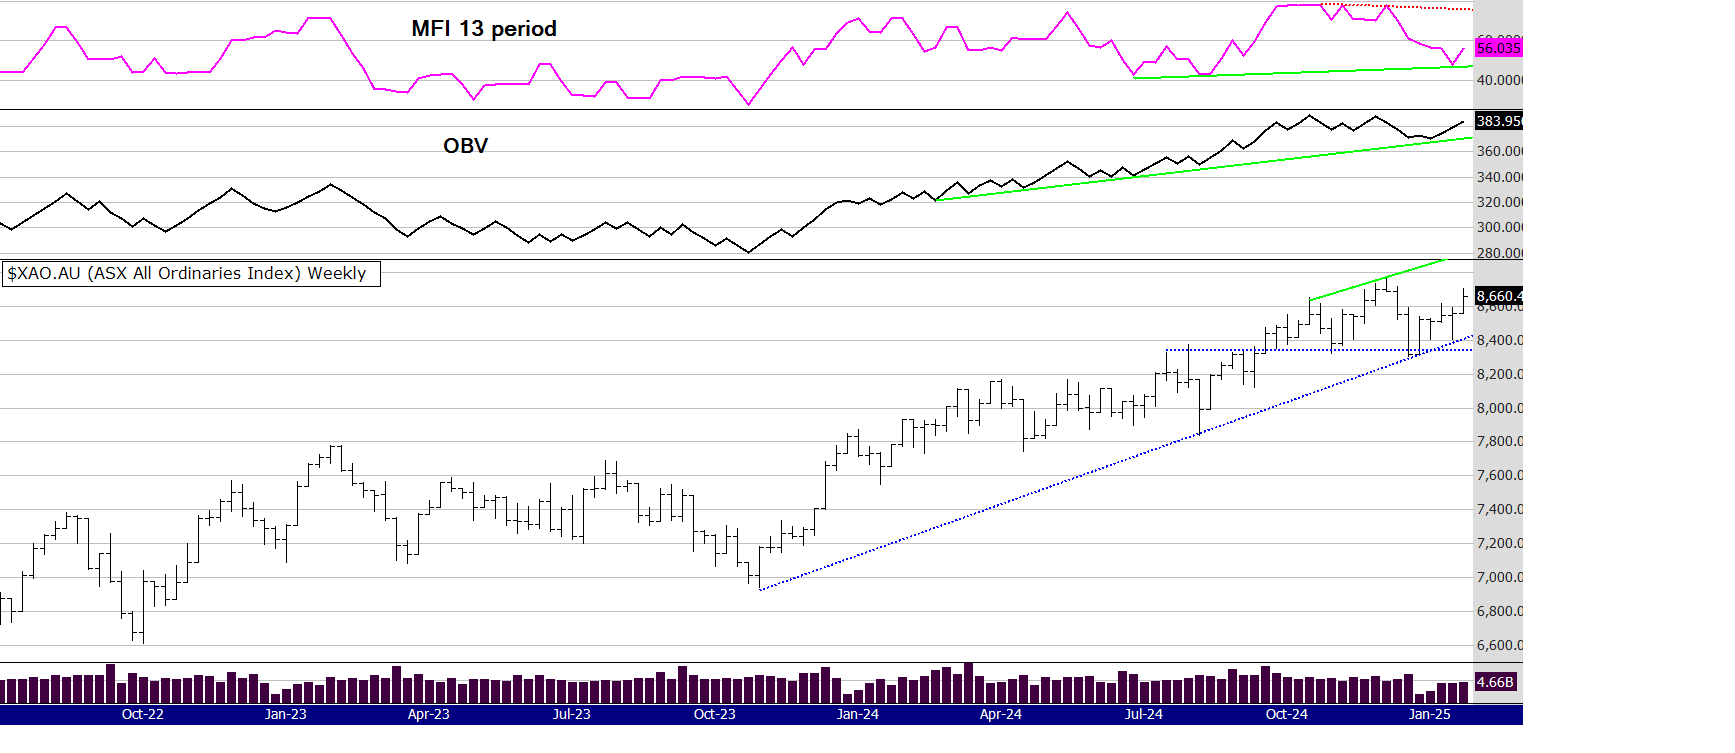
Before discussing the XAO chart, let's review the following stats.
Considering how few (none) 52 closing week high alerts there were this week, I ran scans again at the end of week (different sectors) on how many stocks are above their 200 day exponential moving average.
As you can see each sector except the top 20 has fallen. Here they are:
ASX 20. Steady at 55%
ASX 50. 52 to 50%
ASX 100. 53 to 48%
ASX 100 to 300. 39 to 33%
ASX 300 to 500. 33 to 32.5 %

So it is the top 50 that is holding up the index, in fact the top 20 was the only index not to fall. When I look at the charts of RIO and BHP, I can see why, not many other stocks gained, some fell and some went sideways. Even the much beaten down Woodside rose a little.
So it seems the rotation (or perhaps the trend continuation) back into the commodity sectors is what is holding up this Index.
Of course this is not unusual and it has happened before, saving Australia from recession as the Tech sector in the US falls as it did last week.
There is one small saving grace and that is the 300 to 500 did not really change. I did notice a lot of smaller resource stocks really pick up during the week, particularly gold and silver. So this is a sector to watch for some outperformance in my opinion.
Until next week,
Peter
52 week closing high alerts for 3rd July 2026
ASX 100: None this week
ASX 100 - 300: (The Small Ords) None this week
ASX: 300 - 500: None this week
Market comments for 26th June 2026

So the index is really hanging in there isnt it? I suppose so is the US market. I admit to be waiting for the US market to fall as it does look toppy and short term bearish. But, it continues to defy gravity.
I ran some scans today (different sectors) on how many stocks are above their 200 day moving average. Here they are:
ASX 100. 53%
ASX 100 to 300. 39%
ASX 300 to 500. 33%
So the smaller caps have really copped it and the ASX 100 is going ok. That explains why the chart above doesnt look too bad, because its dominated by the larger caps in the ASX 100 and not showing what's happening in the lower end of the market.
If you want to know what those 53 stocks in the ASX 100 are, they are listed below.
ALD.au, ALL.au, ALQ.au, ALX.au, AMP.au, ANZ.au, APA.au, AZJ.au, BHP.au, BSL.au, CGF.au, CHC.au, CMM.au, COL.au, CPU.au, DNL.au, DOW.au, EVN.au, GGP.au, GMG.au, GPT.au, IAG.au, IGO.au, JHX.au, LYC.au, MIN.au, MPL.au, MQG.au, NXT.au, ORI.au, PLS.au, PRU.au, QAN.au, QBE.au, QUB.au, RHC.au, RIO.au, S32.au, SCG.au, SDF.au, SFR.au, SGH.au, SOL.au, SUN.au, TCL.au, TLC.au, TLS.au, TLX.au, VCX.au, WES.au, WHC.au, WOW.au, XYZ.au
Out of those 53 there are 22 stocks currently trading (open trades, not yet exited) in the Mindful system and they are
ALD.au, APA.au, AZJ.au, BHP.au, BSL.au, CGF.au, COL.au, DNL.au, IGO.au, MIN.au, MQG.au, PLS.au, QBE.au, QUB.au, RIO.au, S32.au, SFR.au, SOL.au, STO.au, TCL.au, WHC.au, WOW.au
But 4 are giving sell signals so that means only 18 are left. The ones to exclude and sell on Monday are IGO S32 STO WHC.
So there is some homework for you :)
Until next week
Peter
52 week closing high alerts for 26th June 2026
ASX 100: None this week
ASX 100 - 300: (The Small Ords) DTL HLI
ASX: 300 - 500: AYA PAC
Market comments for 5th June 2026
Many of you reading this will know that the US had a big fall during their Friday trading session. Also, Monday here in Australia is a public holiday and the market is closed - so we wont see the reaction to those US falls until Tuesday. Some of that reaction will depend on Mondays trading in the US.
Last week I said this:
In the US, the market looks toppy, but as we know its very difficult to pick a top. Although we are not seeing the huge gains in the Australian market in some stocks like in the US, our market looks resilient (quite a few alerts this week). History shows that if the AI and Tech stocks in the US have a big pullback we will not be so badly effected. If you are a believer in buying in a "good zone" on the chart, (as one of my past trading teachers said to me) it looks very tempting at the moment.
So, because of the strong job reports in the US, the market was sold off from the fear of rising interest rates, but whats happening in our market and will we be so negatively effected from the US sell off? Looking at the chart above, the week started strongly but faded. The OBV looks OK but the MFI looks weak not being able to break its down trend line and showing no sign of a turnaround yet. During the last 6 years, the MFI has fallen twice to as low as 28. It is now at 43, so it could fall a lot further before we get a bottom in that indicator.
As often discussed here, the Australian market is dominated by banks and resources. An American trading friend of mine once described Australia's economy as a mine that builds houses - probably not far from the truth. I expect some miners to take a hit because they are linked closely to the AI and the green energy transition boom of lithium and uranium. The banks (particularly the stalwart CBA) look to be weakening.
We may not get off so lightly this time if the US market continues to fall.
However! I am not one to focus on the bad so lets look at the good. There were eight 52 week closing high alerts this week, quite a performance considering the look of the chart above. As always, opportunities exist within the market but it certainly takes a little more work and discipline to trade and invest in these tough times.
By the way, I am often asked how the mindful system (the one below and the alerts are based on) is performing. Over the last 12 months the results are below.
ASX 100 18%
ASX 100 to 300 22%
ASX 300 to 500 79%
So, as is often the case, the small caps are the stocks that outperform using the medium to longer term trend trading systems.
Alerts below,
until next week.
Peter
The exit used FOR THIS METHOD is the 5/12 EMA crossover. Therefore, some stocks will be re signalling a new high buy signal if they have been recently exited by using the 5/12 exit within the last 12 months. This is important and you need to understand this.
Of course the 5 EMA needs to be above the 12 EMA to make the 52 week high valid, (otherwise we would be selling straight away) nearly always this is the case, but rarely if a stock spikes it is not.
So to repeat, the rules are: USING WEEKLY PARAMETERS!
Entry:
Share price to make a 52 closing (or equal to) week high (when selecting a buy, favour the cheapest stock)
The 5 ema to be above the 12ema
Exit:
if the 5 ema crosses below the 12 ema
The above system contains no position sizing, bull or bear filters or fundamental stock selection, these are discussed and taught to private clients or at my courses.
If you want more information about the Mindful system, or my latest book The Zen Trader, click here
https://www.easysharetradingsystems.com.au/products-and-services/e-books
52 week closing high alerts for 5th June 2026
ASX 100: WHC TCL
ASX 100 - 300: (The Small Ords) DDR MP1 RDX
ASX: 300 - 500: CVL LYL VYS
Market comments for 29th May 2026
I am going to start this week by looking at some stats so we can compare to last week. The numbers below show the percentage of stocks in each index above their 200 day moving average.
The first percent number is last weeks number, the second percent number is this week.
ASX 100. 45% / 42%
ASX 100 to 300. 32% / 34.5%
ASX 300 to 500. 35% / 35.5%
So not a big difference except a bit of an uptick in the Small Ords (100 to 300) and a downtick in the 100. A slight rotation from big to smaller stocks.
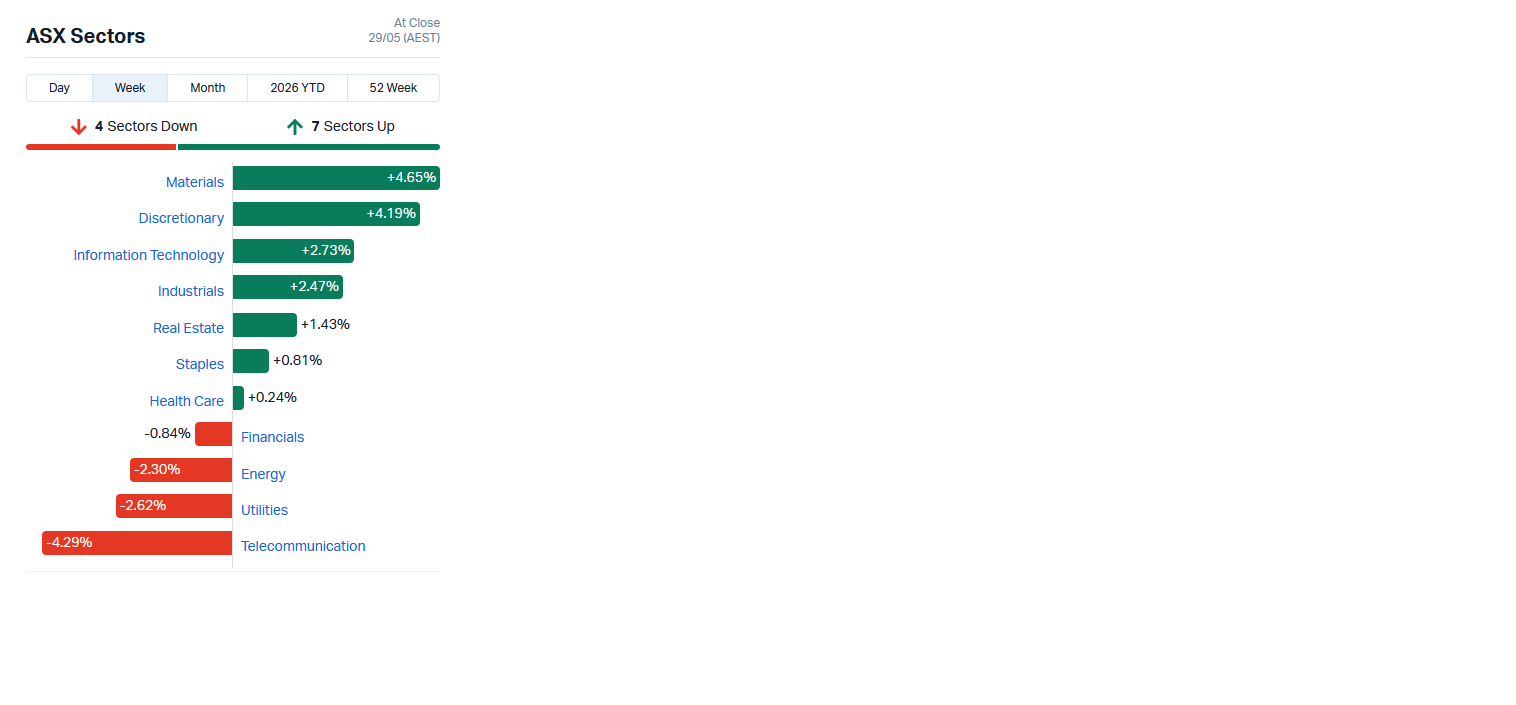
The overall index itself looks stronger, the OBV improved, price went up and the MFI is sitting in oversold areas. The index seems to be at an important point and I can see there was a rotation back into materials this week, which would explain the uptick in the XAO chart above. The graph below of sector performance is courtesy of Market Index. What the graph does not show is how well some of the smaller health stocks performed.
In the US, the market looks toppy, but as we know its very difficult to pick a top. Although we are not seeing the huge gains in the Australian market in some stocks like in the US, our market looks resilient (quite a few alerts this week). History shows that if the AI and Tech stocks in the US have a big pullback we will not be so badly effected. If you are a believer in buying in a "good zone" on the chart, (as one of my past trading teachers said to me) it looks very tempting at the moment.
Below are the 52 WH alerts, until next week
Peter
52 week closing high alerts for 29th May 2026
ASX 100: BSL IGO S32
ASX 100 - 300: (The Small Ords) NUF SSM
ASX: 300 - 500: EUR HCH
Market comments for 22nd May 2026
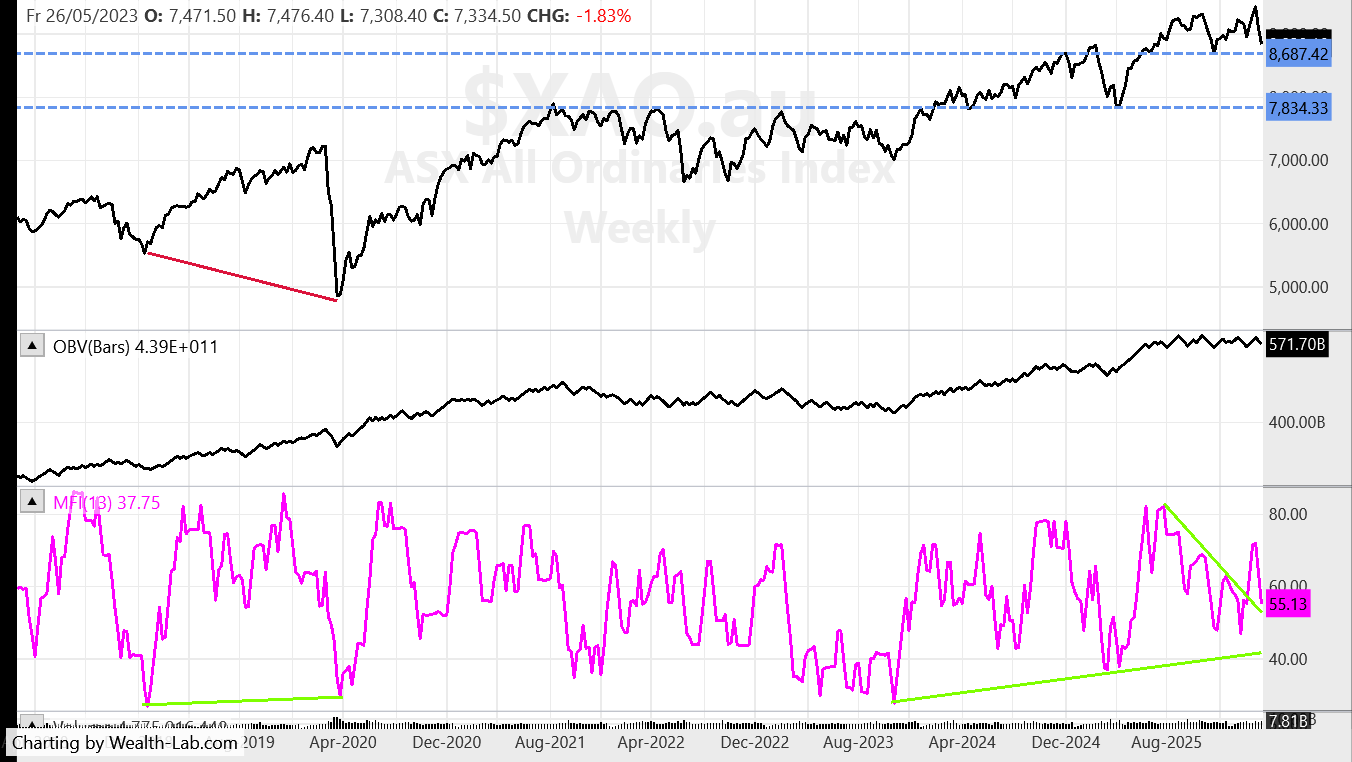
Its always darkest before the dawn. That is one way of looking at this market, the other way to see the index is that it continues to flag warning signs of weakness. I have been talking for some time about the negative divergence on the 13 period MFI. It double topped back in January 26 and has been meandering down ever since. The MFI has now broken its supportive uptrend line which you can see started back in December 2023.
However (the hard thing about Technical Analysis is there often an however) the OBV tracks sideways and has not collapsed. Nor is it trending down. I have been reading articles about how the XAO (500 stocks) has most of the strength in the larger stocks. This is shown in the following scans I did over the weekend, looking at the percentage of stocks above their 200 day moving average.
ASX 100. 45%
ASX 100 to 300. 32%
ASX 300 to 500. 35%
So, yes, its the Gorillas of the market holding up the index. Those Gorillas are the big miners and energy stocks, with some utility stocks.
Something I have noticed in my own thinking (coming from journalling) is the effect of the news on my trading. When I look at that chart above, it looks like business as usual (trading and investing is a business).
The market is still trending, no doubt the market breadth could be better, but its when the MFI is low that great buys appear - as they did in Dec 2023.
Its always darkest before the dawn. We need to have the best viewpoint to see where the sun comes up first.
52 week closing high alerts are below.
Peter
52 week closing high alerts for 22nd May 2026
ASX 100: None
ASX 100 - 300: (The Small Ords) DRR
ASX: 300 - 500: GRR BRE
Market comments for 1st May 2026
I know I missed my post last week, however it seems not a lot has changed looking at the weekly chart. The price is drifting sideways and volume indicators are trending down indicating a lack of buying enthusiasm. From a technical analysis perspective, the market double topped with the highs in late October 25 and late Feb 26 then made a lower low in late March 2026. That price action indicates the start of a down trend. So I find it interesting that some analysts are calling a new bull market. I wonder what price late May will bring?
Some sectors are notably strong. Energy and Lithium are standouts.
Financials are on support. Information tech has rebounded a little. The staples sector appears to be gathering support and consolidating.
Health is weak, gold and the materials sector are weakening. However within that sector Uranium looks strong as it is connected to the energy sector and the tech rebound.
Industrials have rebounded. Utilities are strong.
Its a stock pickers market and its volatile, money is flowing in and out of sectors and stocks quickly as the news changes. There are only 186 stocks from 500 above their 200 day EMA. That's just 37%.
Market breadth is weak. No wonder the volume indicators look bearish.
In the ASX 100 its a lot better at 44% of stocks above the 200 EMA. The ASX 50 has 46% of stocks above the 200 EMA. So the top 50 and 100 are stronger than the smaller stocks and broader index. Although, there are 3 alerts in the Small Ords this week, two in Tech and one in Materials.
The fact that the XAO index is driven largely by the financials and big miners, and that the index looks weak, I think is a concern. It's a market that I have seen and heard before. Investors and traders will look to the US for what they think is easier pickings. I don't agree.
There is always opportunity in certain stocks and sectors in Australia - we just have to be a little more careful to find the better ones.
Alerts below,
until next week
Peter
52 week closing high alerts for 1st May 2026
ASX 100: None
ASX 100 - 300: (The Small Ords) CDA ILU SIQ
ASX: 300 - 500: None
Market comments for 10th April 2026
Last week I said the market had settled and that stats were always the worst at the bottom. I also mentioned how the Russell index in the US appeared strong and the rotation into US mid caps was continuing. It would be worthwhile you read last weeks comments.
Both indexes (Russell and XAO) rallied around 4% this week.
The recent upward movement in the market could be just a relief rally, or it could be the start of a more sustained move but the weekly chart above still looks weak and uncertain.
However, anything can happen and considering it was another 4 day trading week, I will hold back on making too many comments this week - because we just dont have enough data or information.
Its a wait and see time and it will be interesting to see what a full weeks trading produces.
Until then
Peter
52 week closing high alerts for 10th April /2026
ASX 100: GGP
ASX 100 - 300: (The Small Ords) HLI
ASX: 300 - 500: OBL
The exit used FOR THIS METHOD is the 5/12 EMA crossover. Therefore, some stocks will be re signalling a new high buy signal if they have been recently exited by using the 5/12 exit within the last 12 months. This is important and you need to understand this.
Of course the 5 EMA needs to be above the 12 EMA to make the 52 week high valid, (otherwise we would be selling straight away) nearly always this is the case, but rarely if a stock spikes it is not.
So to repeat, the rules are: USING WEEKLY PARAMETERS!
Entry:
Share price to make a 52 closing (or equal to) week high (when selecting a buy, favour the cheapest stock)
The 5 ema to be above the 12ema
Exit:
if the 5 ema crosses below the 12 ema
The above system contains no position sizing, bull or bear filters or fundamental stock selection, these are discussed and taught to private clients or at my courses.
If you want more information about the Mindful system, or my latest book The Zen Trader, click here
https://www.easysharetradingsystems.com.au/products-and-services/e-books
Market comments for 2nd April 2026
The XAO continues to hang in there, the weekly bar was up but on low volume. Remember it was a 4 day trading week so that would explain it. Of course next week will be a 4 day trading week so expect lower volumes also.
Not a lot to say here, the world waits. As Winston Churchill reportedly was once asked how the war was progressing, he replied -
"we shall await events".
The market has settled. You can tell by looking at the 52 WH alerts below. In the top 300 we have 2 buy alerts and there were 4 sells. So the ratio and numbers of buys and sells is improving - however the buys are only in the oil and gas sector. Not surprising.
The stats are still fairly dismal. With only 33% of stocks in the Small Ords above a 200 day moving average.
41% of stocks in the ASX 100 are above the 200 day MA.
The standout is the Top 20, with 55% (11) stocks still above their 200 MA.
However! These stats will be dismal at the bottom or before a turn up. So we need to think like one of my old trading teachers - consider where the opportunities are rather than get depressed about how bad things are.
So I have given you a big clue. Until things settle, and if you really want to trade, look at those 11 stocks in the top 20. They are:
BHP ANZ BXB NAB NST QBE RIO TCL TLS WBC WDS WOW
Or, just stick to your system and keep pulling the trigger.
Speaking of positive thinking and opportunity, look at one of my favourite market barometers below, yes you guessed it, the Russell.
That is not a weak chart. It looks to me like it has bottomed and really wants to go higher. My one concern is the low volume bar last week, but as explained it is Easter and only a 4 day trading week. Even the obsessed and addicted US market traders break for Good Friday.
If the Russell does rally next week - it could create buying in the Small Ords. So next week it will be interesting to revisit those stats above to see what differences there are.
A thought for Easter:
The famous Buddhist monk Thich Nhat Hanh (a colleague of Martin Luther King) wrote a book called "Living Buddha, Living Christ" - discussing the similarities (not differences) between the two religions. Here is a quote from the book and one that can be applied to all religions and belief systems.
“The deepest truths of Buddhism and Christianity meet in direct experience, not belief.”
Until next week and Happy Easter
Peter
52 week closing high alerts for 2nd April /2026
ASX 100: STO
ASX 100 - 300: (The Small Ords) KAR
ASX: 300 - 500: None
Market comments for 27th March 2026
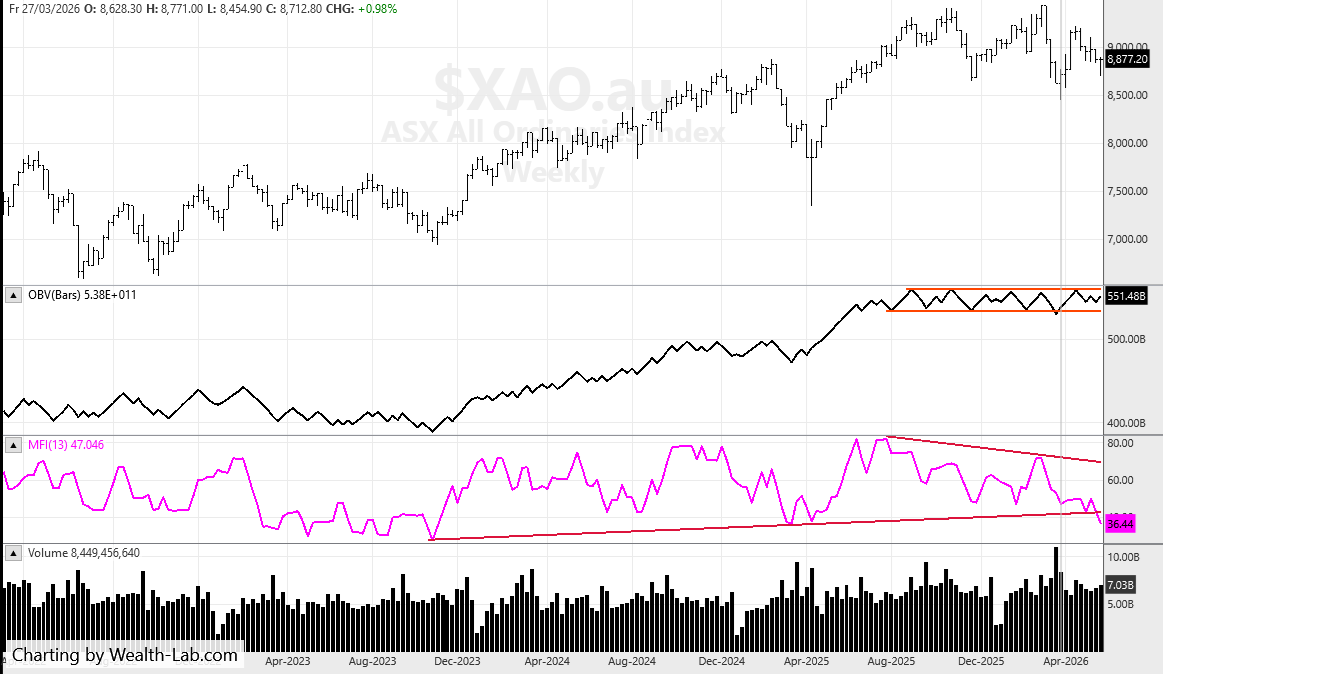
The XAO held up very well this week. Despite my bearish call last week. However, the OBV is slowly sliding down, indicating the buyers are retreating to their caves. Most of you probably know the US indexes had a fall last night and that of course will spill over into the Australian markets on Monday.
The 52 week closing high alerts for the Mindful system are drying up. Only one this week. I ran the scan over the ASX 300 (the index the system was originally designed for) and it was a similar result to last week. One buy signal and nine sells.
I even ran a few scans over a list of stocks known for good fundamental criteria (consistent earnings etc) and the result was similar, sellers dominating.
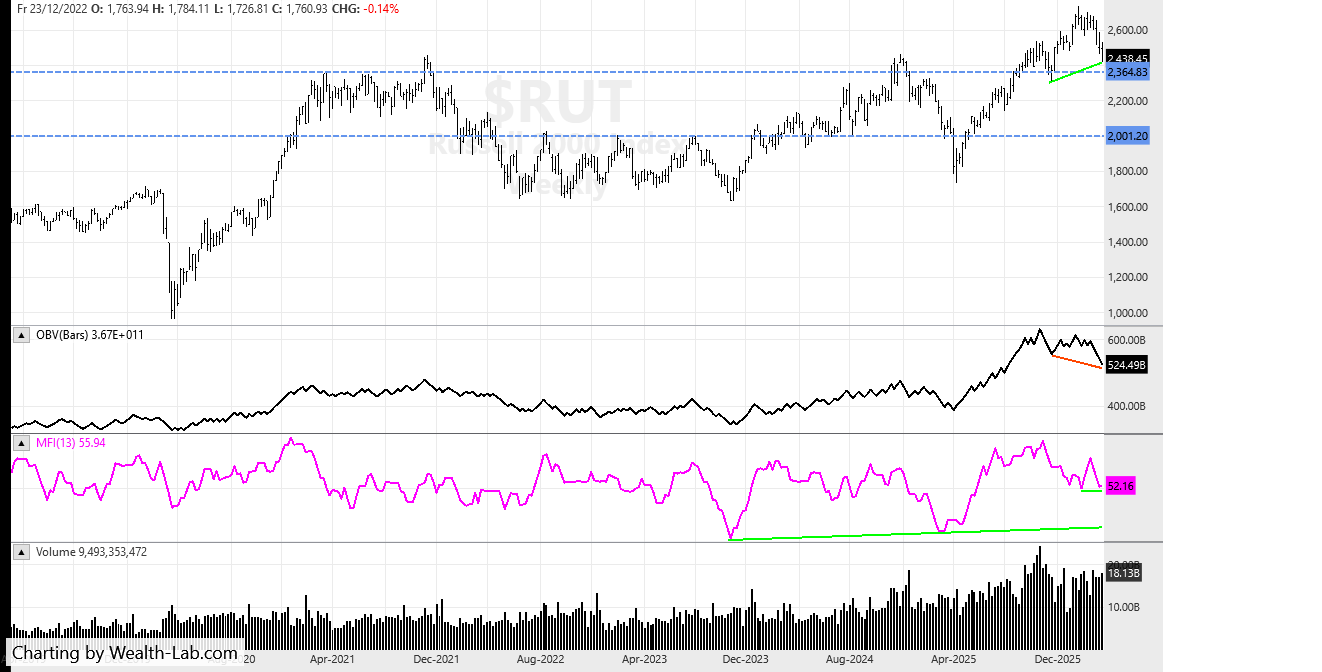
The Russell:
I have a trading friend of mine (you know who you are :) that thinks I am always bullish. Maybe, however, consider this thought and line of thinking.
If you didnt listen to the news and hear about all the dramas of the world, what would you think of this chart above? Would you think - well it looks like a steady pullback towards support lines? Or would you think the sky is falling in and its definitely Armageddon?
Nothing has changed much from last week, the Russell still looks bearish but how far it falls is anyones guess. The 1st line of support may hold, it may not. It may fall to the 2nd line of support or somewhere in between. We just have to wait and see.
Gold: (the GDX in the US)
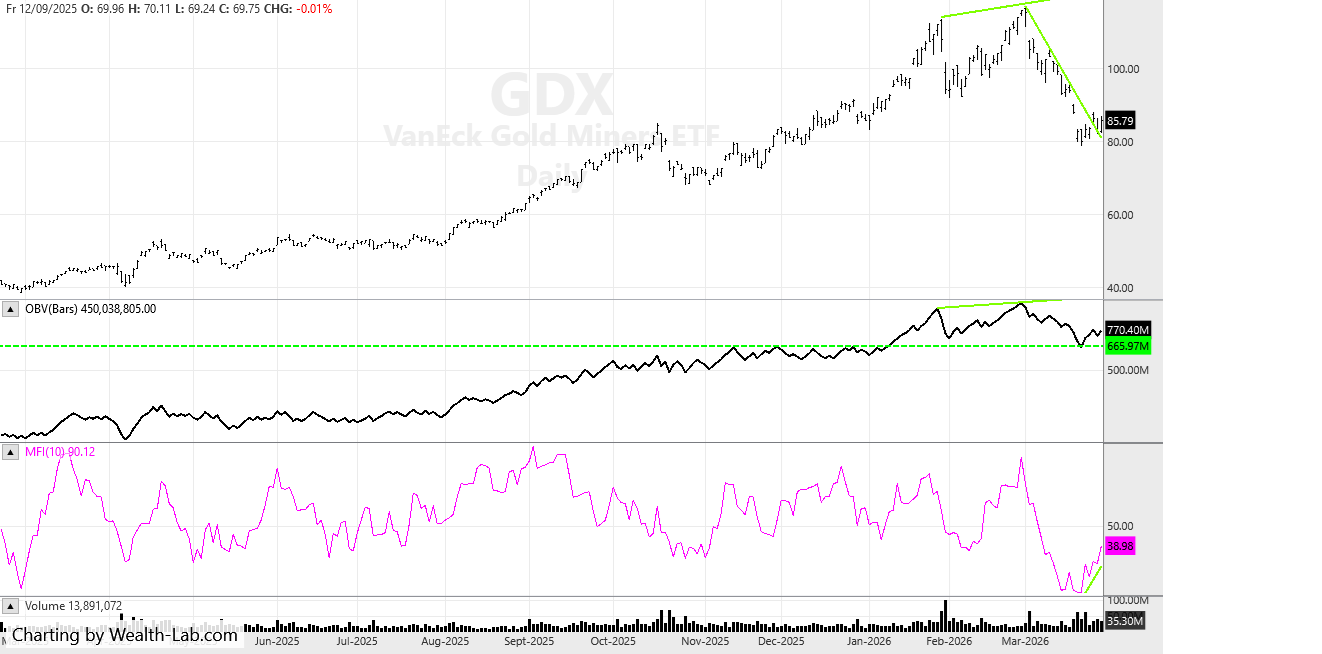
Above is a DAILY chart of the gold miners index in the US. I am showing this because the gold miners in Australia follow this index closely. (A bit like lost sheep not being able to decide for themselves which way to go)
Despite heavy selling across the broader stock market indexes, the gold share sector had a bullish week here in Aus. That looks set to continue on Monday looking at this chart.
Please focus on the volume indicators.
Note how the OBV fell to its support levels along with the price, and the 10 period MFI (very fast period representing 2 weeks of trading ) fell to extreme over old areas.
The gold price itself has recovered back up to 4,500 after bouncing off around 4,100. I had a target low of 4000 on it but it never quite got there. I notice too BTC has fallen back down, after intitialy showing some resilience, so it appears gold may again be the choice of traders (along with oil) in these turbulent times.
US Natural Gas looks like the trade of the year to me, but the market is yet to agree with me. How dare it!
Until next week
Peter
52 week closing high alerts for 27/3/2026
ASX 100: None
ASX 100 - 300: (The Small Ords) RDX
ASX: 300 - 500: None
Market comments for 20th March 2026
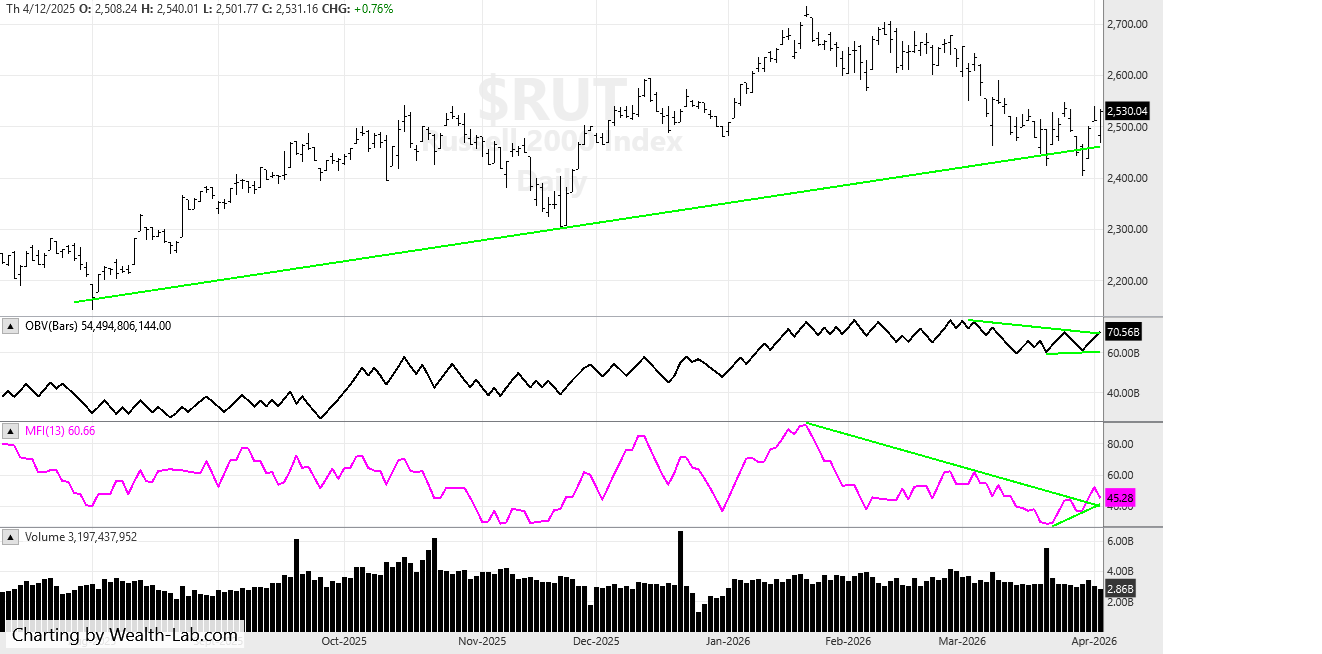
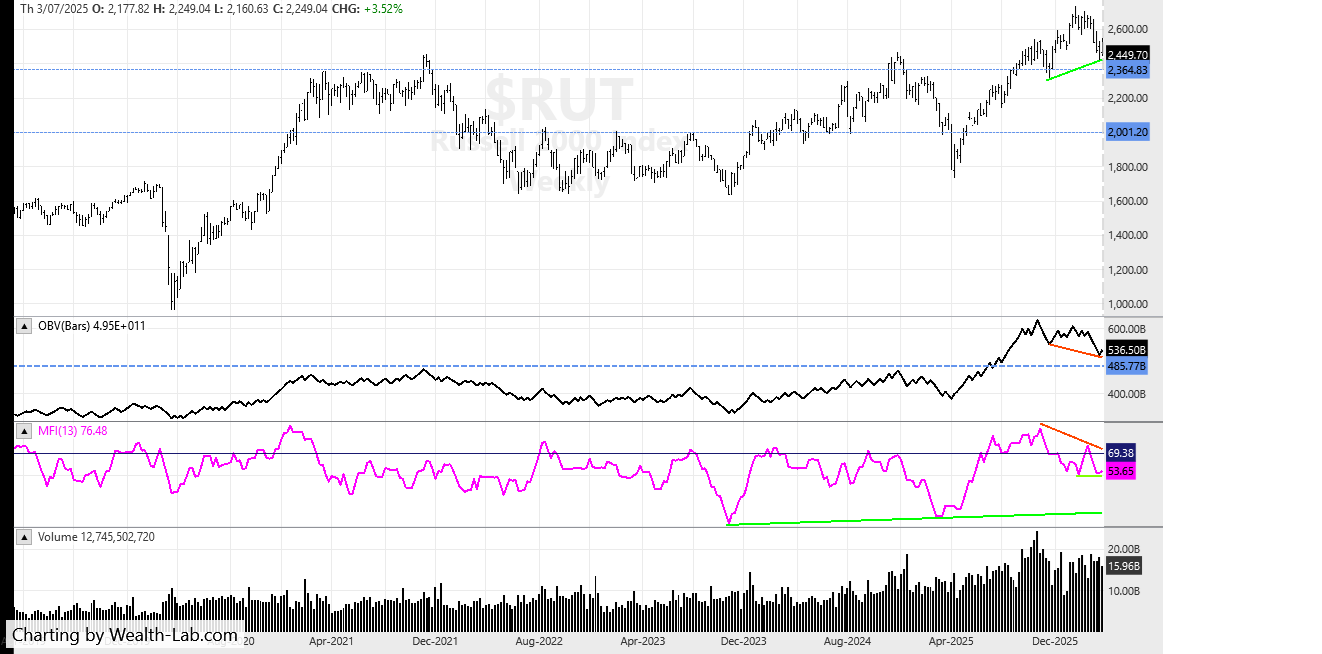
This week I am going to start with discussing the Russell 2000 in the US. I know many analysts look to the SP500 as the major benchmark, however the Russell has been the index many were hoping would benefit the most from Trumpian economics. So lets examine whats happening to see how it is coping.
The OBV is flashing a bearish divergence. The OBV is a powerful indicator and this does not bode well for the Russell 2000. First line of support is around 2364, then the next level is 2000.
The 13 period (one calendar quarter) is showing a meek double bottom of support. I use the word meek because an indicator that double bottoms is not a strong signal, a divergence is stronger, but a flat line double bottom now fighting against its big brother the OBV - the MFI will probably lose that fight.
You can also see how far the MFI could fall, way back down to its green bottom trend line - where the index price of 2000 awaits.
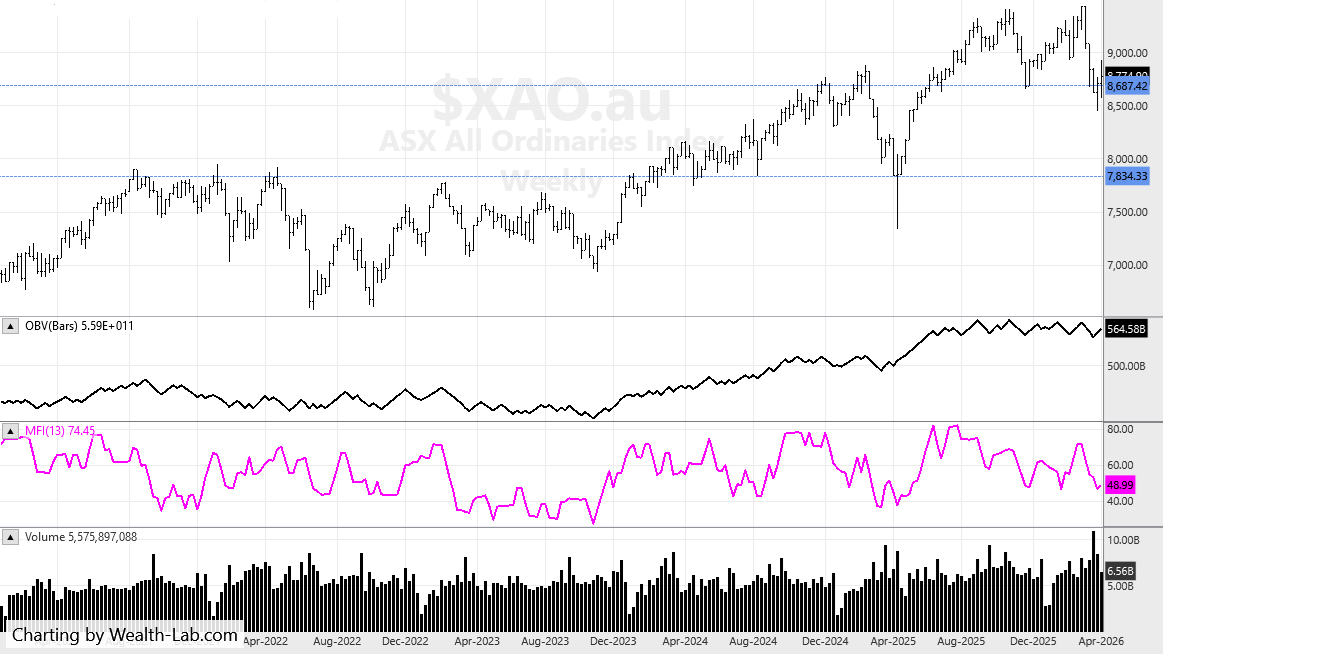
Now let us look at the Australian top 500, the XAO
Last week I said the OBV "was hanging in there". Now it is not, it is falling down with the price.
The bears are in control.
There is a saving grace - the MFI is not as weak as the one on the Russell. After all, these two indexes represent very different economies and we can not expect them to mirror each other perfectly, but unfortunately the XAO will be negatively affected by the indexes in the US and the Australian index will probably fall more.
As an indication to how bearish this market has become - in the Mindful system the alerts this week for the ASX 300 are showing 3 buys (two are oil stocks) and 18 sells.
That is not a misprint.
Until next week
Peter
52 week closing high alerts for 20/3/2026
ASX 100: ALD APA
ASX 100 - 300: (The Small Ords) VEA
ASX: 300 - 500: None
The exit used FOR THIS METHOD is the 5/12 EMA crossover. Therefore, some stocks will be re signalling a new high buy signal if they have been recently exited by using the 5/12 exit within the last 12 months. This is important and you need to understand this.
Of course the 5 EMA needs to be above the 12 EMA to make the 52 week high valid, (otherwise we would be selling straight away) nearly always this is the case, but rarely if a stock spikes it is not.
So to repeat, the rules are: USING WEEKLY PARAMETERS!
Entry:
Share price to make a 52 closing (or equal to) week high (when selecting a buy, favour the cheapest stock)
The 5 ema to be above the 12ema
Exit:
if the 5 ema crosses below the 12 ema
The above system contains no position sizing, bull or bear filters or fundamental stock selection, these are discussed and taught to private clients or at my courses.
If you want more information about the Mindful system, or my latest book The Zen Trader, click here
https://www.easysharetradingsystems.com.au/products-and-services/e-books
Market comments for 13th March 2026
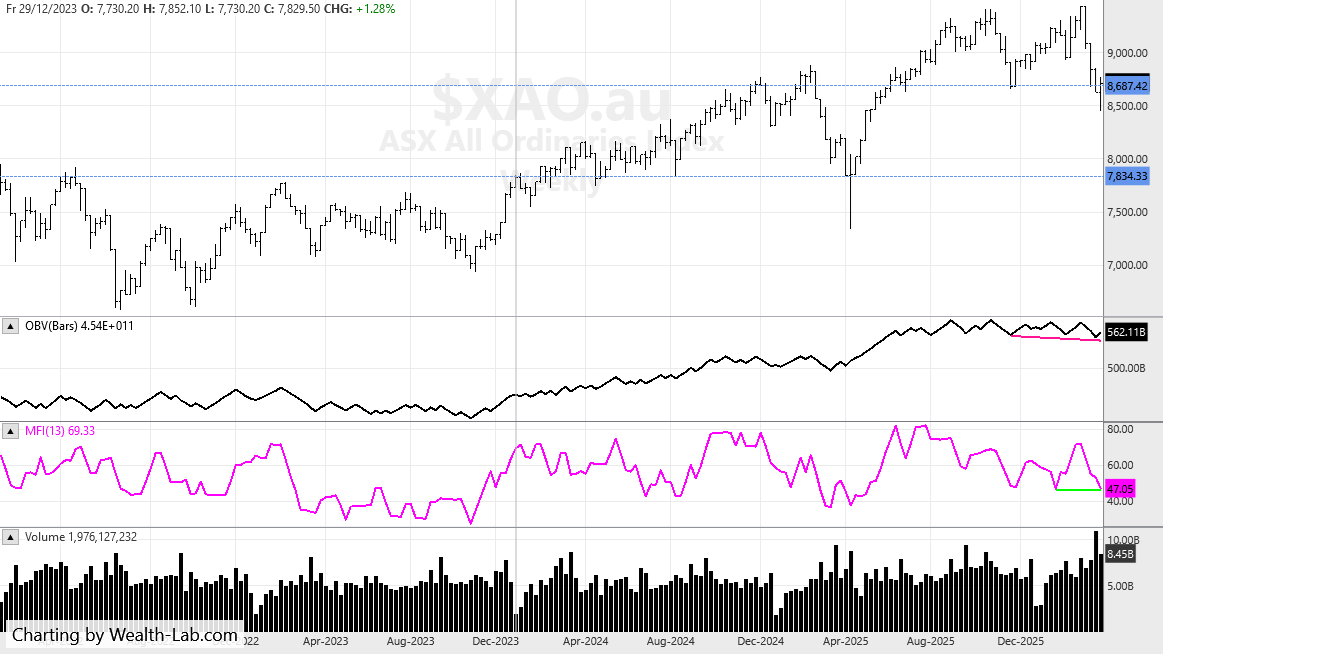
Comments below the chart
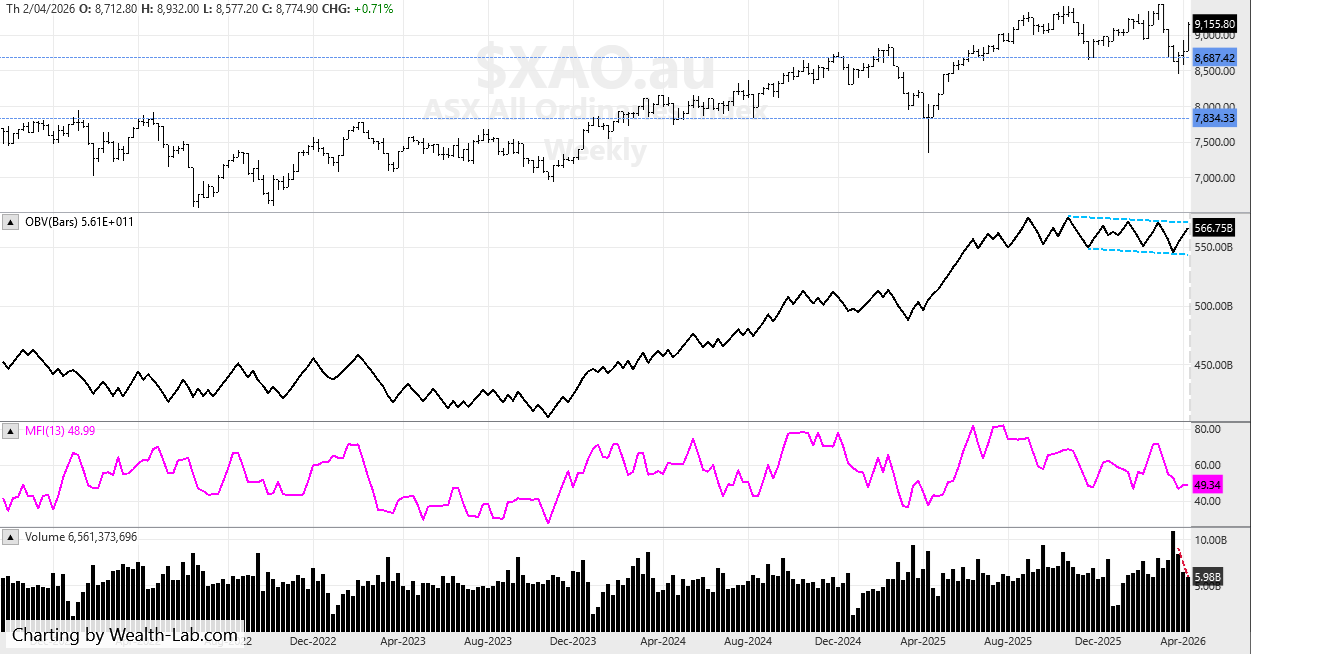
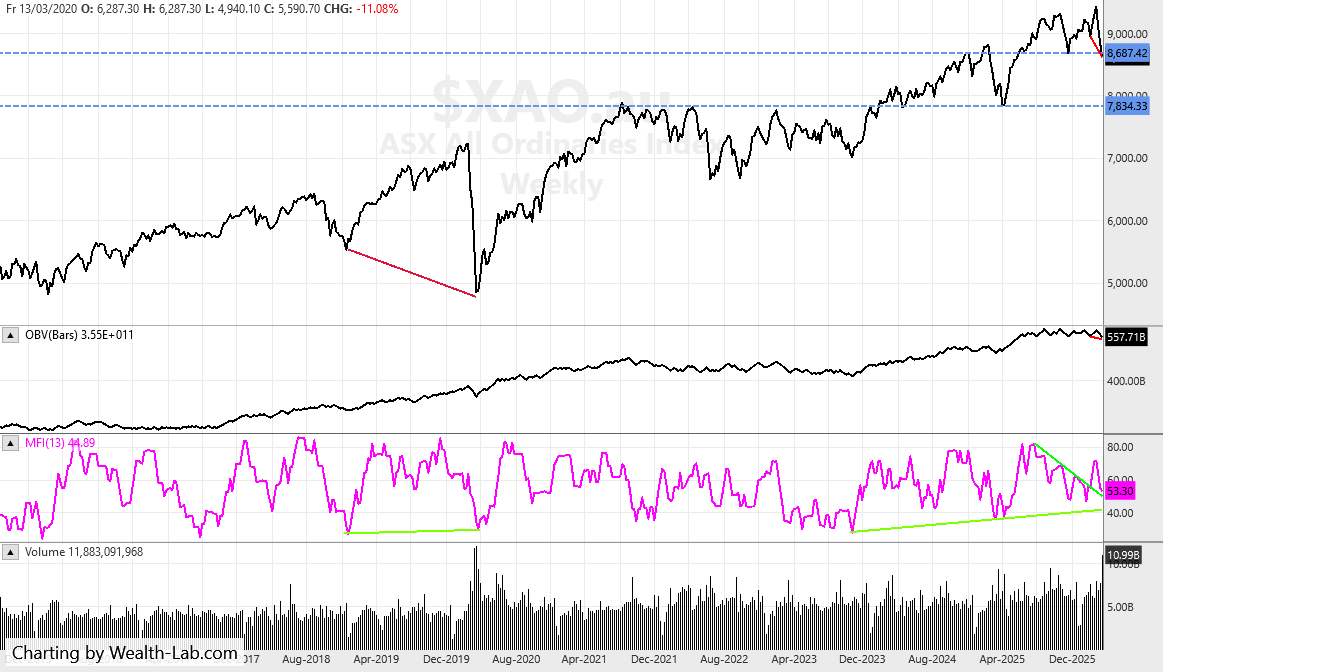
Above is a long term weekly chart of the Aus SP500. Let me start with the price before discussing volume indicators. Price is almost down to the 1st major support level around 8687. The 2nd level is 7834. These levels can be seen by looking at the blue horizontal lines on the chart.
The OBV is hanging in there, not yet showing signs of breaking down, but I suspect this will change if the price keeps falling. The MFI is pointing down. It looks like it wants to test at least the down trend re-test line, then the uptrend line - the one that started back in Aug 2023. Then perhaps fall all the way down to areas we saw during Covid falls in 2020 - the last time the world economy experienced a fear based sell off.
The main point to make here is this: A high probability buying opportunity won't come until we get a strong divergence between the 13 period MFI and the price. An example of this can be seen on the left hand side of the chart back around the Covid time. This divergence probably wont occur until the price does fall to around the 2nd support level of 7834. Now that will be another 10% fall from where we are now, and fear will possibly be at its peak.
This is a bearish looking chart and I have been stopped out of around 70% of my trades. There are a few 52 week highs this week, the ones benefiting from the current extreme situation. If you are a discretionary trader, its a time to be patient, and wait for the divergence I discussed. If you are a system trader, you are possibly mostly out of the market or close to it, depending on what your exit is. As an example, the Mindful system has sold out of around 50% of the 20 positions it normally holds.
Until next week
Peter
52 week closing high alerts for 13/3/2026
ASX 100: LYC
ASX 100 - 300: (The Small Ords) EOS YAL
ASX: 300 - 500: COI
The exit used FOR THIS METHOD is the 5/12 EMA crossover. Therefore, some stocks will be re signalling a new high buy signal if they have been recently exited by using the 5/12 exit within the last 12 months. This is important and you need to understand this.
Of course the 5 EMA needs to be above the 12 EMA to make the 52 week high valid, (otherwise we would be selling straight away) nearly always this is the case, but rarely if a stock spikes it is not.
So to repeat, the rules are: USING WEEKLY PARAMETERS!
Entry:
Share price to make a 52 closing (or equal to) week high (when selecting a buy, favour the cheapest stock)
The 5 ema to be above the 12ema
Exit:
if the 5 ema crosses below the 12 ema
The above system contains no position sizing, bull or bear filters or fundamental stock selection, these are discussed and taught to private clients or at my courses.
If you want more information about the Mindful system, or my latest book The Zen Trader, click here
https://www.easysharetradingsystems.com.au/products-and-services/e-books
Market comments for 16th Jan 2026
Comments below the chart
Recently I have had a few emails asking whats happened to my updates on this page. Also asking about my health.So thank you for your concerns and apart from a hectic year and some tiredness, I am well. I am undecided as to the future of this page and this website, as I focus more on system development and learning to incorporate AI into the process. Also of course my own trading as I continue to experiment with different methods and modalities to broaden my experience. All I can say is keep visting here for updates.
So, to the chart above. The index bounced well off long term support around 7700. The OBV is strong. The 13 period MFI is pointing down which would normally be a negative. However considering the Christmas and New Year holiday low volume period, I dont thinks its a concern. When the MFI down trend line breaks to the upside (perhaps I should say if) it will confirm what the price and OBV is saying, the trend is up. Perhaps its a little overbought in the short term so watching the MFI next week will give us a better idea.
52 week closing high alerts are below. The trend of the smaller stocks (outside the 100) dominating the market, continues.
Note: some stocks have re-enterd the system after being stopped during the market pullback to 7700. This is normal and to understand it better I suggest you read the explanation below the posted alerts section.
Peter
52 week closing high alerts for 16/1/2026
ASX 100: LNW
ASX 100 - 300: (The Small Ords) ASB BC8 CYL DRR DVP GWA NCK SMR
ASX: 300 - 500: BFL IMR
The exit used FOR THIS METHOD is the 5/12 EMA crossover. Therefore, some stocks will be re signalling a new high buy signal if they have been recently exited by using the 5/12 exit within the last 12 months. This is important and you need to understand this.
Of course the 5 EMA needs to be above the 12 EMA to make the 52 week high valid, (otherwise we would be selling straight away) nearly always this is the case, but rarely if a stock spikes it is not.
So to repeat, the rules are: USING WEEKLY PARAMETERS!
Entry:
Share price to make a 52 closing (or equal to) week high (when selecting a buy, favour the cheapest stock)
The 5 ema to be above the 12ema
Exit:
if the 5 ema crosses below the 12 ema
The above system contains no position sizing, bull or bear filters or fundamental stock selection, these are discussed and taught to private clients or at my courses.
If you want more information about the Mindful system, or my latest book The Zen Trader, click here
https://www.easysharetradingsystems.com.au/products-and-services/e-books
Market comments for 14th November 2025
Comments below the chart
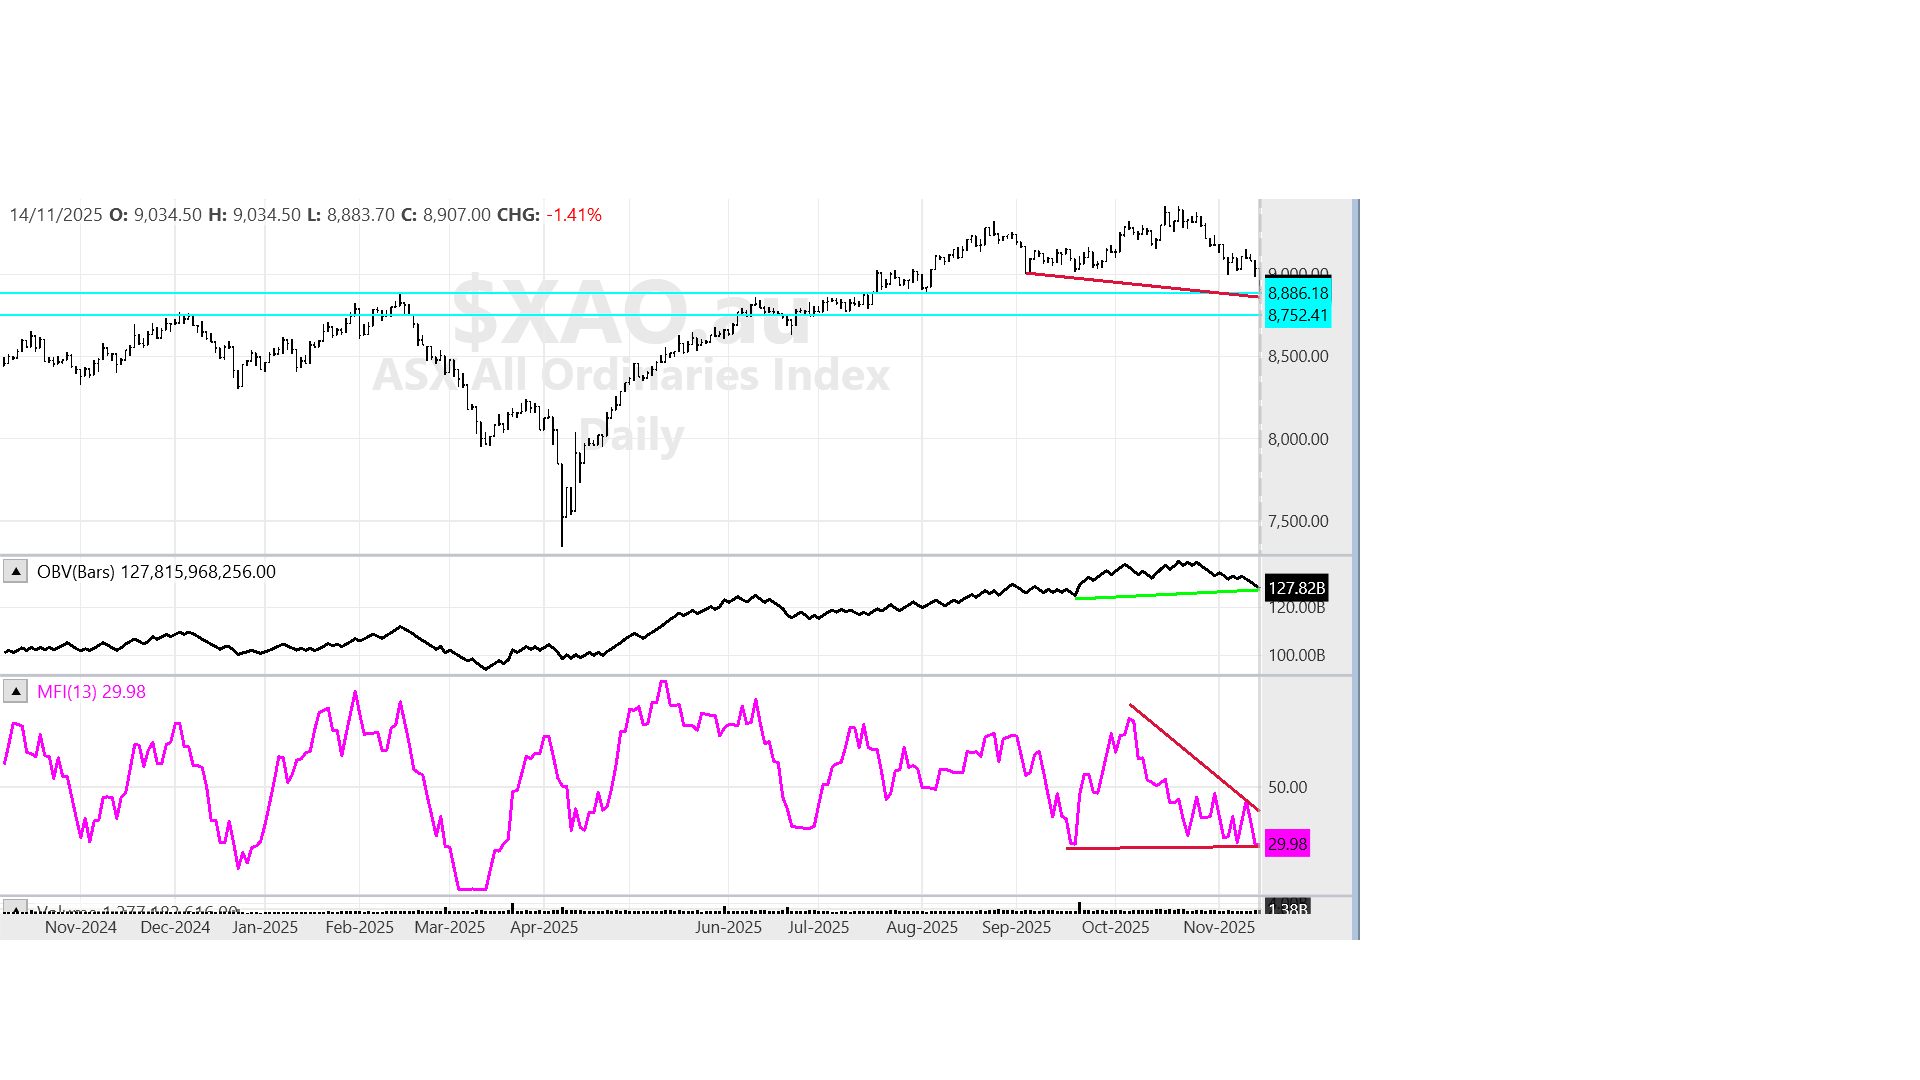
Last week I suggested we would have a bullish day on the Monday - we did, but the market fell away for the rest of the week. The XAO is now 8907 points, which is at the first blue support line I have drawn on the chart. The next support line is 8750.
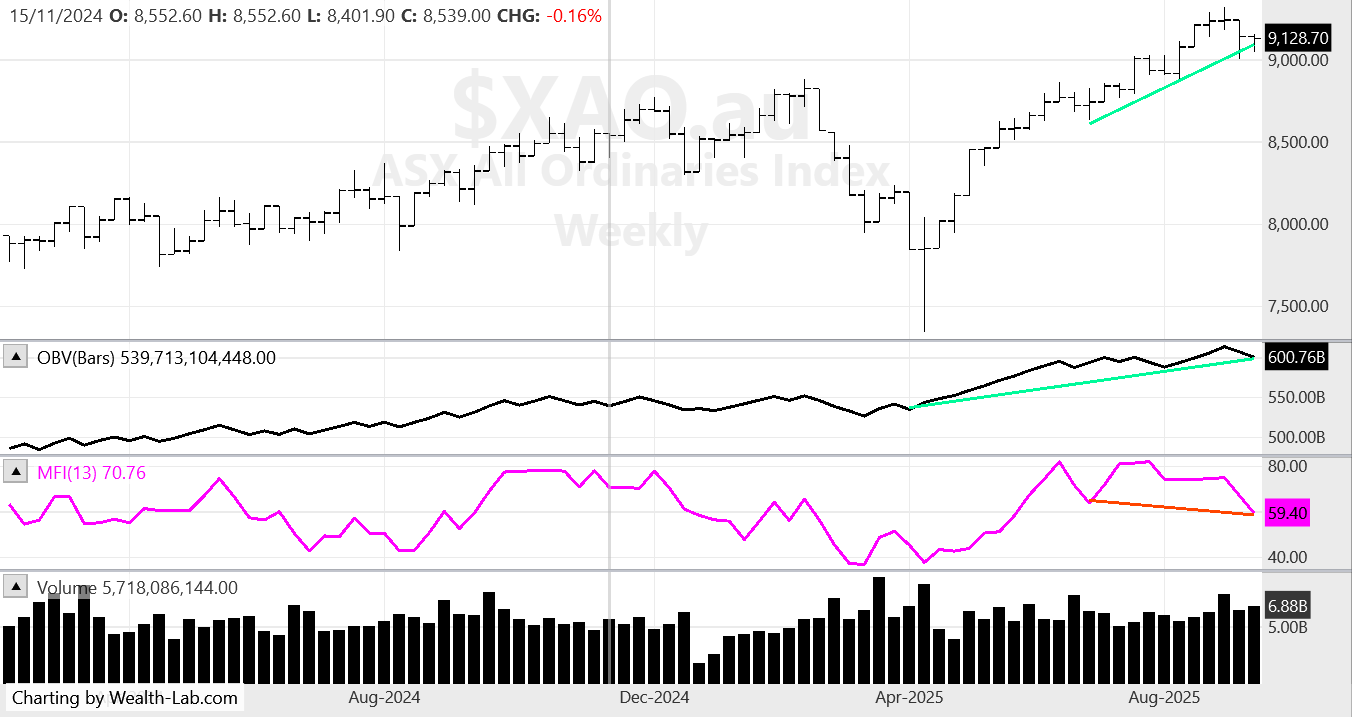
Volumes: we have some bullish support on the OBV, as can be seen by the green uptrend line opposing the red downtrend line on the index price. There are often "buts", and the but is that the MFI looks bearish - as it has been since it topped in early October.
On Friday in the US, the markets had another strong recovery after an intitial sell off, so we may get some positive price action on Monday in the XAO.
Metals had a strong week last week. The metals sector is one of the strongest in the market (as I discussed last week) so it was not a surprise some investors and traders went back into the sector at cheaper prices.
A comment about the 52 week high alerts this week: I have noticed the rotation (or more interest) in the small caps continues. This week just one alert in the 100 and one in the 100 - 300. But, (there is that word again) five alerts in the 300 to 500. See alerts below.
With "gorilla" stocks like CBA having a bad run of it, this is reflected in the XAO index, so perhaps not surprising some of the smaller caps are doing a little better as investment and trading money searches for higher returns.
Until next week
Peter
The exit used FOR THIS METHOD is the 5/12 EMA crossover. Therefore, some stocks will be re signalling a new high buy signal if they have been recently exited by using the 5/12 exit within the last 12 months. This is important and you need to understand this.
Of course the 5 EMA needs to be above the 12 EMA to make the 52 week high valid, (otherwise we would be selling straight away) nearly always this is the case, but rarely if a stock spikes it is not.
So to repeat, the rules are: USING WEEKLY PARAMETERS!
Entry:
Share price to make a 52 closing (or equal to) week high (when selecting a buy, favour the cheapest stock)
The 5 ema to be above the 12ema
Exit:
if the 5 ema crosses below the 12 ema
The above system contains no position sizing, bull or bear filters or fundamental stock selection, these are discussed and taught to private clients or at my courses.
If you want more information about the Mindful system, or my latest book The Zen Trader, click here
https://www.easysharetradingsystems.com.au/products-and-services/e-books
52 week closing high alerts for 14/11/25
ASX 100: AZJ
ASX 100 - 300: (The Small Ords) BGA
ASX: 300 - 500: CEH ELV FCL GRX QAL
Market comments for 7th Nov 2025
I didn't realise it had been a month since my last update, however sometimes looking back over a longer time frame can show how things play out as we thought. Last month I said "The chart above shows a concerning down trend in the 13 period MFI"
I also said
"HOW FAR the market dips will be the clue to the strength of the metals sector"
So lets have a look at whats happening now -and the hard thing about technical analysis is that it is difficult to see things in real time, but much easier to see things later. Why is this? I think because our thoughts find it difficult to think things may change, so somehow we need to work on our thinking and ask some "what if" questions. So lets ask "what" if now by looking at the XAO chart again.
The chart above shows some bullish divergences on both the OBV and the MFI. Bear in mind, they are short term and may not hold, but it does suggest a bounce up. Also we know that the US market on Friday night had a good recovery session after being down but rallying into the close. This does suggest a bullish day in Australia on Monday.
Compare the chart below of the Materials sector to the one I posted a month ago and you can see the sell off this sector had. Despite the bearish looking MFI it has two positives. The OBV looks stong and the price is still within its healthy up trend line. So, it could sell of a little more or start to consolidate and rebuild for the next up move. I think the latter is more probable.
The gold stock sector also looks more positive. Despite a flat gold price hovering and holding around the 4,000 level, the gold stocks are starting to show some life after their recent sell off. Gold stocks tend to move BEFORE the gold price. I know this did not happen for a long time, particularly during the period where the gold price outperformed almost everything. However we may be returning to more "normal" times when the gold stocks give us a lead as to the direction of the gold price. Gold stock traders try to "front run" the gold price and this may be happening now.
Until next time,
Alerts below and not surprisingly a poor showing this week from the 52 week closing high stocks.
52 week closing high alerts for 7/11/25
ASX 100: None
ASX 100 - 300: (The Small Ords) TPG
ASX: 300 - 500: None
Market comments and 52 week high alerts for 10/10/25
It was a quiet week on the XAO. Actually the last 5 weeks shows not a lot of movement - but we know amongst some sectors there has been incedible price gains. This week did not produce many alerts although still more action in the smaller end of the market, as can be seen in the alerts below.
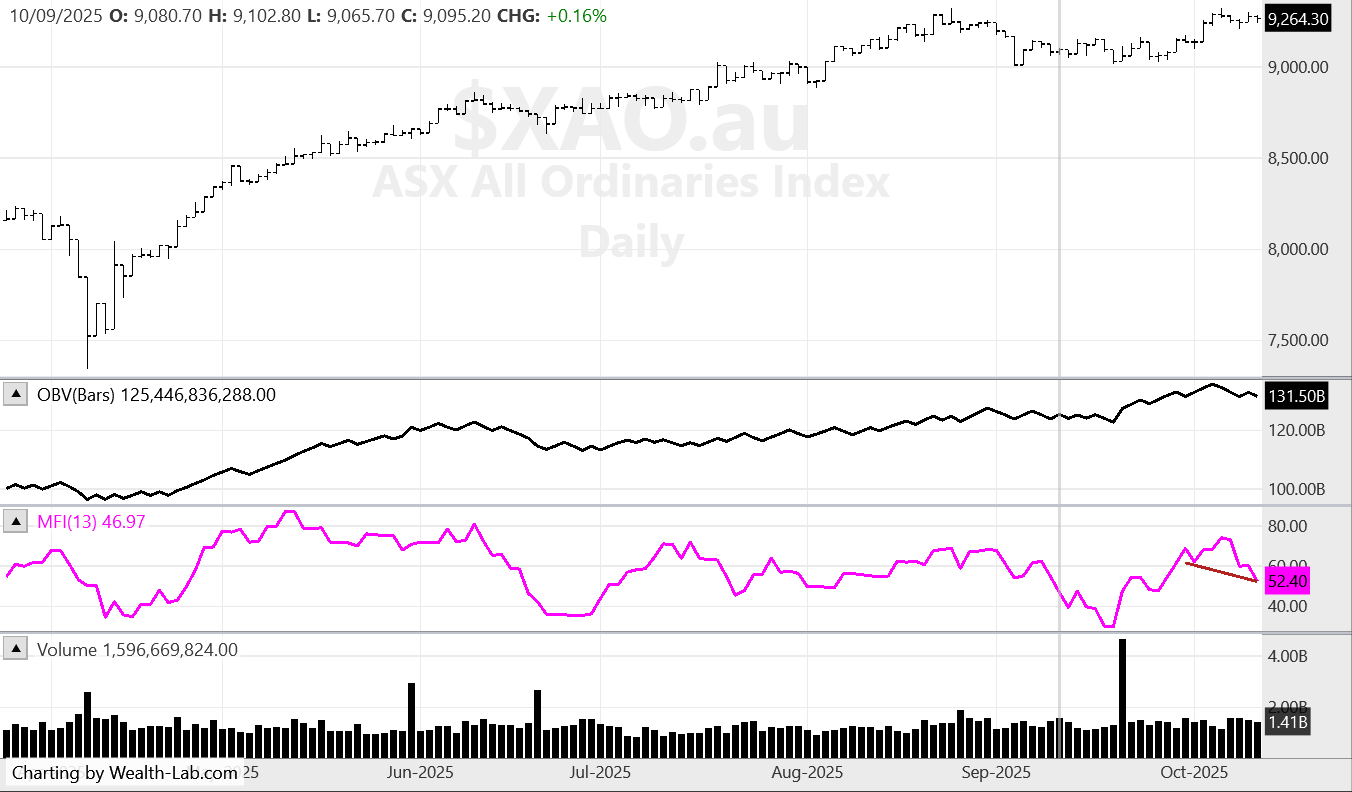
The chart above shows a concerning down trend in the 13 period MFI. The OBV looks ok but the MFI is the more dynamic indicator and tends to move up or down first, sometimes being able to give us an early warning of things to come. I am sure most of you know the US markets had a hefty fall on Friday night - after Trump threatening more tariffs on China. This could be political/transactional politics before his meeting with Chi regarding rare earth supplies (and other things).
So it remains to be seen how the XAO reacts this week. The markets have been on a tear (particularly metals) and this correction could be the time to buy the dip. In FOMO markets dips tend to be bought. I am sure there are many investors on the sidelines waiting for a chance to buy into the metals market.
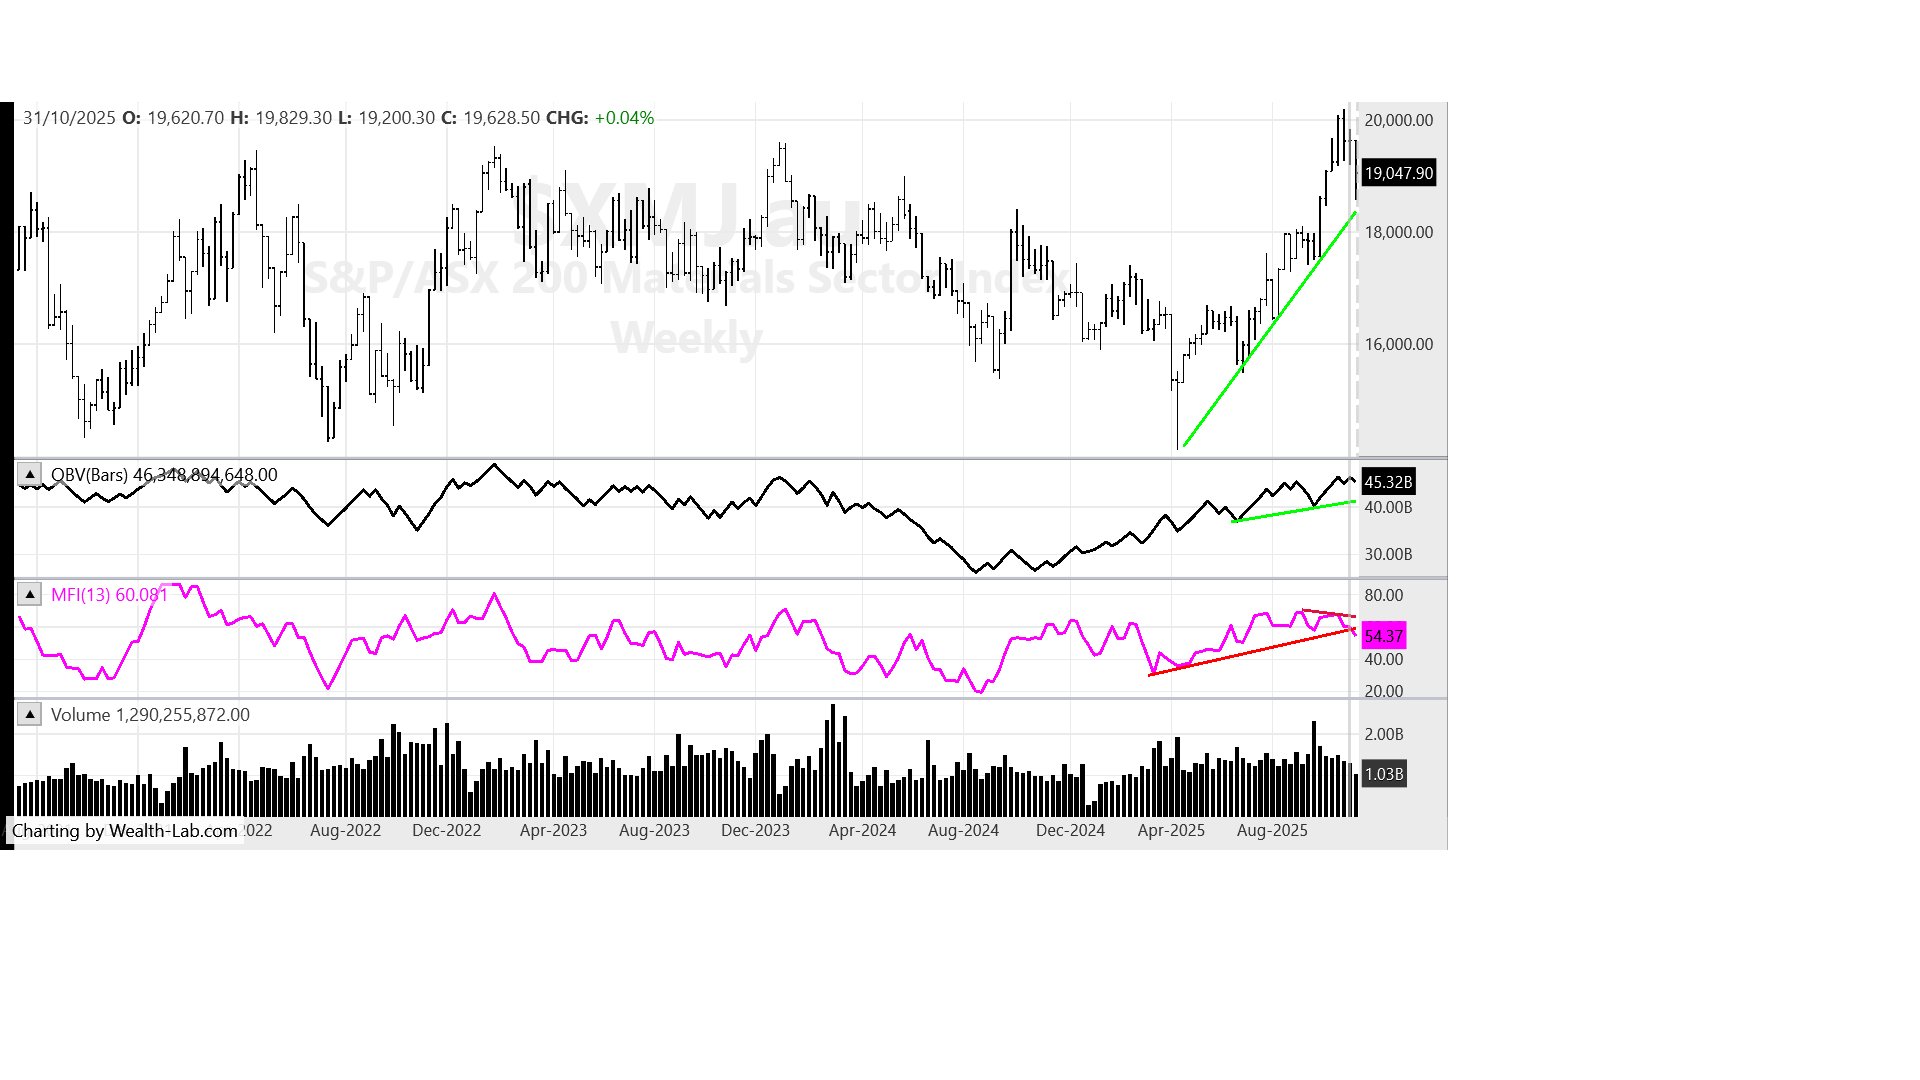
HOW FAR the market dips will be the clue to the strength of the metals sector. If it gets re-bought quickly then new highs are probable, however if it falls fast, hard and far, this could be the end of that rally for a while. For example, I will discuss the Materials sector below.
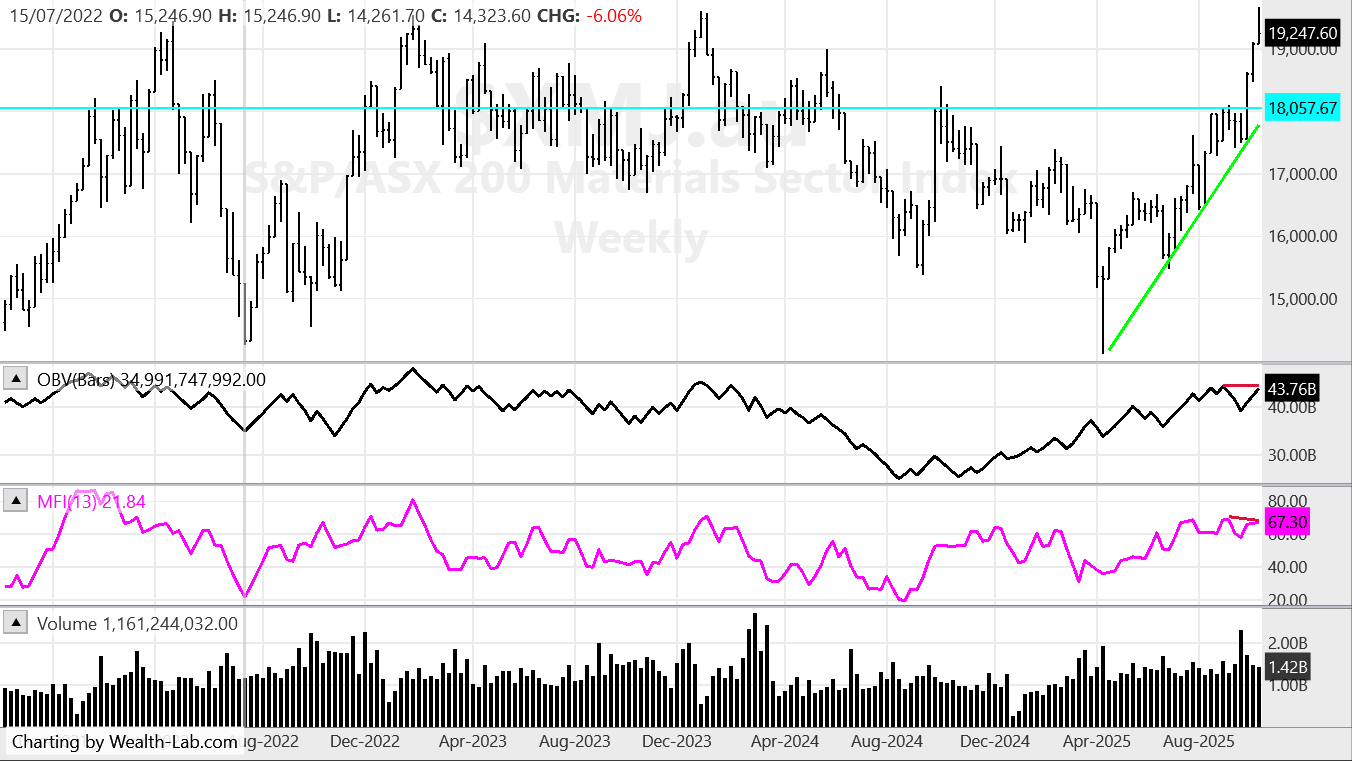
This sector has had a strong rally (like many sectors) from the Trump tariff low in April. However you can see its labouring to take out the significant resistance around the 19500 level. The OBV is level, and the MFI is pointing down (bearish). But we know this is the "story" sector with all the narrative around metals, gold, energy, lithium, uranium etc etc. If this sector pulls back and respects the support and resistance lines, and then regathers steam, it could be in for further upside, even a new all time high. But if it falls far and hard, then that's a different matter and a reassessment of the bullish "story" may be needed.
This paragraph will be a test of who reads this page (and get this far). I am thinking of running a Zoom meeting to discuss trading and the markets in general. Please email me if you are interested at
This email address is being protected from spambots. You need JavaScript enabled to view it.
Until next week
Peter
52 week closing high alerts for 10/10/25
ASX 100: None
ASX 100 - 300: (The Small Ords) PDI
ASX: 300 - 500: ARU L1G SYL SYR
Market comments and 52 week high alerts for 3/10/25
The XAO continues higher, with solid breadth (12 alerts) amongst the 100, 200 to 300 and the 300 to 500, see alerts below. Also I notice the XAO has made a closing all time high - by just 4 points, but a closing high it is. Lets look at the Small Ords chart.
This sector looks similar to the XAO, very close to the ATH, there are some stocks in this sector performing very well. Here a few comments about other sectors.
Discretionary: had a strong week and is close to ATH
Energy: continues to struggle
Finance: had a strong week and is close to ATH
Gold: had another strong week - has been on a tear since making an ATH back in late August
Health: had a bounce this week after consistent falls, having been knocked around by the heavyweights CSL and PME. Some mid cap health stocks bounced hard.
Information Technology: a strong week and close to ATH
Materials sector: a strong week and close to ATH - but needs to break above some hefty past resistance going back 3.5 years
Industrials : a strong week and close to ATH
Real Estate: a strong week and close to ATH. Recently broke above long term resistance going back to 2020 - not a good sign for housing affordability
Consumer Staples: the down trend continues as the risk on mentality in other sectors prevail - this sector does well in defensive or recession times
Communications: has been trending well for a year now, appears to be consolidating after 6 weeks of falls.
Utilities: a down week but it is in a strong weekly uptrend
Ok, thats it from me. The risk on mentality prevails as everything is up apart from Staples and Energy. Health remains to be seen if the recovery continues.
Have a great week
Peter
52 week closing high alerts for 3/10/25
ASX 100: CWY DNL RIO
ASX 100 - 300: (The Small Ords) BVS BWP GGP NEC OBM WBT
ASX: 300 - 500: D2O TBN TTT
52 week closing high alerts for 26/9/25
ASX 100: NST
ASX 100 - 300: (The Small Ords) CHN CSC EMR FFM GNC ILU NXG SLX SX2 VGN
ASX: 300 - 500: CVL MLX
MARKET COMMENTS 19/9/25
Ok, a picture paints a thousand words - or should I say two pictures, the one above and the one below. Of course there is also the trusty 52 week high signals giving us more information. For some weeks now there have been less alerts in the big stocks and more (many more) in the smaller stocks. It is the same story this week (see alerts below).
I often say this: the XAO chart above shows the top 500 stocks in Australia - but its dominated by the Gorilla stocks in the top 100 (mostly the the top 20). Over the last few weeks and now months, there has been a rotation out of Gorillas to Monkey stocks. Smaller stocks can behave like monkeys, up and down and all over the place. When they run up the tree they run hard, but can come flying down just as quick.
Comparing the two charts you can see the 500 (dominated by Gorillas) has been slowing, but the Small Ords (the chart posted below) has been doing the opposite. Its now made an all time high while the other index has been falling.
However! It is now looking a little extended, the OBV is screaming up and the MFI is negatively diverging. Also, look at that huge volume bar last week - big volume bars like that often signal a short term high or a low. Look through the chart and see the big volume bars and how they often correspond with a turn in price.
I am not saying its time to panic, just bear in mind the trend the last 8 or so weeks has been a rotation from big to not so big. The top 100 into the 100 to 300. Can it continue? Probably yes - when a trend starts it often surprises to the upside but it could be a time for some consolidation or perhaps even a pullback in the Small Ords.
Lets see!
Until next week.
Peter
Market Comments 12/9/25
I am back from a 2 week cold, I just couldn't shake it, anyway, here we go with this weeks comments.
The XAO took a breather this week, as always this chart does not reflect whats happening in other sectors. A few went up and a few went down, the stand out sector has been Gold but financials and Real Estate did ok as well. If you want more info on sectors have a look here. Its a good idea to see where the strength is in the market.
https://www.asx.com.au/markets/trade-our-cash-market/overview/indices/real-time-indices
Another way of course is to take note of stocks making 52 week highs, stocks within sectors tend to move together.
The chart above shows the price pullback during the last 2 weeks, the OBV is resting on its trend line and the MFI is pointing down, showing a negative divergence. You can see over the recent 12-14 weeks the MFI was not going up with the price, indicating an overbought situation was happening and increasing the chance of a pullback.
However pullbacks can just be a rotation from one sector to another, as mentioned, the gold sector went nuts and other sectors found support while some fell. Sooner or later the gold sector will be overbought too and it will pull back. See the chart below to see what I mean.
The chart above does represent the major gold stocks on the ASX, as you can see it looks overdone but as I often say trends can surprise to the upside. This week 7 of the 8 alerts are gold stocks. I still think the junior gold stocks have more room to move up as they have lagged the performance of the bigger companies.
If you look in the 52 week high alerts this week, you can see some smaller gold and silver stocks making yearly highs now, where as the bigger companies did this many months ago (some a year ago). If I do a scan across the whole market (1762 stocks) I get 29 fifty two week high alerts, 90% of those are miners. And! that's not including stocks under 10 cents - if I include those I get another 8 alerts.
So, we know where the love is!
Until next week,
Peter
Market Comments 29/8/25
The All Ords just keeps grinding higher. Please have a look at the alerts this week - you can see the smaller stocks are dominating the new high list. A rotation from the gorilla stocks into the mid and small caps, was something talked about a lot over the last few months, by others and myself, often here on this page. Now, it's clearly happening. Please go down to the next chart.
The Small Ords has made an all time high (ATH). The OBV made an ATH back in mid June, giving us an indication that price may follow. There is still some bearish divergence from the more dynamic MFI, as I have drawn on the chart above. However this is a very strong market and apart from a bit of daily and intra week volatility, it does appear that it just wants to continue going up. The MFI is at a level of 68 and its been at 90 previously - think about that :)
Gold: The gold price has been in a consolidation pattern for a few months now but on Friday in the US it broke higher. Gold stocks responded by rising nearly 5%. This should spill over into the gold and resource stocks here in Australia - further supporting the rotation from gorillas to smaller primates.
Alerts below, apologies for missing last week, I had the flu.
Regards
Peter
This weeks 52 week high alerts for 29/8/25
ASX 100: COL
ASX 100 - 300: (The Small Ords) CYL KLS LOV RMS SDR SIQ WAF WGX
ASX: 300 - 500: DUR SMP SPZ SVR
Market Comments 15/8/25
So the index continues to rally, ignoring any bearish indicators. It goes to show that "price is the ultimate indicator". I have posted two charts above, one weekly, one daily. The weekly chart clearly shows volume divergence and a double topping of the OBV. However the daily chart has broken up past the 10 day MFI - but, its still double topping the OBV.
Something I have been mentioning for some time now is the sneaky rally in the smaller cap stocks. This week in the alerts section I have split the grouping more, so you can see what I mean. There were 17 alerts in total this week, but only two 2 alerts from the top 100.
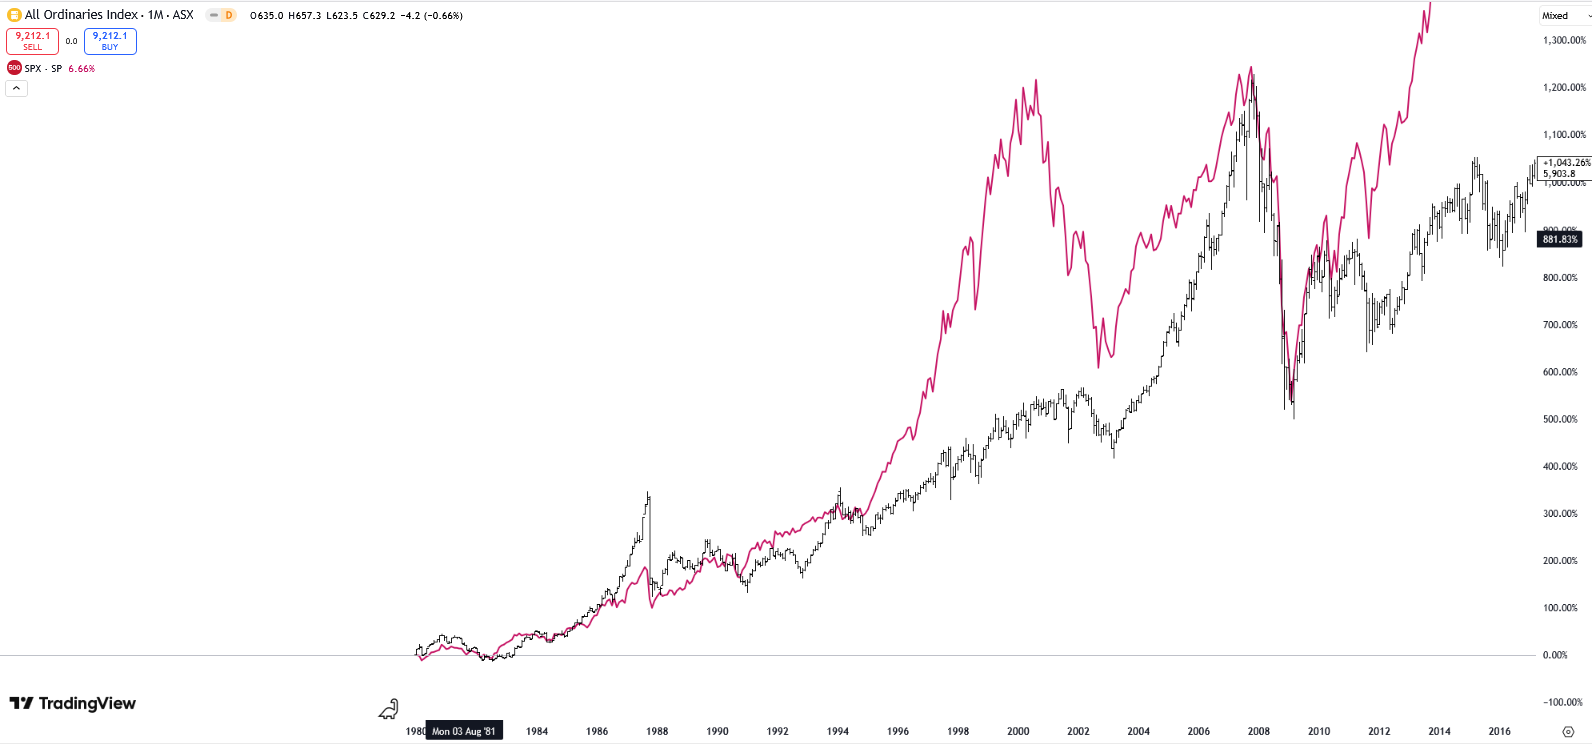
Also, another very important factor, something I have not seen since 2003 to 2007, is the rally in the Materials sector AND Financials and Industrials (and many other sectors) AT THE SAME TIME.
Often in the Australian market, many sectors don't boom together, its more of a rotation between sectors. However occasionally when we get the perfect storm for the Australian economy, the index can keep pace with the US market, which does not normally happen. It is unusual for the XAO to keep pace with the US market because we dont have the Tech heavy stocks. The chart below shows what I mean. The red line is the SPX, the black bar chart is the XAO. You can see how during 2003 to 2007 the XAO kept pace with the US, before then under performing for many years. Are we about to play catch up because all our sectors are rallying in unison?
Looking at the broad based rally happening at the moment, perhaps so.
Alerts below,
have a good week.
Peter
This weeks 52 week high alerts for 15/8/25
ASX 300: ANZ HDN MAF MYS TUA TYR WBC
ASX 100 - 300: The Small Ords: HDN MAF MYS TUA TYR
ASX: 300 - 500: BBN BIS C79 CXO DXC FEX NGI PWR SXE XRF
Market Comments 8/8/25
This chart still looks over bought to me. Scroll down to the daily chart below, where the over bought condition looks more obvious.
Hmm, well the market made a fool of me last week, I was saying the probability was it would fall - but it went up. And! there were 12 buy alerts in the Mindful system in the ASX 500 (see below)
I did notice last night in the US that the Nasdaq rose but the DOW, SPX and Russell all lagged. So maybe the Nasdaq can drag the other indexes up. I have to run - soccer duty calls, come back later for more charts.
Lets watch that 10 MFI closely to see if it breaks back up.
Peter
This weeks 52 week high alerts for 8/8/25
ASX 300: AMP COF CQE DRR GPT GWA IMD
ASX: 300 - 500: ALK ASL BTL JMS LFG
Market Comments 1/8/25
I have an updated charting package, so the chart has a slightly different look.
This week I will go straight to the daily chart as I think at the moment, it is arguably the most telling of what the index is doing. You can read my comments about the weekly chart and longer term picture - by reading last weeks comments. I did comment last week "volumes look stretched".
Going back to the daily chart above, its very easy to see the bearish divergence on the volume indicators. The MFI is using a short term 10 day (2 week trading period) and looks further to fall before reaching over sold (OS) levels. Those OS levels are shown by the red dotted horizonatal line.
You can see too that the OBV has further to fall before reaching its support trend line.
Price: as I often say is the ultimate indicator. Price has long term support at 8,800 points, (see horizontal green line) which is only 1.5% away from Fridays close. That 8,800 points is a very important line in the sand.
Another very important line in the sand is the OBV trend line. I would think for that to be reached, price would fall to around 8600 or 8500. If that line is breached I would have to reassess the situation to see if it had support or looked to fall further.
Coming back to the NOW, 8800 seems very likely in the short term - possibly as early as tomorrow (Monday 4th August).
Consider this too. We are now in early August. The Sell in May cyclical pattern was delayed by the Tariff recovery rally. However September can be a volatile and down month. Don't believe me. Look at the data and chart on this link
https://www.asx.com.au/blog/investor-update/2024/the--best--and-the--worst--months-for-shares
Also, price often moves in 6 week cycles - that's my experience of 30 years of trading. Have a look at the weekly chart from last week and see how often that happens, when price pauses after around 6 weeks. So, we could get a 6 week fall taking us up to early/mid October - when October normally rallies, and sometimes not until late in the month, in preparation for the seasonal Xmas rally. (note again the link posted)
Of course we can speculate until the "cows come home" but the bottom line is, that this market now looks under pressure and so we all need to be diligent in taking our stops - whatever levels they may be at. Despite all my opinions above, there were still buy signals in the Mindful system and they are listed below.
If you have managed to read this far (thank you) I have decided to post the weekly chart. You can see the 13 period MFI (one calendar quarter) and how high it is. If it was to fall to its lower levels like it did in April 2025, the index would be looking at around a 1,000 point fall. Ouch! You can clearly see the negative bias of traders over the last 2 weeks, shown by 2 red down bars - another ouch.
Have a great week, stick to your process and do what you need to stay physically, mentally and emotionally healthy,
Peter
If you want more information about the Mindful system, or my latest book The Zen Trader, click here
https://www.easysharetradingsystems.com.au/products-and-services/e-books
This weeks 52 week high alerts for 1/8/25
ASX 300: MMS NEU NHF STO
ASX: 300 - 500: SGLLV
Market Comments 25/7/25
A small reversal this week on the weekly chart, volumes still looked stretched. Also that was a big volume bar last week, with the bears winning the week as the close ended down towards the bottom of the bars range. I thought this week we might drill down into a daily chart - as the market appears to be at a critical juncture.
I realise that the XAO chart can be misleading as its governed by the large stocks. Particularly banks. If banks fall so does this chart, even though other sectors may be performing well. However on a daily chart, as is posted above, it looks to be under some pressure. The divergence between price and volume is obvious. However there is strong price support at the blue horizontal line and the OBV also has a strong upward trend line. Price may well fall to those levels mentioned and then continue the march onwards and upwards.
Here are a few comments about sectors: financials sold off, energy had another strong week, health had a very strong week, information technology eked out a small gain, materials had a very strong week (supporting the XAO index as banks fell), staples fell as the risk on mentality continues and property fell a little. Despite me willing it on, the Gold sector fell again this week, with the stand outs being the big miners.
Another standout sector was the Small Ords (the 100 to 300) the chart (not shown) looks stronger than the XAO - see alerts below. My explantion for this is it does not contain the big banks - but does contain many smaller resource and Tech companies.
Have a great week, alerts below.
This weeks 52 week high alerts for 25/7/25
ASX 300: ABB EBO HSN IPX LTR PNR PXA RMD WA1
ASX: 300 - 500: ECF FID MGX QOR SKS
Small Ords: All stocks in the 300 alerts section are in the Small Ords except RMD
Market Comments 18/7/25
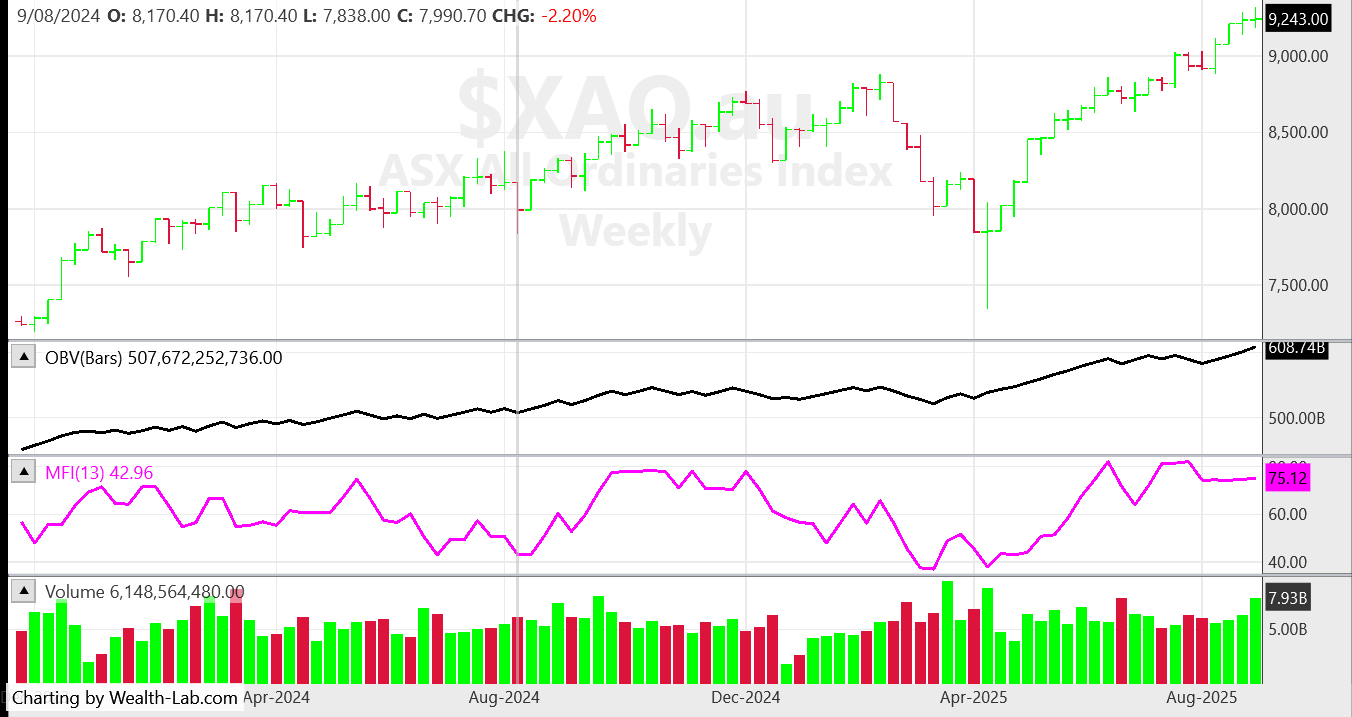
If ever there was a time to follow the saying "price is the ultimate indicator" it's probably now. The price continues to defy the indicators by breaking to a new all time high. Every sector went up this week (except gold) and health was the standout.
The index is high, it looks over bought, some indicators are diverging, double topping or not confirming the rally - but the price continues going up. I did say last week
" one would expect our index to hold up well, perhaps rally"
but the strength of the rally surprised me.
So, alerts are below, not much in the 300 this week but four in the 300 -500.
I will come back later and post a few more comments
Have a great weekend
Peter
Market Comments 11/7/25
When I ran the scan for the Mindful System on the ASX 500 today - there were 2 buy alerts and 15 sell alerts, so that gives you an idea of the current mood! Price action on the ASX 500 was ok this week, but you can see the MFI has double topped and the OBV has broken its strong uptrend to the downside. Also, we can see price double topped a few weeks ago.
Even though the index (ASX 500) is fairly steady, it doesn't show whats happening within the different sectors. Some sectors are falling but the index is being supported by the rotation into the Materials index, Utilities and Energy. I notice too the $A is holding up well, partly because of the surprise hold from the RBA but no doubt also because of the strong commodities market.
On Friday in the US the commodities rally continued with BHP and RIO (listed in the UK and US) both had strong performances. So one would expect our index to hold up well, perhaps rally. Gold and silver also rallied.
It remains to be seen if other sectors like Tech, Finance, Consumer and Industrials can hold up.
Have a great week and..........
If you want any more info just email me by going here.
https://www.easysharetradingsystems.com.au/contact-peter
If you didnt see last weeks post srcoll down for some interesting charts.
Here are the Alerts for this week below,
have a good week,
Peter
This weeks 52 week high alerts for 11/7/25
ASX 300: AEL BSL
ASX: 300 - 500: None this week
Market Comments: 4th July 2025
Apologies for skipping last week, I had a few website problems. on the weekly chart the market really looks like it wants to keep going up. Even though there is a slight divergence on the MFI, the OBV continues to point up. The other consideration for the bull argument is that the 52 WH system keeps pushing out signals, the 300 to 500 in particular is looking strong.
However, some negative news make take the steam out of this rally, so we will have to wait and see if that comes. Next week the RBA meet to decide on interest rates, one would think that will make an impact - one way or another.
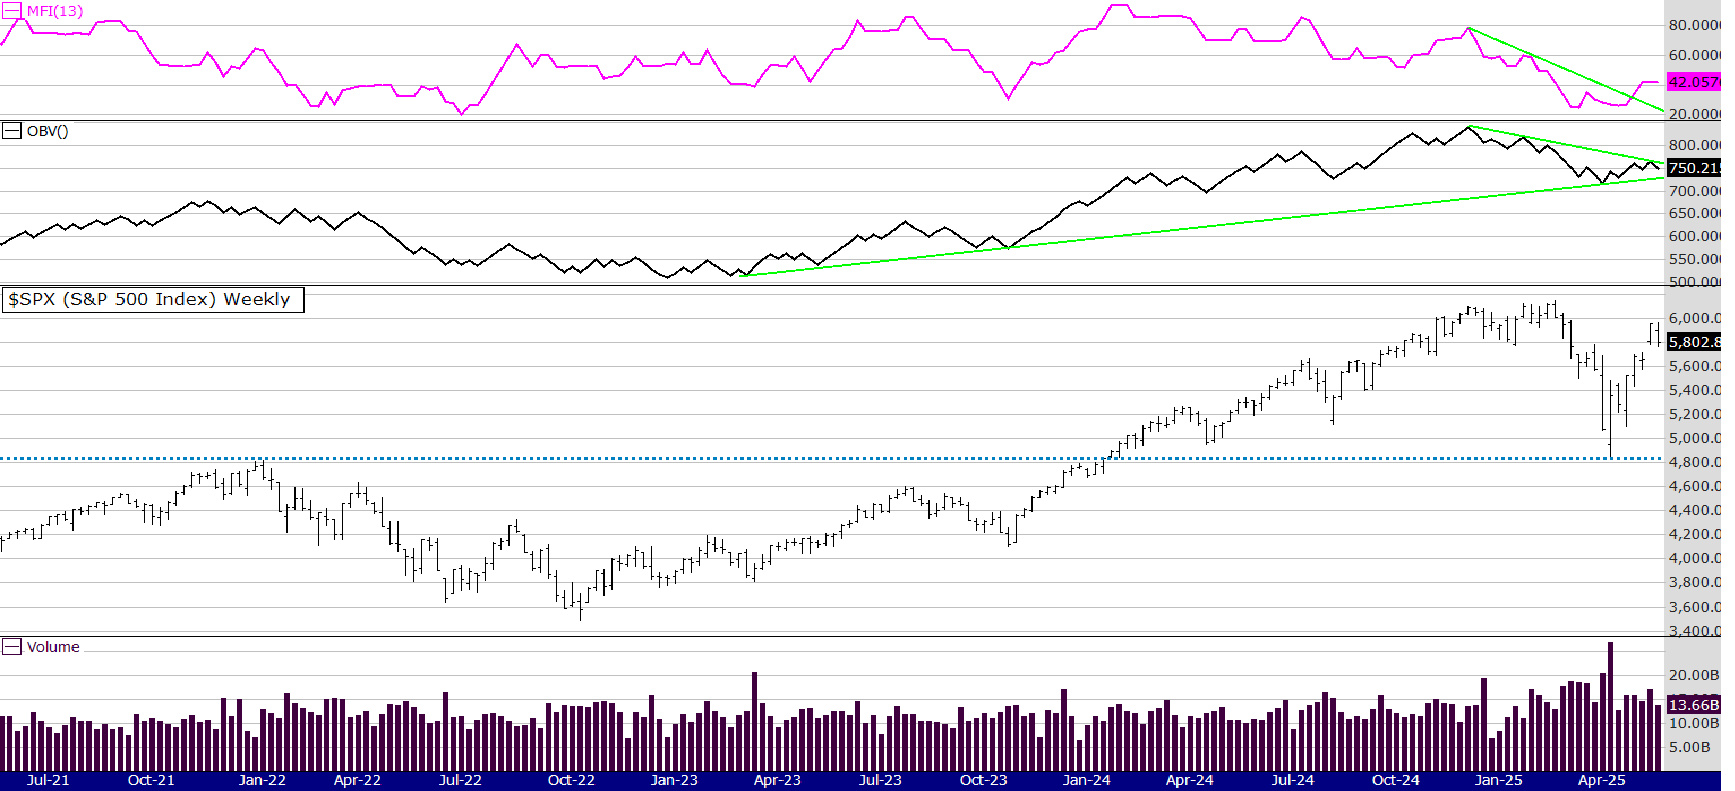
The chart below is a monthly of the SPX in the US. When I look at that I see what the bears are concerned about. Indicators are either diverging or at the top of their range. Nearly every time the CMF (Chaiken Money Flow) gets up to that high point, the market corrects. Its been an amazing rally the last 2 years and its makes one wonder how long it can last. Something I find concerning is all the bullish calls lately, "melt up" etc., always a red flag IMO.
All 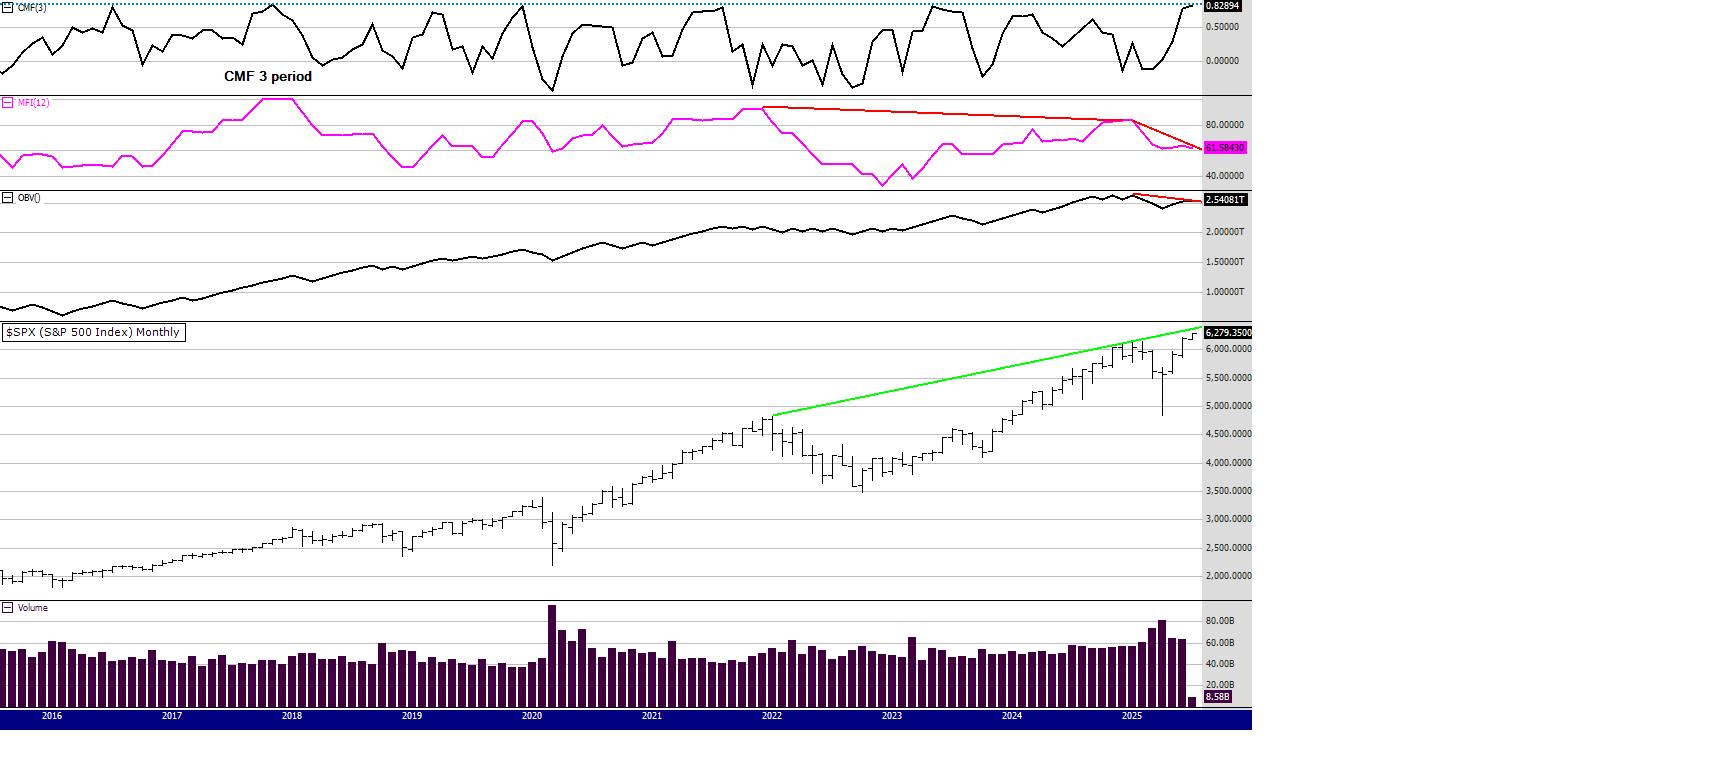
As you know I do teach a longer term approach - I call it medium term, attempting to balance between trading and investing. I posted some result charts for the last 2 years here on this link https://www.easysharetradingsystems.com.au/easy-share-trading-systems/peters-portfolio
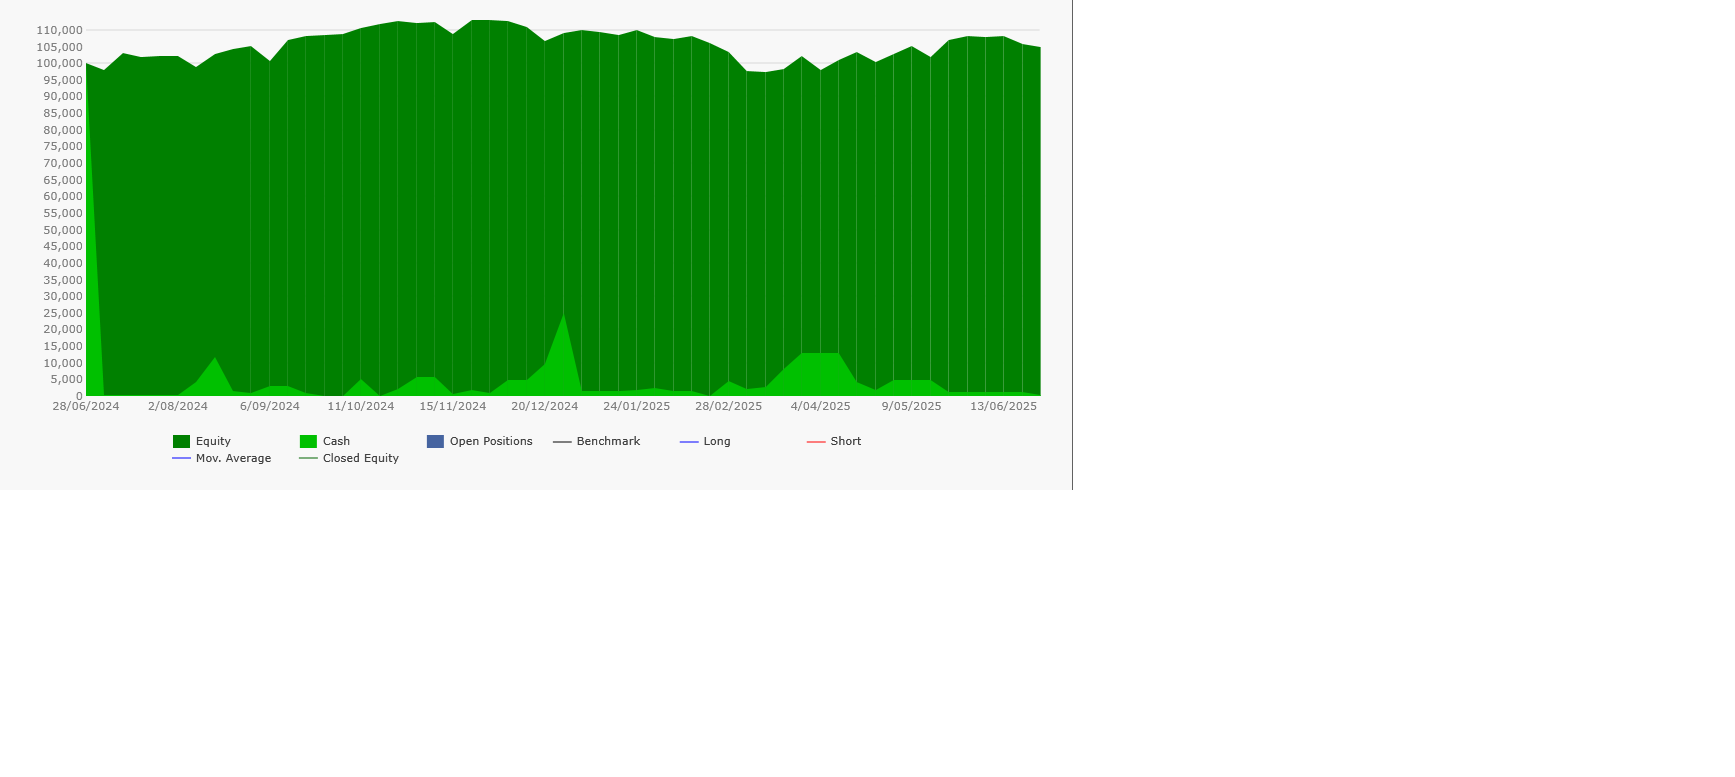
As well as charts on that link above, here are some more. The chart below is the Mindful system the last 12 months, not the best year up almost 10%, but bear in mind the year before was a cracker up nearly 85% (see the link above)
Keep scrolling down.
The chart below shows the last 12 months trading a list of fundamental shares (information withheld for private clients) up 35% for the year. Same system, same sizing, same entry, same exit, just a different stock list.
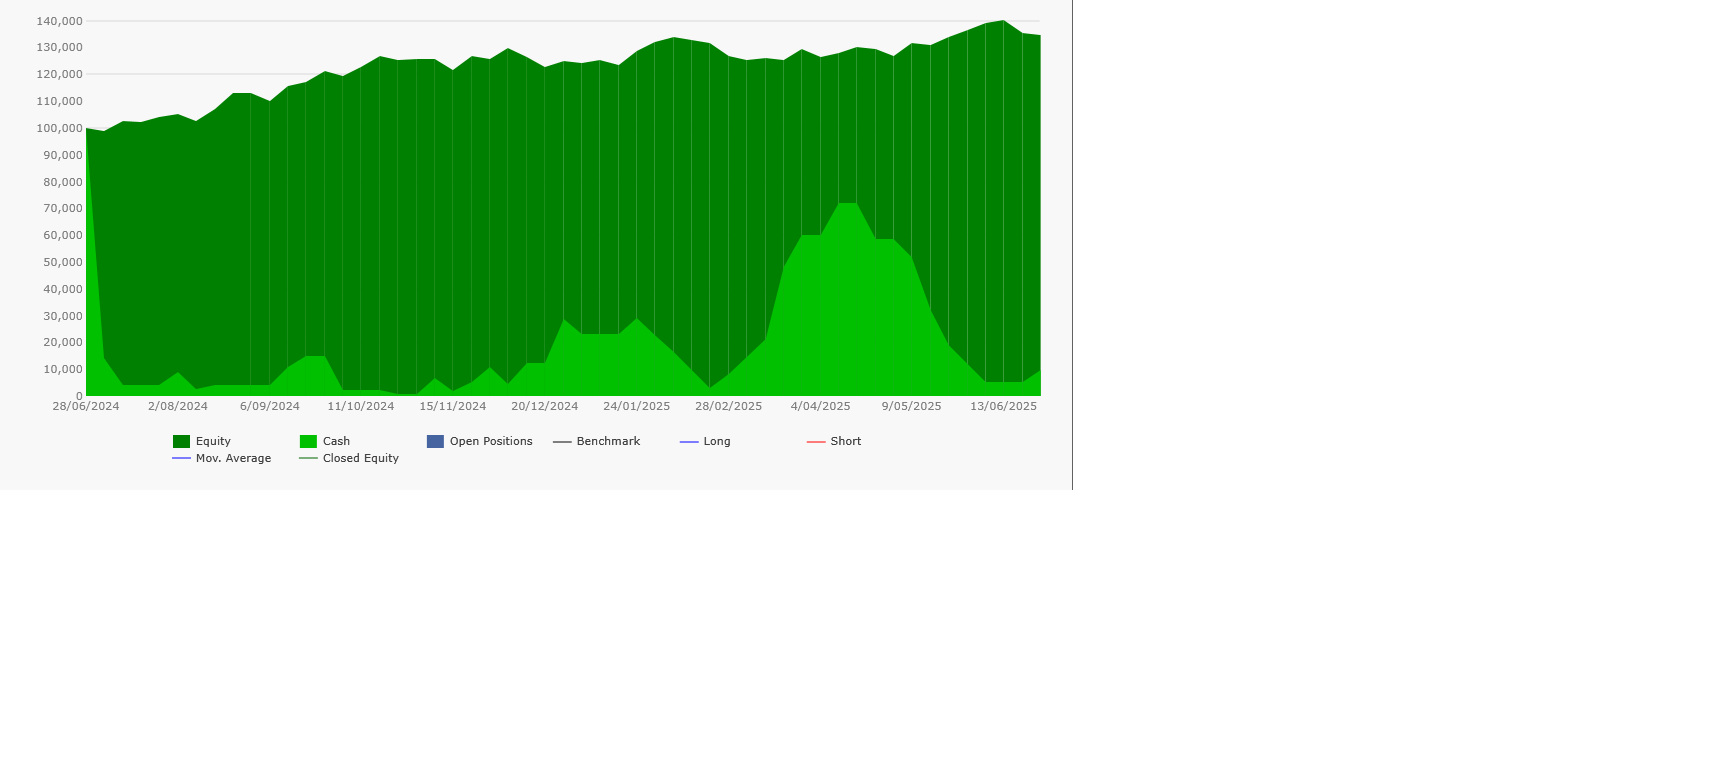
Its the same old story, have a system that has a positive expectancy (like the Mindful system or similar) learn how pick good stocks, work on your psychology and how to mange the trades. Its simple but at times not easy.
If you want any more info just email me by going here
https://www.easysharetradingsystems.com.au/contact-peter
Here are the Alerts for this week below,
have a good week,
Peter
This weeks 52 week high alerts for 4/7/25
ASX 300: PME RUL SCG
ASX: 300 - 500: 3DA CBO GDF LGI MAD URF
Market Comments: 20th June 2025
The chart above is a live chart as of 3.30 pm Monday 23rd June - when I am writing these comments. However as I said last week, it did appear the market looked ripe for a pullback (see last weeks comments below) and with the latest news coming from the Middle East, the trend appears to be coming down - at least in the short term until the charts give us more information.
Looking at the chart above you can see the MFI was overbought and could fall to the 35 area before reaching oversold areas. The OBV is still trending up well but can fall more before it reaches its uptrend support line. The price double topped, and has a possible magnet of around 8000 where there is lots of horizontal support - where I have drawn the blue dotted line. That blue line also meets the green uptrend line - which I have drawn through the weekly closes, not just the weekly bar lows. If I drew the line through the weekly bar low points it reduces support to around 7600, with all that price and volume support at 8000, let's revisit that scenario if it happens.
Trading is about probability and when we consider the short term overbought status of the market, the time of year and the troubles in the Middle East, the probability remains high the XAO index will keep pulling back. But! anything can happen, some may remember what happened in 2003 when the US invaded Iraq, the markets took off like a rocket. However, it had tread water for 3 years and once the uncertainty was over the market rallied. This market is coming off a double top and a V shaped rally so I think its fair to say its a little different scenario.
Markets dislike uncertainty and there is plenty around at the moment. Despite that, the 52 WH system still produced 7 signals this week and they are listed below.
Until next week
Peter
Market Comments: 13th June 2025
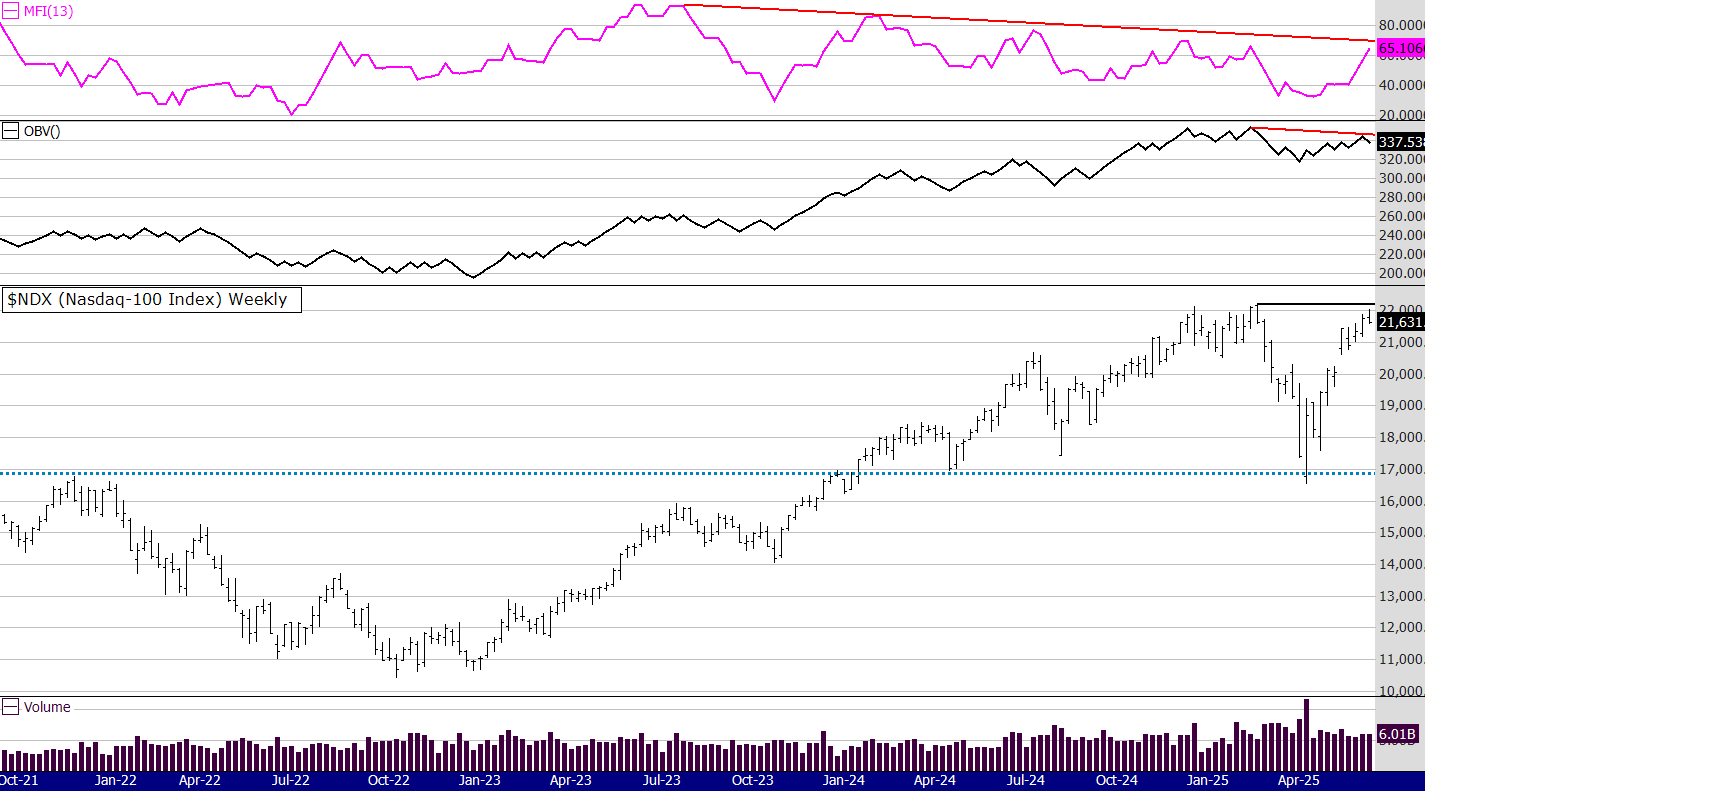
This week I have two charts to discuss, the ASX 500 (All Ords) and the Nasdaq. I have mentioned many times how the ASX 500 is a different index as it includes many banking and commodity stocks, the Nasdaq as we know, is mainly Tech stocks. So the two indexes will look and perform differently as the economic cycles change.
However the Nasdaq still effects many other global indexes and the ASX 500 is not immune to the fortunes of the large US indexes. When we compare the two indexes you can see the ASX volumes look more supportive, this makes sense from a fundamental perspective as we know there is currently a big interest in commodity stocks, from both growth (rare earths) and saftey (gold, oil) reasons.
However, the ASX 500 volume indicators are very extended to the upside and the price is double topping.
The Nasdaq is also double topping and the volume indicators are bearish. Does this mean a fall or even a crash? No. It means traders and investors are mindful that this rally has been hard and fast, uncertainty is still there (well, it always is), a pullback and some consolidation is likely more probable - than a continuation of the rally.
Its going to be interesting to see a few things
1/ if the market now pulls back
2/ how far it pulls back
3/ if it keeps going without a pullback
Trading is about probability and I think it will pull back, because we now have an overbought situation where as 10 weeks ago, we had oversold one (being mindful I could be wrong). I am talking about the indexes pulling back when I say that, individual stocks and sectors may well continue to power on.
The thing to watch will be the depth of the pullback, if its shallow and the market turns back up quickly, we may well get the melt up some are predicting. If the pullback is deeper and longer, the market will do its usual slowdown and consolidation for this time of year - and build for a rally around October to December.
Of course black swans can occur, the latest being the threat of an Israel/Iran conflict. That concern helped the gold sector this week, if you scroll down to last weeks comments, I covered that sector there.
Until next week,
Peter
Ths weeks 52 week high alerts for 13/6/25
ASX 300: KAR ORG RIC WGX
ASX: 300 - 500: CGS
Market Comments: 6th June 2025

What happened to Sell in May? What will it take for this recovery to slow down? Looking at the chart above and the positive divergence between price and volume - it appears the bulls are well in control. The MFI is sitting at a reading of 74, the over bought level is around 84, so one would "think" its getting a little over extended. Technically, a double top in price is very close and if there is to be a pause, some profit taking and some "waiting" for prices to fall so traders can reload, it may happen soon.
This is where the psychology of traders rules fundamentals. If the hype (maybe its not) around AI continues and things settle a bit in the US, we could get FOMO send the market on a new leg up. Also, looking at this data of stock seasonality, (click on link)
https://market-bulls.com/seasonal-tendency-market-charts/
you can see that July can be a very strong month.
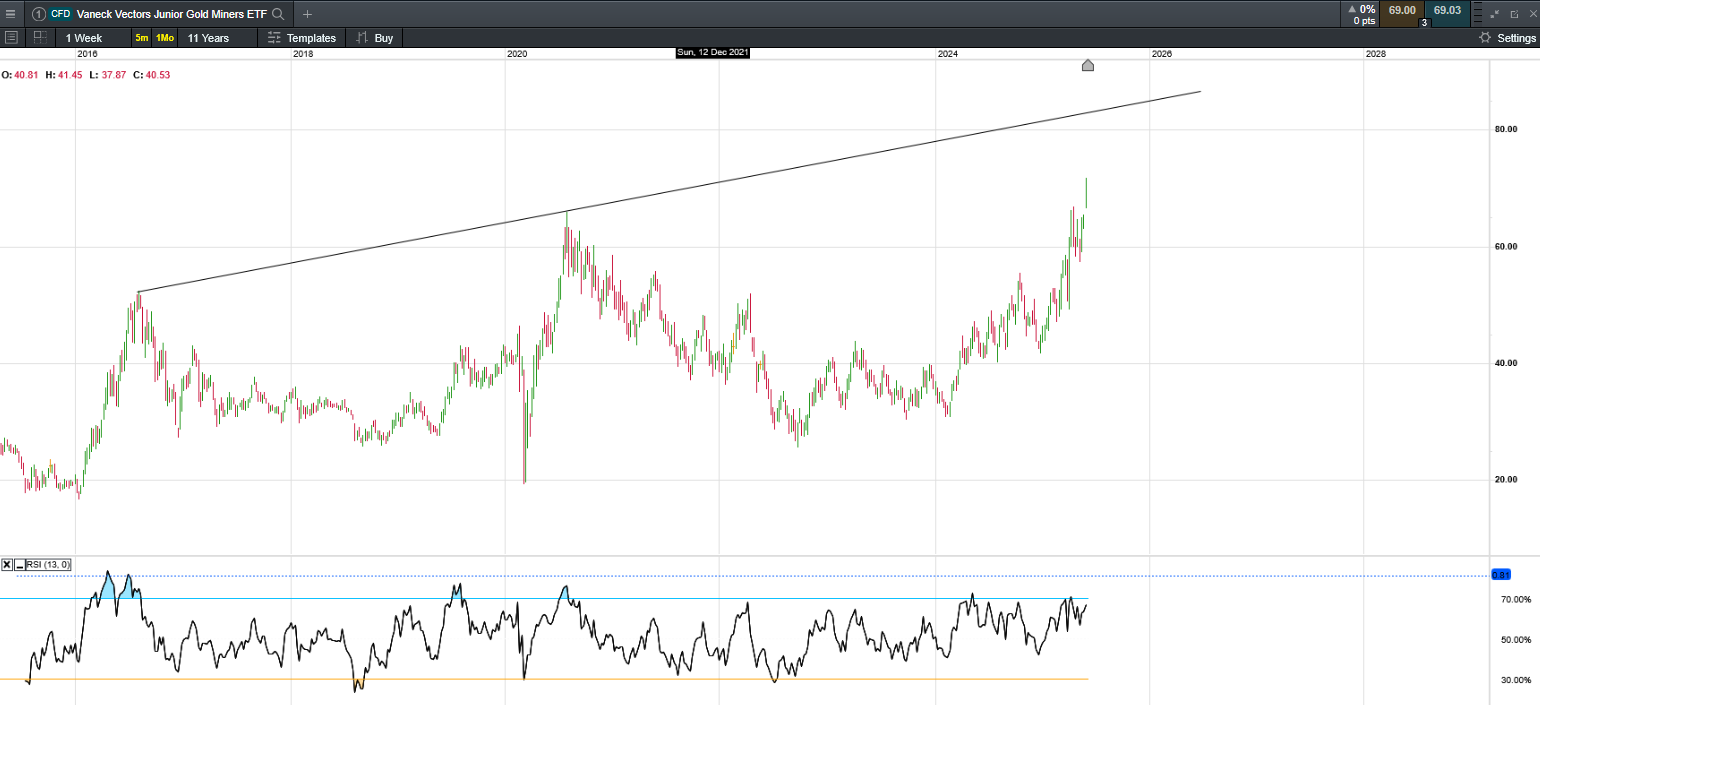
The Gold market: I notice the large and mid cap sector gold stocks are looking a little tired. (There are a few exceptions) Something that happens towards the final stages of a gold bull run is that junior stocks start to run hard. Look at this chart of the Vaneck Gold stock juniors in the US. It does not show it on the chart - but that's a 15 period RSI, representing 3 weeks of price action. As you can see its been a good run up in this sector, and why not? With gold still looking strong the stocks have (finally) responded. The other thing supporting the theory that the precious metals may be in the final stages (which can be the most dynamic) is the silver price. The silver price has recently made a new high and silver does not normally rally until gold is in its final stages.
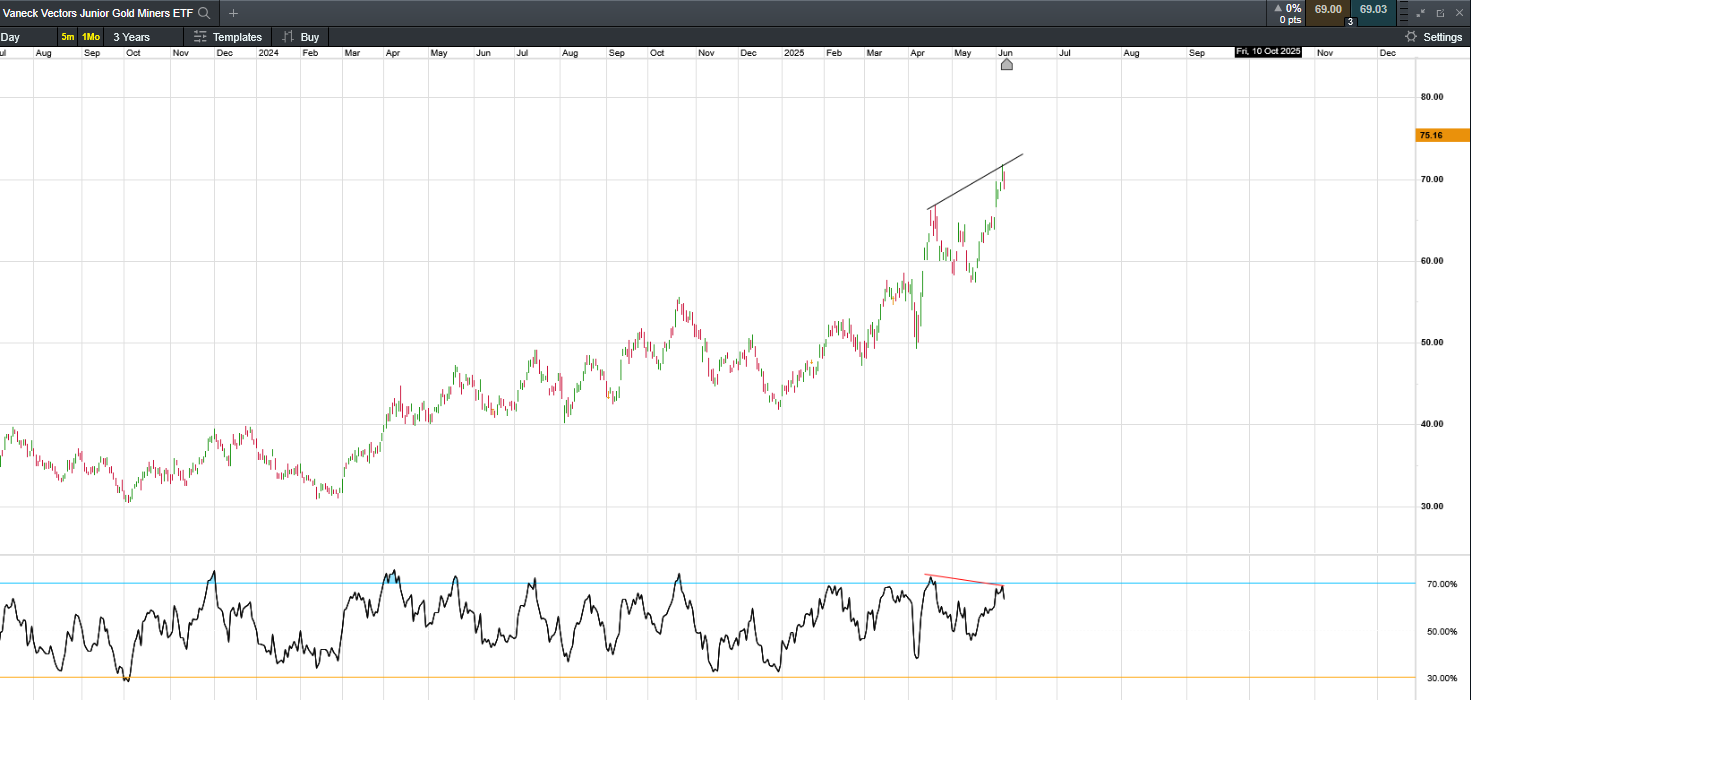
However! as I like to say - I wouldn't short it! A small divergence like the one above does not mean this cant go higher - much higher. The weekly chart below shows that.
until next week, Peter
Ths weeks 52 week high alerts for 6/6/25
ASX 300: ALX BKW SGH XRO
ASX: 300 - 500: EOS KSL QAL
Market Comments: 23rd May 2025
This week I have gone back to a chart with comments. I have missed the last few weeks and I will be missing again next weekend as I am away on a Zen retreat.
I remember saying I wanted to see a decisive break up on the volume indicators before I was convinced this rally had real merit. The chart above shows now we have that. The OBV has made an all time high and the MFI 13 has broken its downtrend. Also the 52 week high Mindful trading system continues to produce buy signals which is always a positive sign. Lets look at another chart from the US, the SP500.
This index does not look as strong to me as the ASX does. I was a little surprised this week to watch a video produced by Marcus Padley saying that the XAO was not the place to invest but he preferred the US. I do agree with him that for the ASX to outperform the US we need a resources rally. So I suppose that's the bet isnt it? Will the resources market continue to rise?
Anyway, getting back to the chart - even though the MFI looks positive the OBV looks line ball to bearish, and no where near as strong as the ASX. Also last weeks bar looks to be a reversal - but - low volume so perhaps not a lot of conviction yet from the bears.
We are now at a critical point IMO. The price and indicators are suggesting a pause in what has been a quick recovery from the Trump tariff sell off. We are in May (almost June) and seasonally its a bearish time for the market. The important thing to watch is that OBV on the SPX, if that breaks to the downside IMO it will be a bearish sign - for the US market anyway. The ASX could continue to peform if our banks and resource stocks hold up well.
So, I will be back in two weeks, in the mean time good luck and trade well.
Peter
Ths weeks 52 week high alerts for 23/5/25
ASX 300: ADT CDA CGF CLW PRN SRG VNT
ASX: 300 - 500: CDP MAU VNT
Market Comments: 2nd May 2025
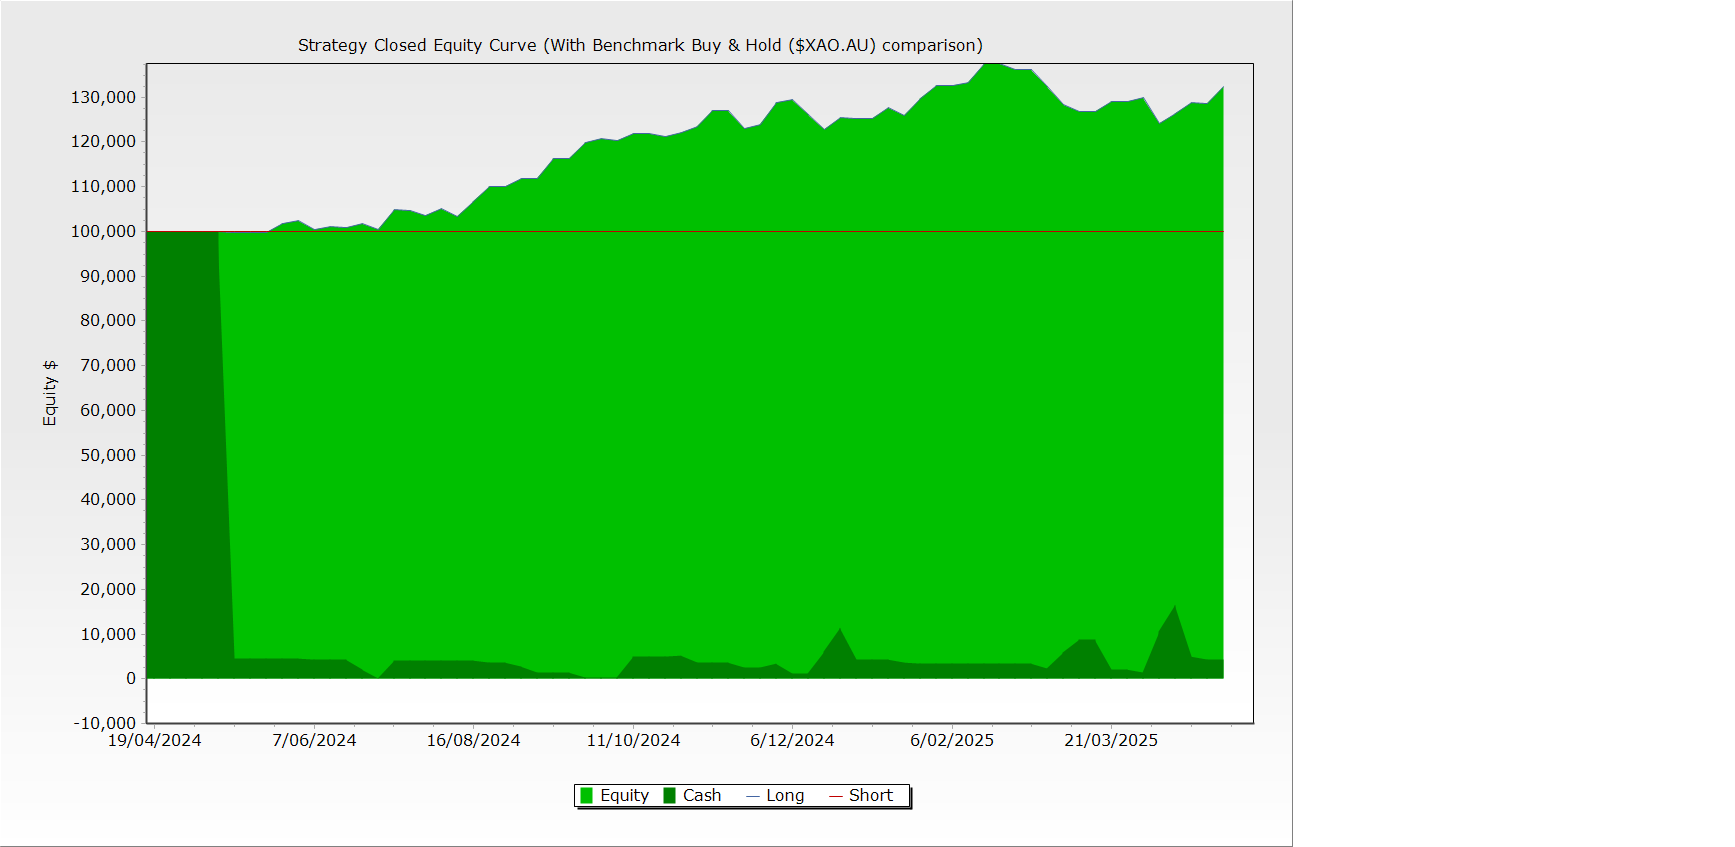
Below is a link to a video with market comments, then below that are the the 52 week high alerts. I have also posted an equity curve result of the Mindful Trading system (scroll down a little). This week is very strong with 13 alerts in the ASX 300 and 9 in the ASX 300 to 500.
*Please scroll down for one year results of the system.
So despite the market pullback and volatility it's still giving buy signals.
I hope you enjoy the videos and please let me know what you think so I can make improvements.
If you want to know more about this system and others go here:
https://www.easysharetradingsystems.com.au/products-and-services/e-books
ps: if you decide to buy the eBook please email me and ask for the appendix
Also more charts and info here:
https://www.easysharetradingsystems.com.au/easy-share-trading-systems/peters-portfolio
This weeks video
2nd May 2025
25th April
Ths weeks 52 week high alerts for 2/5/25
ASX 300 : ALQ BGA CAT CBA DVP JBH MGR NCK SGP TCL TLC TPG WES
ASX: 300 - 500: AGI CWP D20 DXB FCL DBI GNP OBL PPM
ALERTS FOR THIS WEEK POSTED BELOW
52 week closing highs as of the Fridays close 25/4/2025
ASX 300 : AFG VCX
ASX: 300 - 500: COG SVR
52 week closing highs as of the Fridays close 18/4/25
ASX 300 : BOQ CQR LYC NEM RMS SLC VAU
ASX: 300 - 500: ARU DXC SX2
Below is the equity curve of the Mindful Trading system over the last 1 years.
System return over the year is 32% - not including dividends
If you want to know more about this system go here:
https://www.easysharetradingsystems.com.au/products-and-services/e-books
ps: if you decide to buy the eBook please email me and ask for the appendix
Also more charts and info here:
https://www.easysharetradingsystems.com.au/easy-share-trading-systems/peters-portfolio
Hi to regular readers. I am taking a break for 3/4 weeks. On the 1st March my partner (of 7 years) and I have decided to tie the knot. In the lead up to the big day we have lots of prep and then a break afterward. I should be back here around the 2nd week in March.
Until then stay safe and trade well,
Regards,
Peter and Cynthia.
ps: you know about me but if you're interested here is a link to Cynthia's website https://thrivingself.com.au/about/
Market Comments: See charts below with an On Balance Volume indicator and the Money Flow Indicator using a 13 period for 7/2/25
This week I have something to discuss as the charts are showing a change of mindset from traders. Look at the right side of the chart. The price is trending up, shown clearly by the green line I have drawn. However the OBV has "double topped" and the MFI is now showing a clear negative divergence - you can see the red line I have drawn showing a down trend. Time to panic?
No.
However, looking at the chart it appears price has got ahead of itself. Certainly ahead of volume. It was still a very positive week with the index closing up near its highs but it now appears it wants to take a breather. This coming week we may not see the continual uptrend we have the last 6 to 7 weeks.
Alerts are below, showing some interesting developments.
Until next week
Peter
52 week closing highs as of the Fridays close 7/2/25
ASX 300 : AFG MAF NCK PDI (all of these in the 100 - 300. (I suggest you read last weeks comments about rotation from large cap stocks to the smaller ones)
and more interest in this sector too........
ASX: 300 - 500: ABA DUR PNR SSR
Market Comments: See charts below with an On Balance Volume indicator and the Money Flow Indicator using a 13 period for 31/1/25
My comments are getting to sound a little like the movie Groundhog Day - the movie where every day is a repeat of the previous except I am discussing a weekly occurrence. Some overhead resistance is looming on the 13 period MFI but until that is reached its onward and upward so the chart suggests.
Something I have mentioned many times here before is the rotation of money out of the Nasdaq 100 and into the Russell 2000. I am not going to show the charts as they are easy enough to google but I will say this.
The Nasdaq looks a little toppy and overbought but the Russell appears to be trending upward more steadily. This is a big deal in my opinion. The fear (always plenty of that) has been that the overbought Nasdaq will crash the markets. But, or maybe I could say "however " - if money flows out of the Nasdaq 100 and into the more broad based Russell of 2000 stocks, this can only be a good thing for the US and ultimately the global economy?
Food for thought.
Another comment is this: The Russell 2000 has a strong correlation with the ASX 500 - makes sense when you think that Australia does not have a big Tech sector as the US does - largely represented by the Nasdaq 100. As the Russell goes so often does the ASX 500.
The strong performance this week in the US by the Russell shows up in the ASX 500 alerts this week with 10 alerts for the 52 week high system - all in the ASX 300 sector and 7 from the Small Ords sector (100 to 300 on the ASX and the index similar to the US Russell) .
Now that should tell you something.
Have a great week
Peter
ALERTS FOR THIS WEEK POSTED BELOW
52 week closing highs as of the Fridays close 31/1/25
ASX 300 : ACL EBO EMR HVN MPL NAB RIC RMS URW WES (7 of these in the 100 - 300)
ASX: 300 - 500: None
Market Comments: See charts below with an On Balance Volume indicator and the Money Flow Indicator using a 13 period for 24/1/25
Before reading this weeks comments I suggest you read last weeks, for not a lot has changed. The market continues to be strong. Price and volume action are trending up well from oversold areas on the chart. The next challenge for the price will be a double top but volumes have a while to go before getting back into over bought territory and if I was going to predict (as you know I don't) the probability is price will exceed the previous high.
Lets see!
I hope you are all having a nice long weekend break and that the good vibes continue in the market.
ps: my suggestion for the Australia Day controversy is to keep the date but change the name.
Recognition Day is my suggestion which hopefully covers every ones feelings.
All the best
Peter
ALERTS FOR THIS WEEK POSTED BELOW
52 week closing highs as of the Fridays close 24/1/25
ASX 300 : COL MQB OPT
ASX: 300 - 500: SFC
See charts below with an On Balance Volume indicator and the Money Flow Indicator using a 13 period for 17/1/25
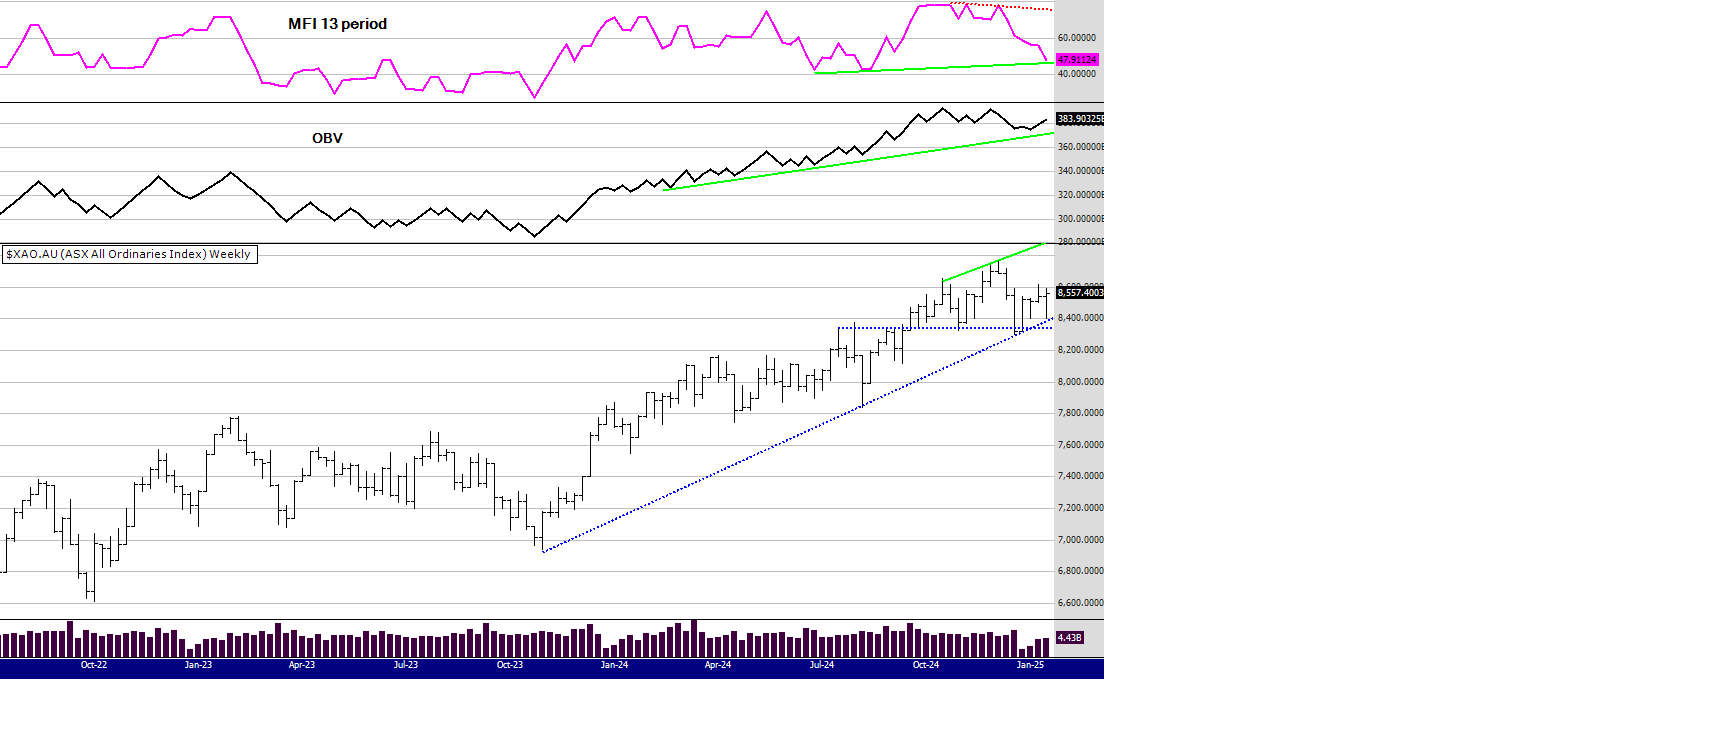
IMO the index above looks strong. Price support lines are holding well. The OBV support line is holding well. The weeks price has closed to the upper range of its bar. The volume bar levels are improving. The MFI is oversold and holding its trend line. So, it appears the mindset of traders and investors is becoming less fearful. Seemingly driven by some positive economic data coming from the US (high employment) and talk (hope) of an interest rate cut here in Australia because inflation is falling - many householders would disagree with that one!
The investing world now waits for President Trumps 2nd inauguration to decide if or where to invest. I find it amusing many are concerned about what he will say, or not say during his acceptance speech. Whatever he says (maybe he will say little?) no doubt interpretations will be made.
However, if we are to remove the noise from the media and their interpretations, and just look at the chart, it looks bullish. We may have low volumes again this week because the US market only has a 4 day trading week due to the Martin Luther King Jr public holiday (an unfortunate clash with President Trumps inauguration day).
Have a good week,
Peter
ALERTS FOR THIS WEEK POSTED BELOW
52 week closing highs as of the Fridays close 17/1/25
Below are the alerts from a scan of the ASX 300 and the 300 to 500
300: INA
300 : BFL
See charts below with an On Balance Volume indicator and the Money Flow Indicator using a 13 period for 10/1/25
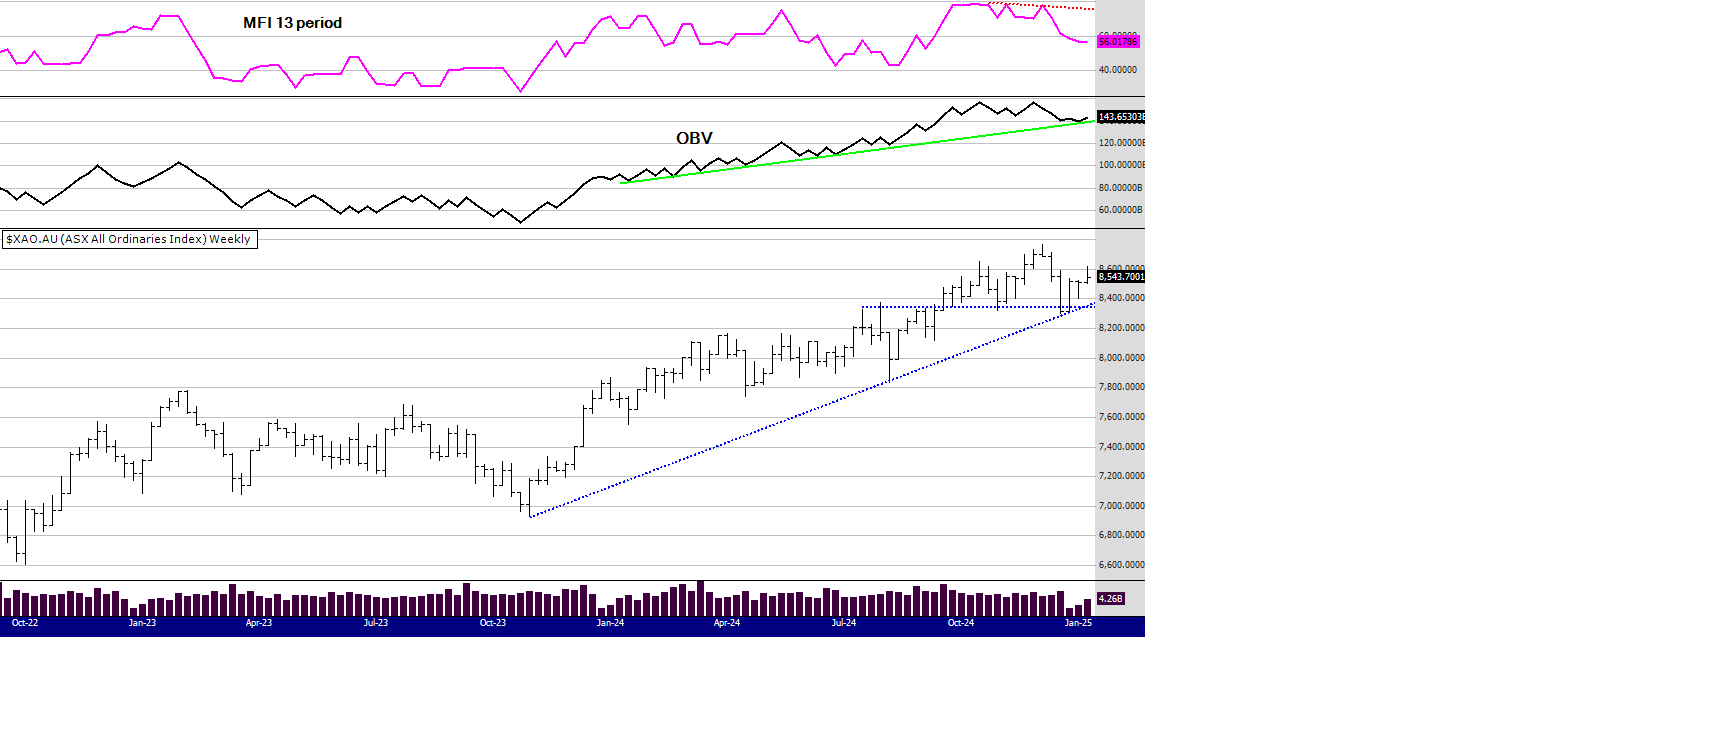
Its hanging in there this index. We STILL have low volumes this week. The U.S. markets had a 4 day trading week because of Jimmy Carters funeral, so we did have one day on the ASX "without a lead" from the U.S. We really do play follow the leader. The ASX had six new 52 week closing highs which did surprise me a little as trading this week seemed insipid. Lets look at the U.S.
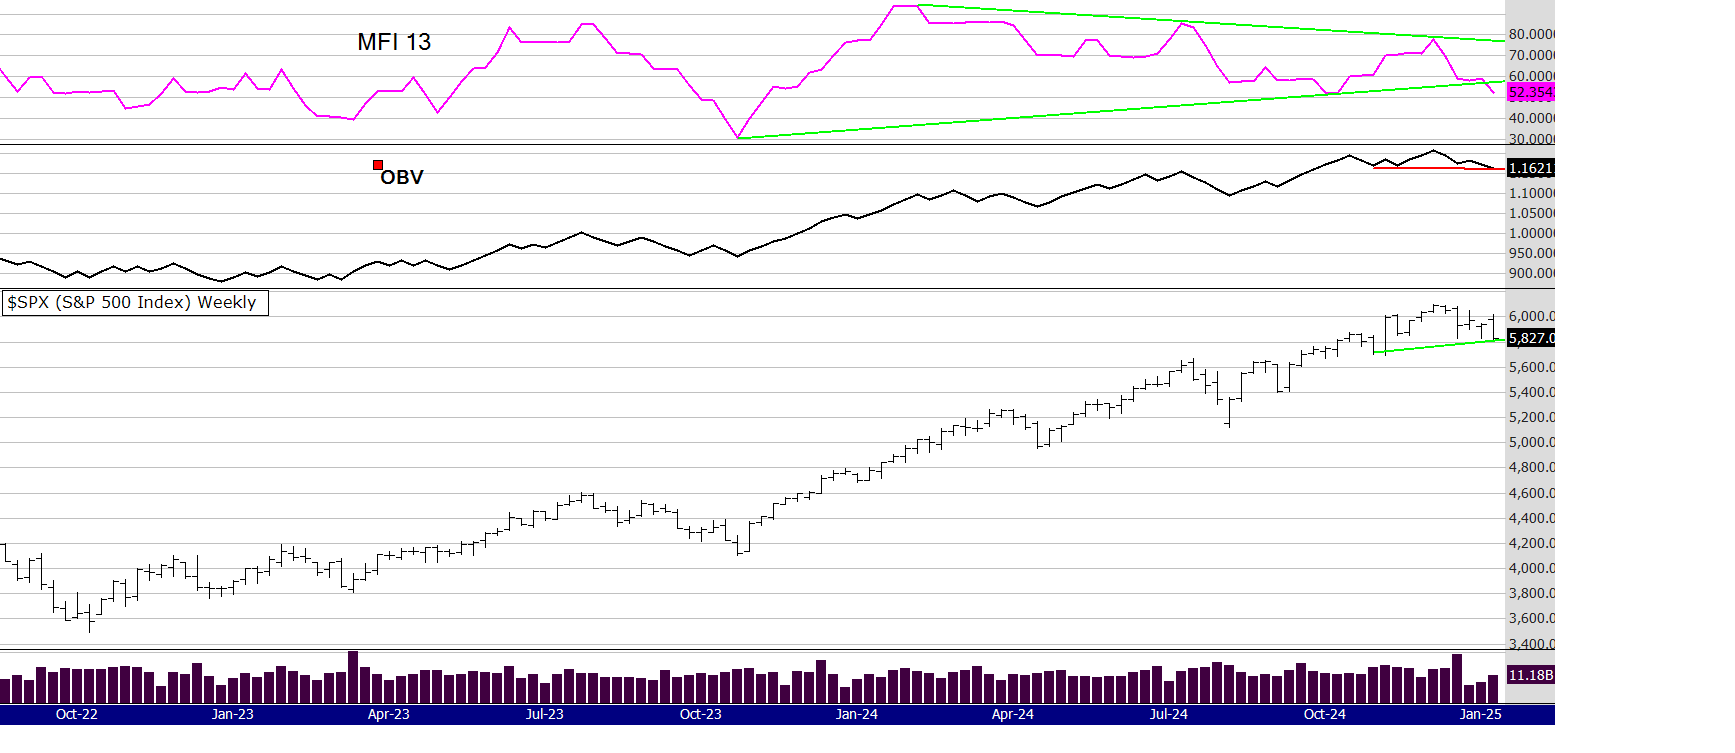
The SP500 looks to be weakening. Although the price is still trending up quite well, volumes have broken down. There is a bearish divergence between price and OBV. Also the MFI 13 period (one calendar quarter) has broken below its trend line. They are not big divergences or big breakdowns - but small breakdowns can quickly develop into big ones. Of course we know the SPX in the US is dominated by big tech, but the ASX appears to be holding up better with the resources, energy and materials sector which all had a strong week.
It appears inflation is the big fear at the moment - resulting in LESS cuts from the Fed than the market wants or expects. I read today the following script below, taken from this link here
https://tradingeconomics.com/united-states/stock-market
US Equities closed sharply lower on Friday, following a stronger-than-expected jobs report that dampened expectations for further interest rate cuts by the Federal Reserve in 2025. The S&P 500 and Nasdaq 100 both dropped 1.5%, while the Dow Jones plunged almost 700 points. The December jobs report showed a robust labor market, with 256,000 new jobs and a decline in the unemployment rate to 4.1%, surpassing forecasts. This raised concerns that the Fed could keep rates elevated for a longer period.
So it's a strange world, but that's markets. Despite a very strong employment report (the fear was it would be otherwise) the markets focus is really on rates. Until we get more certainty on this matter the markets may continue to flounder. As mentioned last week the big event is probably Trumps inauguration. What will he say to trigger the markets up or down?!
Have a great week
Peter
ALERTS FOR THIS WEEK POSTED BELOW
52 week closing highs as of the Fridays close 10/1/25
Below are the alerts from a scan of the ASX 300 and the 300 to 500
300: MND LTM SHV TPW
300 - ARX CYC
See charts below with an On Balance Volume indicator and the Money Flow Indicator using a 13 period for 3/1/25
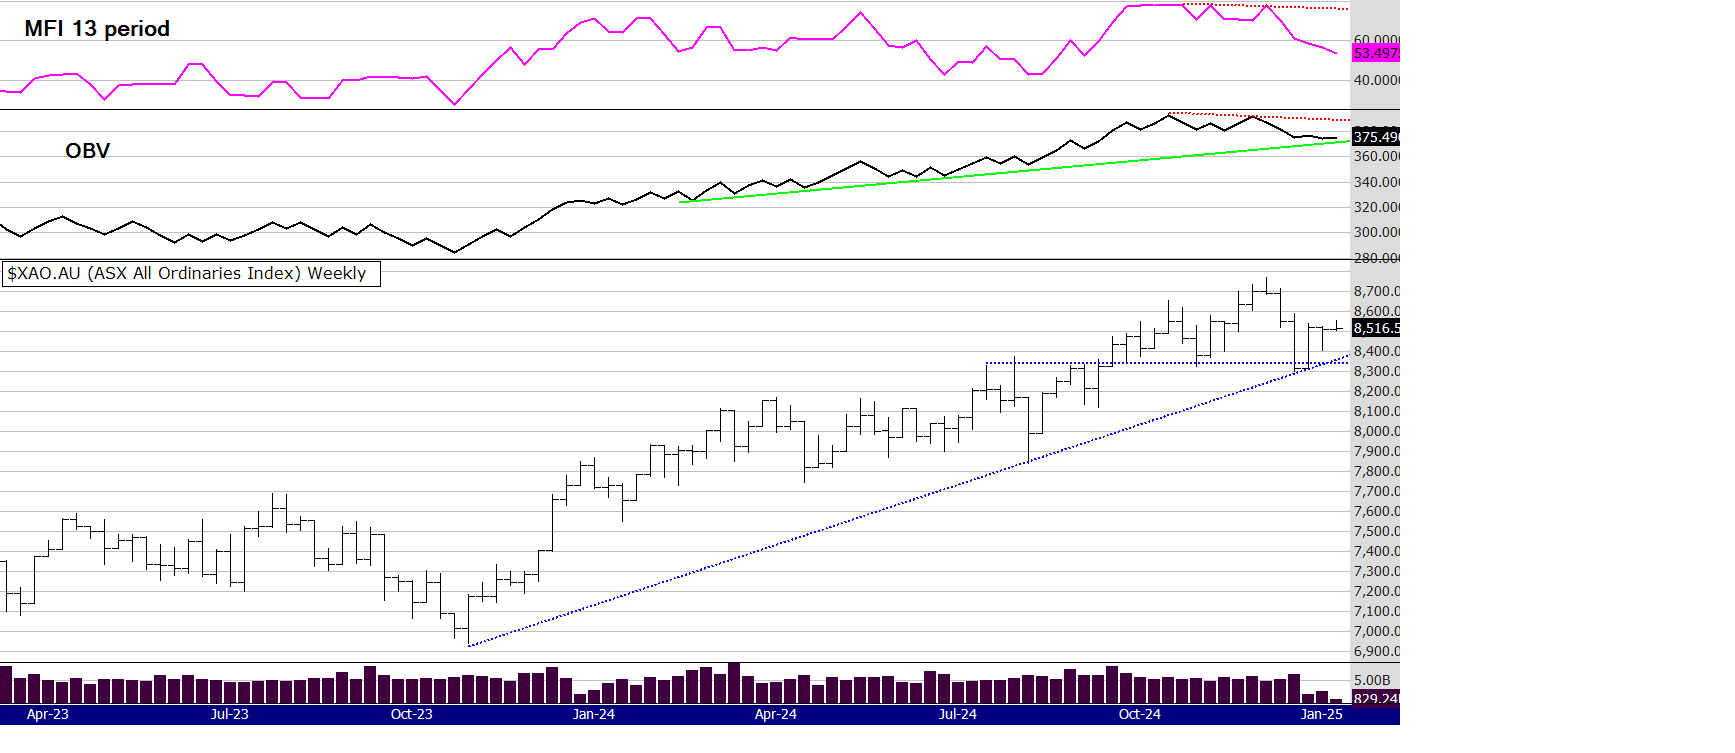
I am still in holiday mode :) and volumes are very low, so I wont say a lot this week about Indexes until we get more data to show which way this market will go, up, down or sideways.
I am writing this on Monday 6th Jan after the Mondays close, so that explains the odd last bar with extra low volume, as its only one days trading. The 2 shortened trading weeks over Christmas and New Year were actually quite bullish - but again the low volumes may not account for much of an indication. The OBV indicator looks supportive however the 13 period is trending down.
At the end of this week with a full weeks trading we will have more of an idea of how this index and others are looking. Some things I have noticed over the holiday season are the following:
Oil has had a bounce off its recent lows.
Bitcoin is back up towards US 100K - 99,250 as I write.
The smaller cryptos have also bounced from their recent sell off.
Gold is trading sideways and there are still quite a lot of gold stocks running well in the 52WH system.
The Russell in the US looks to be consolidating - will it attract more buying if the rotation from big caps to mid caps picks up steam?
The markets will probably worry their way towards Trumps inauguration on the 20th Jan. I expect that narrative to gather momentum over the next two weeks so some increased volatility is more probable IMO.
In the last month the CRB index (commodities) has risen 4% and made a 52 week high.
Alerts below, have a great week.
52 week closing highs as of the Fridays close 3/1/25
Below are the alerts from a scan of the ASX 300 and the 300 to 500
300: None
300 - 500: EBR
Have a good trading/investing week.
Peter
See charts below with an On Balance Volume indicator and the Money Flow Indicator using a 13 period for 27/12/24
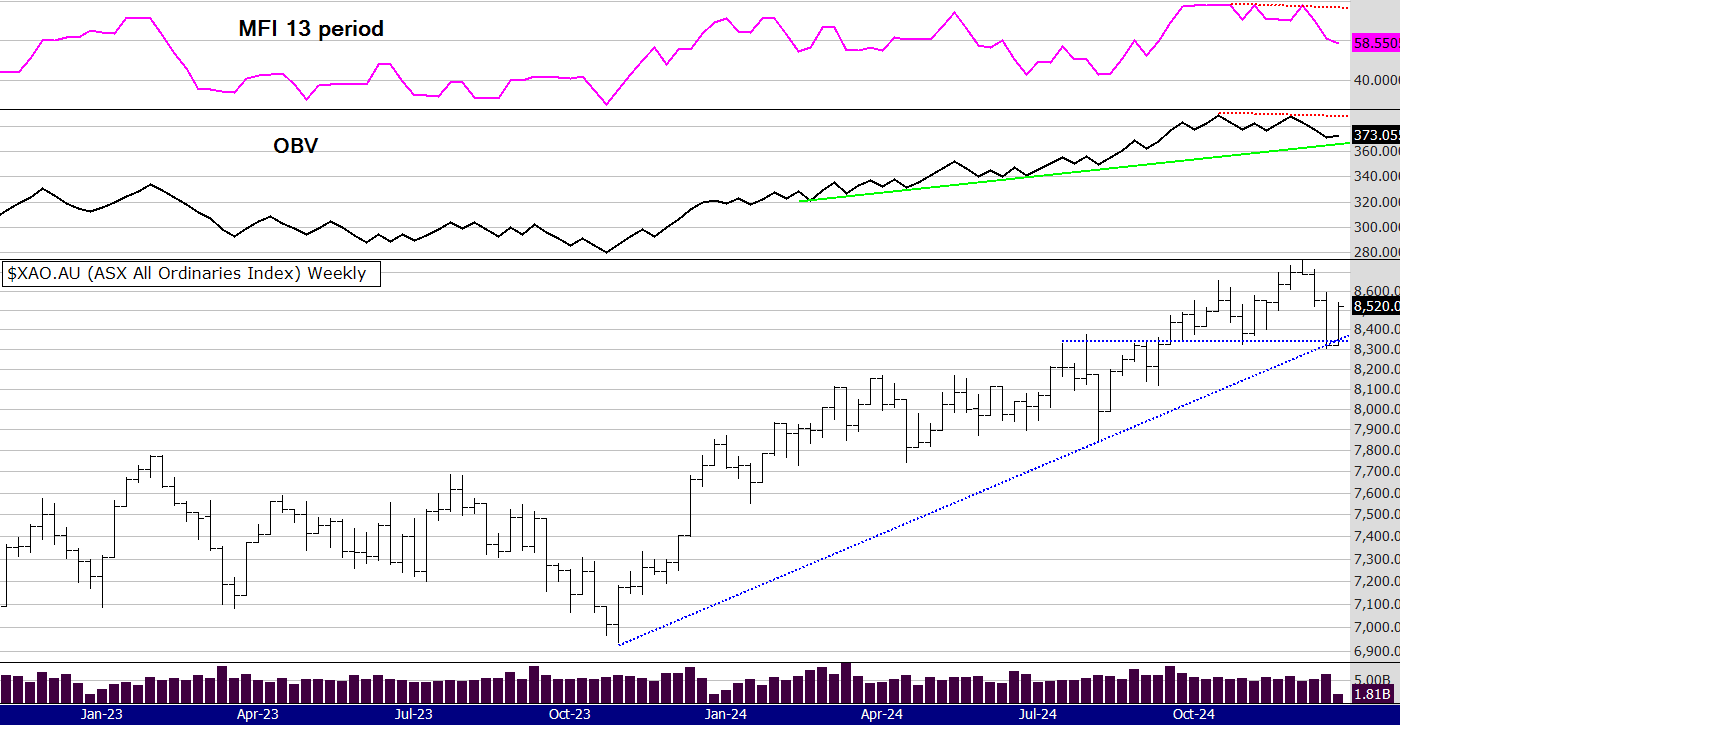
A few things to remember when looking at this index of the ASX 500. Its dominated by the top 50 - even more by the top 20. Also we have had only a 3 day trading week, one of those days a shortened trading day of Christmas eve. Note the low volume.
In saying that there were warning signs of it being overbought - the OBV and the MFI were diverging down as can be seen with the red lines I have drawn on the chart. This is still a healthy looking and trending chart, there are no serious volume to price divergences and price has bounced off support. But. Its too early to tell if this is a correction or something more serious - particularly with such low volume and not a full weeks trading. The coming week will be similar with another shortened 3 day trading week. Below is a chart of the Small Ords which is the 100 to 300.
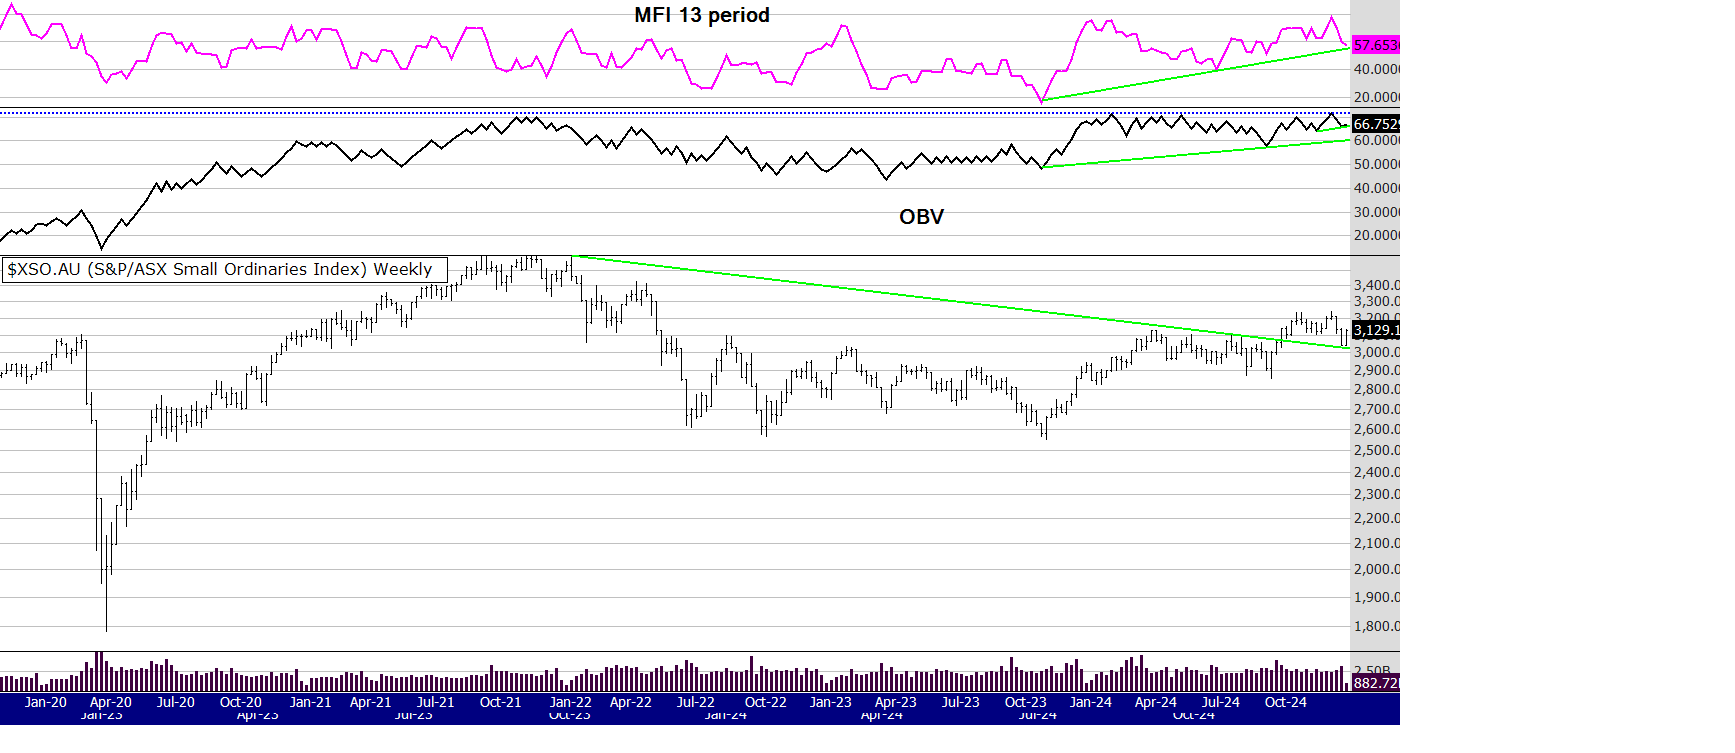
What stands out to me on this chart is the positive divergence from the OBV during the recent pull back. Longer term trend and volume support lines are holding. But again, we need more information to make a call. Of course, this index, along with any others in the ASX that are showing support, are at the mercy of US markets. Below is a 2 year chart in weekly format of the SP500 in the US.
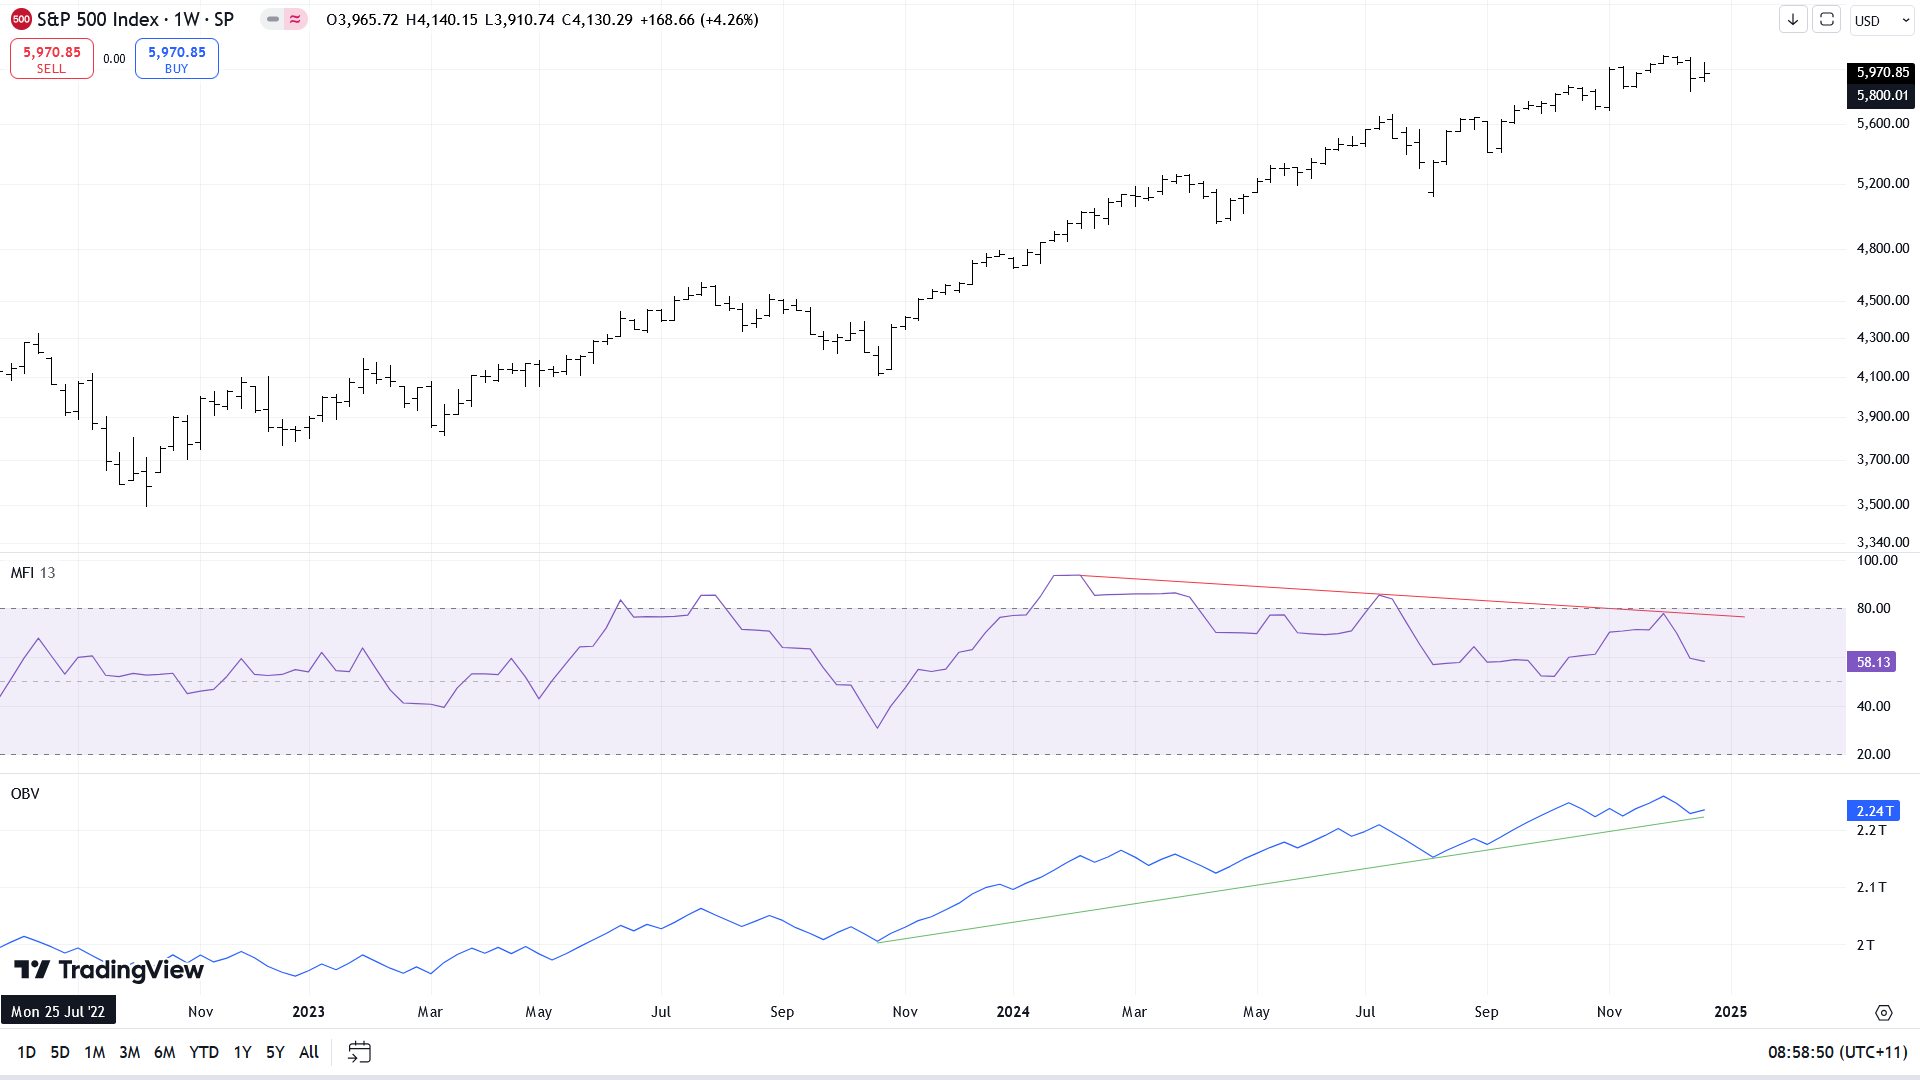
The negative divergence on the 13 period MFI was and is obvious. However the slower and arguably more reliable OBV is still trending strongly and not diverging. Price is also trending strongly. Lets talk a little market psychology:
Many agree the markets were overbought before the recent Fed meeting. When markets are over bought and many are bearish and fearful, it doesn't take much for a sell off to occur. The Fed cut the expected 0.25 % but the narrative about inflation from the Fed chairman spooked the market. As Ed Seykota once famously said "everyone gets what they want form the market". The "market" (people) got what they wanted - a reason to sell. However, as with the XAO chart, I think its too early to tell if this recent pull back is a correction (as in August 2024) or the beginning of something more sinister.
Times like this is when the individual trader/investor needs to decide what their plan is. I know people 100% invested, 50% invested or 100% in cash because they think the risk is too high. Also, are you the trader that uses weekly charts, daily charts, waits for confirmation from either of those time frames or - sells earlier based on other reasons?
Have a plan and stick to it is often the best way.
So, to repeat, it is too early IMO to make a call on the probability of what this market will do - lets see what the next few weeks will bring, alerts below...
cheers,
Peter.
52 week closing highs as of the Fridays close 27/12/2024
Below are the alerts from a scan of the ASX 300 and the 300 to 500
300: HLI
300 - 500: BOT NZM
Have a good trading/investing week.
Peter
I am taking a 2 - 3 week break so there will be no comments or charts to discuss.
However I have posted the 52 WH alerts below for this week and if I have internet will do so the following week/s.
52 week closing highs as of the Fridays close 29/11/2024
Below are the alerts from a scan of the ASX 300 and the 300 to 500
300: GTK QUB
300 - 500: EHR PAR SGF SVR
Have a good trading/investing week.
Peter
See charts below with an On Balance Volume indicator and the Money Flow Indicator using a 13 period for 22/11/24
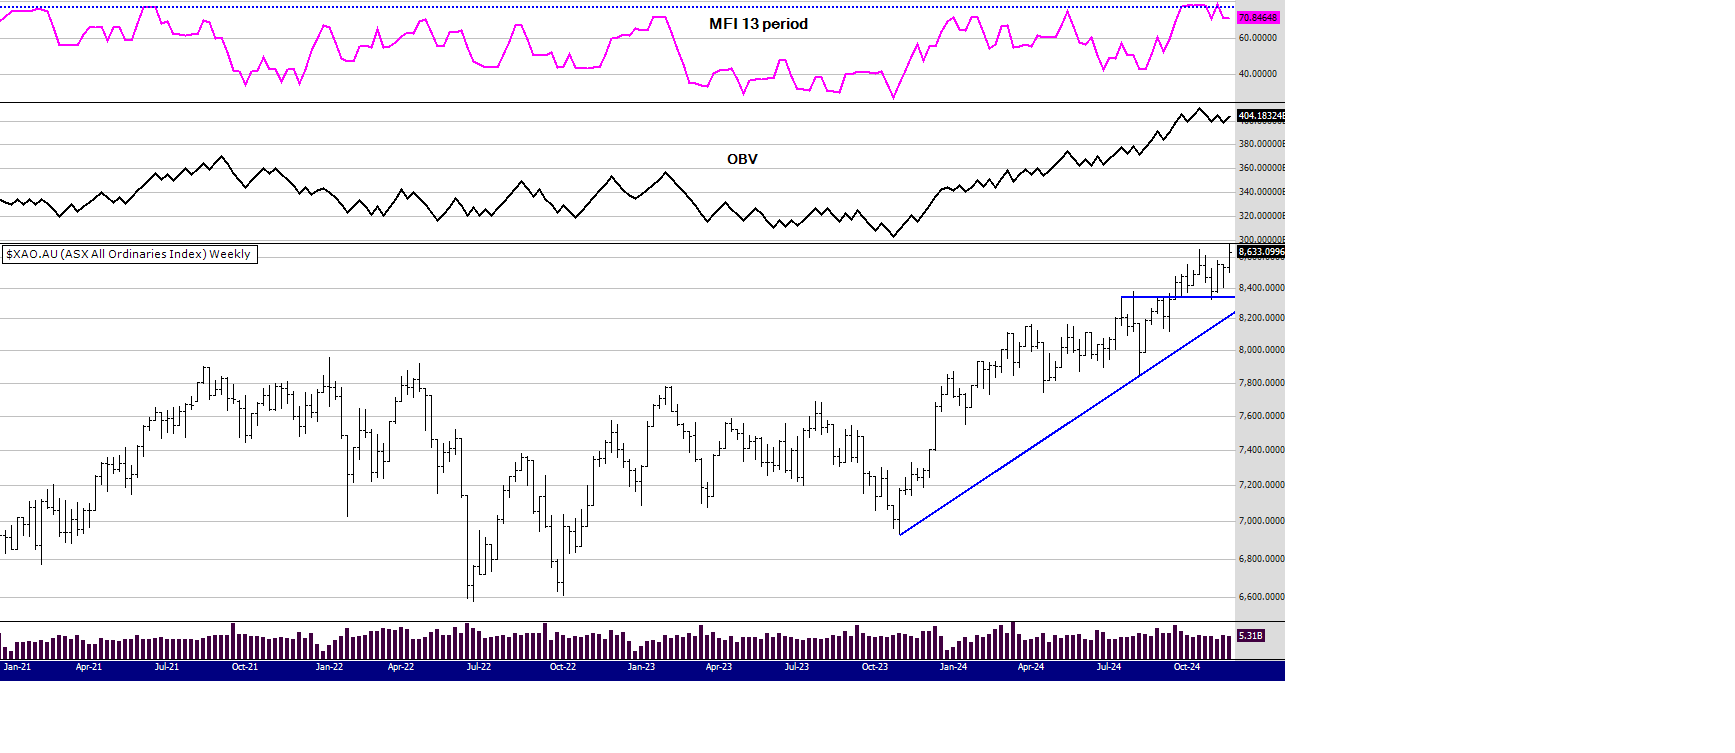
I have said many times here "price is the ultimate indicator". All other indicators (which are mostly gleaned from price and volume) are a guide, price is the boss and its best to do what the boss tells you. Looking at the chart above the volume indicators are lagging the price - a little. However considering last nights huge rally in the Russell I would think Mondays XAO performance will mirror that. Of course I have learnt not to "expect" but the correlation between the Russell and the XAO is significant. Last week I said this:
the Russell is still showing a strong break out despite this weeks pullback. I would think some buy opportunities will exist if the price falls more and THEN goes back up after bouncing off support. The Russell could still fall more - perhaps down to the 2200 area. At that price the OBV and MFI will be sitting on support lines and unless the market gets really bearish, the probability is it would be a good buy zone.
Of course it may not fall that far, it could just power on............
You can scroll down to last weeks chart of the Russell but if you go to many of the free chart providers (stock charts, big charts, trading view) you can see the last 4 days of the Russell was nothing but up.
A few other big things happened through the week. Gold bounced but the shares still languish its performance. I do think its only a matter of time before good quality gold juniors play catch up, but until then we cant force or expect it. There is a saying in Zen "nothing is forced or controlled" and that is certainly the case with gold shares at the moment. In fact its a great saying to keep in mind with all your trading. Be in flow - don't fight whats happening even though you "think" it "should" be different.
Bitcoin and some of the altcoins had a strong week. I do wonder if the interest in crypto is pulling capital away from the gold sector. In the past the place to speculate was gold shares but now its altcoins? Could be.
The bull market in 52 week closing highs - is back in town. There are eight signals this week in the Australian top 500.
Have a good trading and investing week,
all the best
Peter
ALERTS FOR THIS WEEK POSTED BELOW
52 week closing highs as of the Fridays close 22/11/2024
Below are the alerts from a scan of the ASX 300 and the 300 to 500
300: ALQ ASX MYS NXG ORG SQ2
300 - AVJ CBO
The exit used FOR THIS METHOD is the 5/12 EMA crossover. Therefore, some stocks will be re signalling a new high buy signal if they have been recently exited by using the 5/12 exit within the last 12 months. This is important and you need to understand this.
Of course the 5 EMA needs to be above the 12 EMA to make the 52 week high valid, (otherwise we would be selling straight away) nearly always this is the case, but rarely if a stock spikes it is not.
So to repeat, the rules are: USING WEEKLY PARAMETERS!
Entry:
Share price to make a 52 closing (or equal to) week high (when selecting a buy, favour the cheapest stock)
The 5 ema to be above the 12ema
Exit:
if the 5 ema crosses below the 12 ema
The above system contains no position sizing, bull or bear filters or fundamental stock selection, these are discussed and taught to private clients or at my courses.
See charts below with an On Balance Volume indicator and the Money Flow Indicator using a 13 period
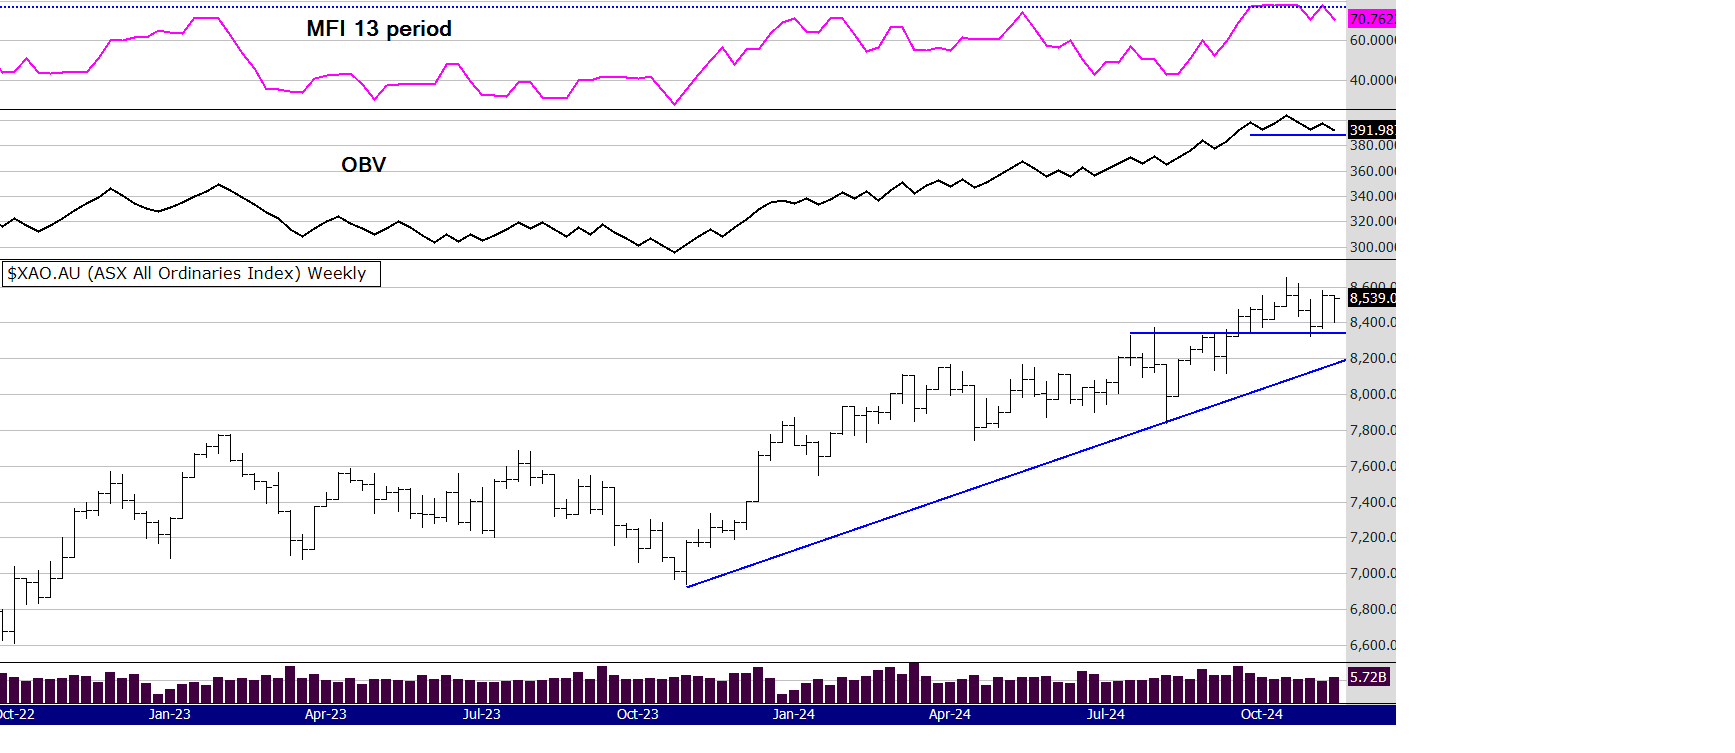
Last week I mentioned low volume but this week made up for it. The two volume indicators on the chart above look "toppy" but the price had a strong week. The bulls won the week over the bears - note how the price closed up at the end of the week after being down earlier. That sort of price action is positive, it indicates people are still buying despite the Trump election euphoria backing off in the US. You can see this clearly in the chart below.
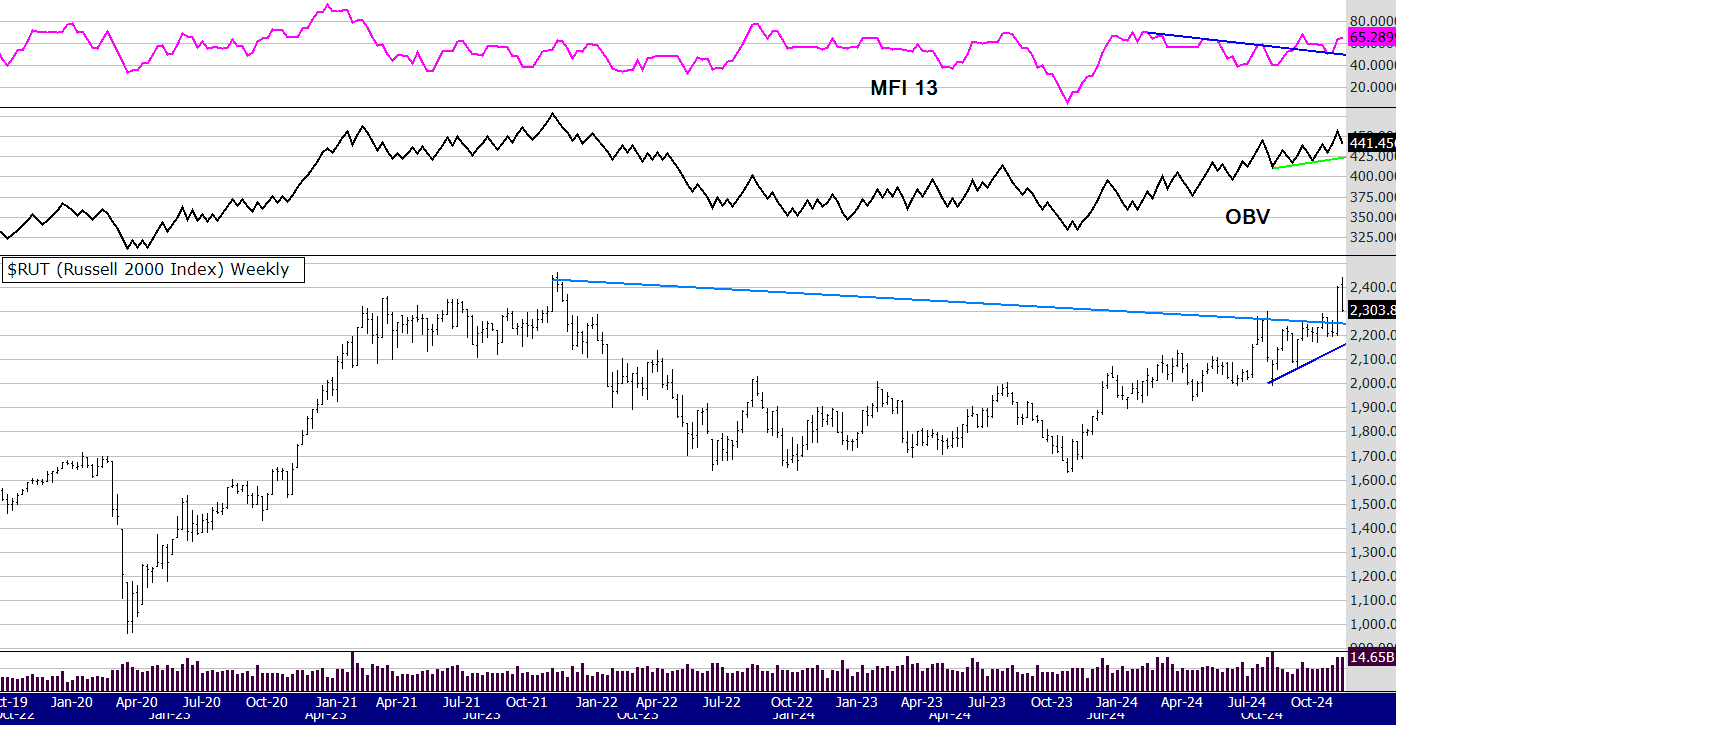
I have mentioned many times the correlation between the Russell and the XAO and it is why I often discuss this Index. For the broad based rally in the US to continue this index really needs to perform - not just the Nasdaq or SP500.
After the initial euphoric rally, price reversed this week on the Russell. You can see how the reliable 13 period MFI was flashing a bearish divergence and price responded accordingly. However, the Russell is still showing a strong break out despite this weeks pullback. I would think some buy opportunities will exist if the price falls more and THEN goes back up after bouncing off support. The Russell could still fall more - perhaps down to the 2200 area. At that price the OBV and MFI will be sitting on support lines and unless the market gets really bearish, the probability is it would be a good buy zone.
Of course it may not fall that far, it could just power on and I will be keeping an eye on the daily chart to see if that happens.
Below is the gold chart.
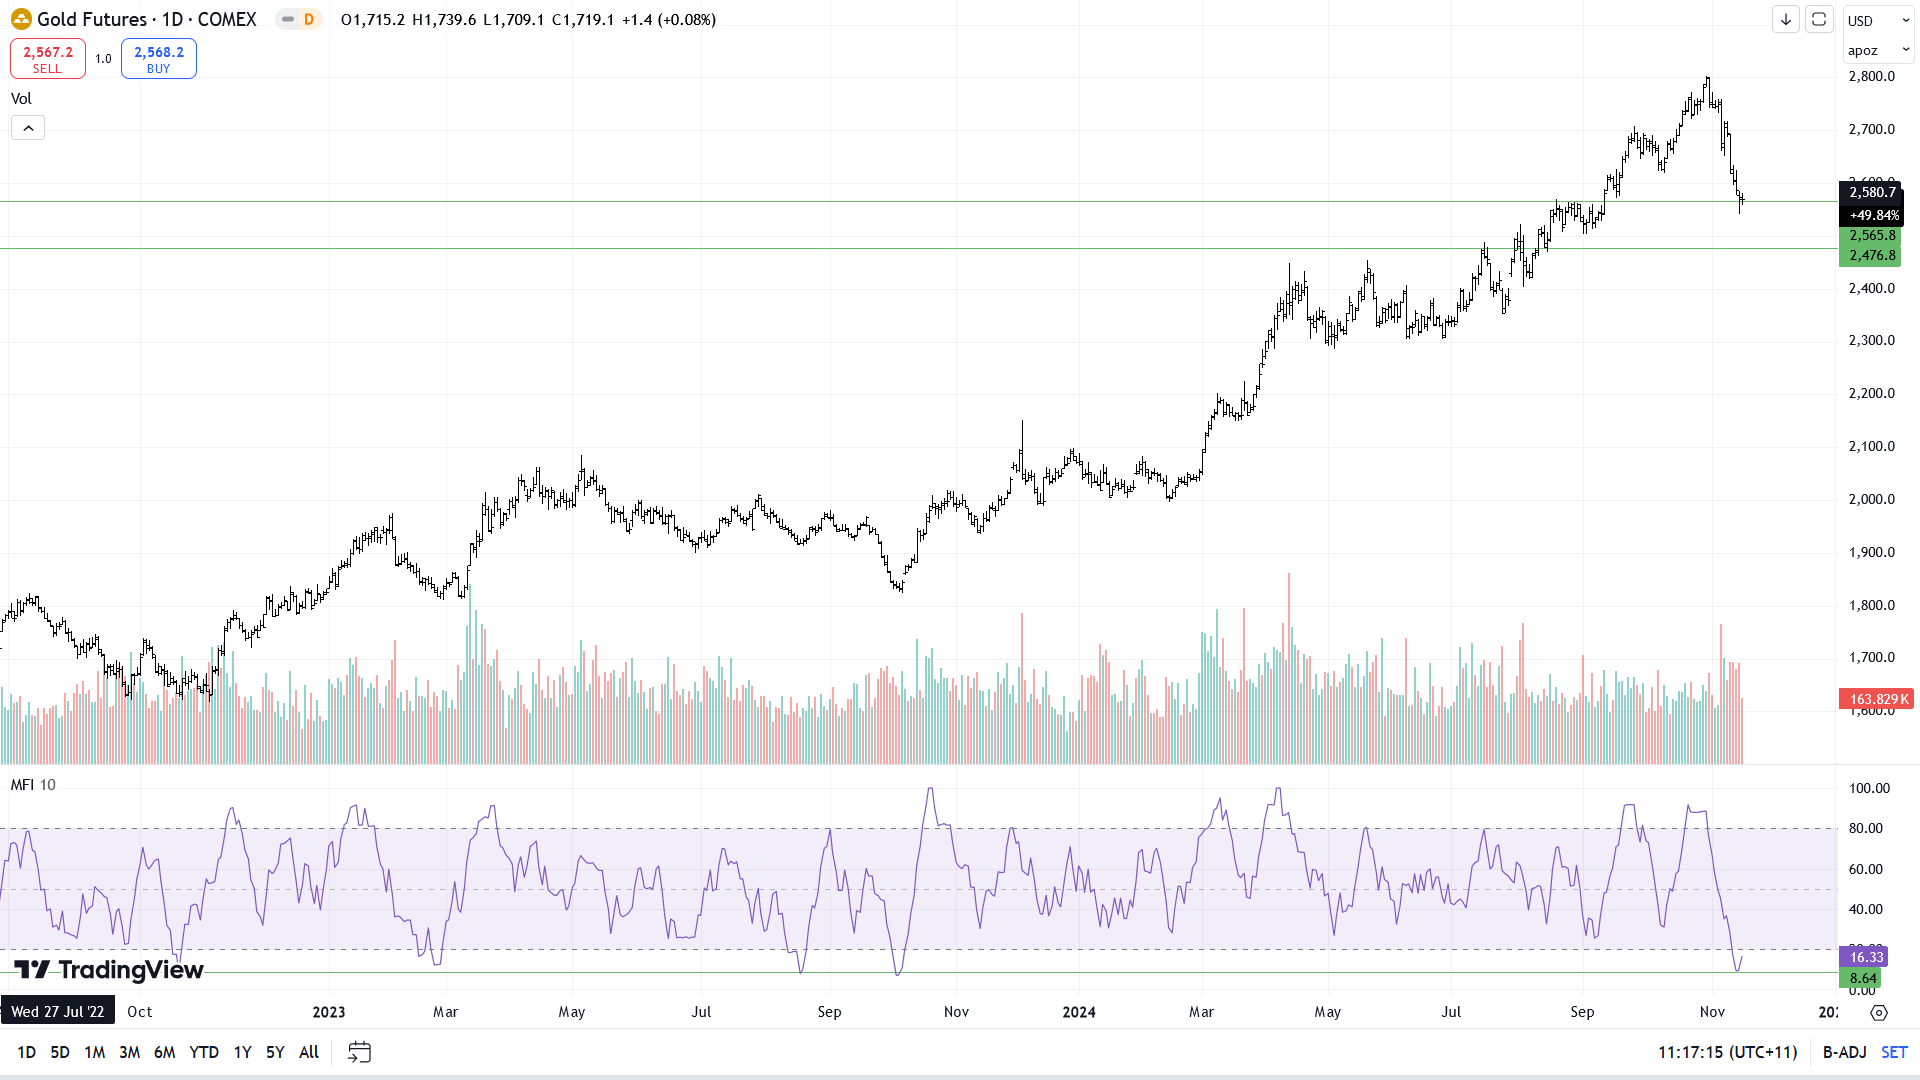
Gold looks oversold and the gold stocks are suffering because of it. Price is sitting on the first horizontal support line but it could fall more to the second support line around 2500. The short term 10 period MFI is oversold. In the past each time that indicator has got so low the price has bounced, but a bounce is not necessarily a rally or a new trend, so we will have to wait and see how this one plays out. IMO there are still positives for gold and gold shares but it depends - the US$ is having a rally and it needs to back off, money is pouring into tech and crypto, doubts have now emerged about the speed and amount of rate cuts (low rates favour gold).
So, a lot happening at the moment. You are either finding it all interesting and perhaps exciting or the amount of unknowns are stressing you out.
Remember to have a plan, know your risk tolerance, take your stops, don't ride the losers, try not to have stops too tight - its a good way to die from a thousand cuts.
Have a great week - it will be an interesting one!
Peter
ALERTS FOR THIS WEEK POSTED BELOW
52 week closing highs as of the Fridays close 15/11/2024
Below are the alerts from a scan of the ASX 300 and the 300 to 500
300: GMG HSN QBE VUL
300 - 500: LGI
The signals provided are WITHOUT A BULL FILTER.
See charts below with an On Balance Volume indicator and the Money Flow Indicator using a 13 period
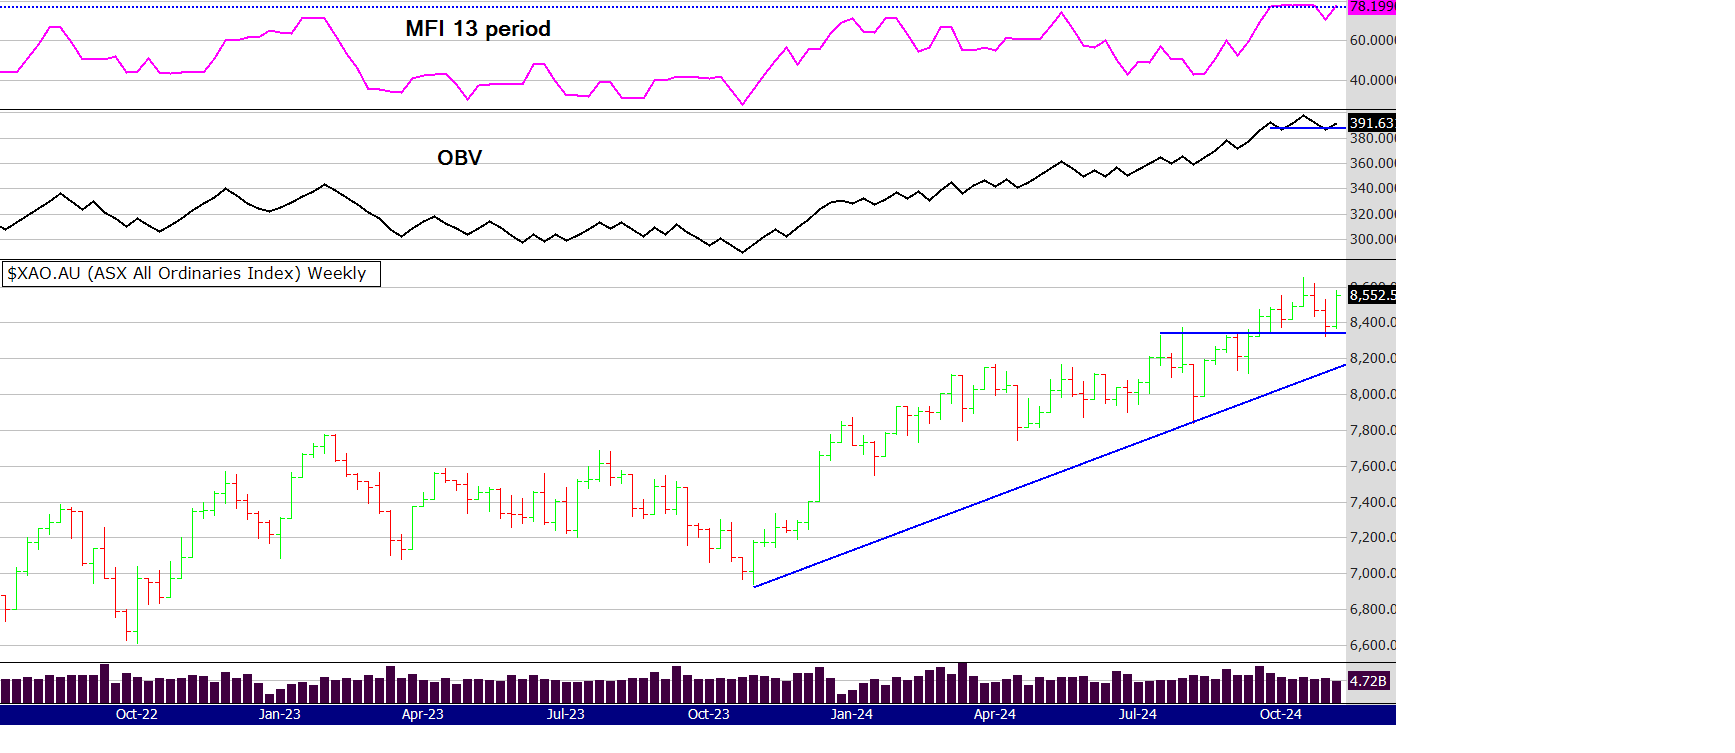
This is a similar chart to the one from last week - except the price has bounced off support levels. I do notice something, not a lot of volume from last week. I suppose the Aus market did have 3 days of uncertainty before the election result was certain. Looking at a daily chart (not shown) volume on Thursday and Friday was a lot more than Monday to Wednesday.
It remains to be seen if the market follows through with more buying next week. Regardless of that this is a very strong market and as Ed Seykota once quipped "the trend is your friend until it bends at the end".
ALERTS FOR THIS WEEK POSTED BELOW
52 week closing highs as of the Fridays close 8/11/2024
Below are the alerts from a scan of the ASX 300 and the 300 to 500
300: BEN CPU NWS
300 - 500: KPG
Comments and charts from 1/8/24
See charts below with an On Balance Volume indicator and the Money Flow Indicator using a 13 period
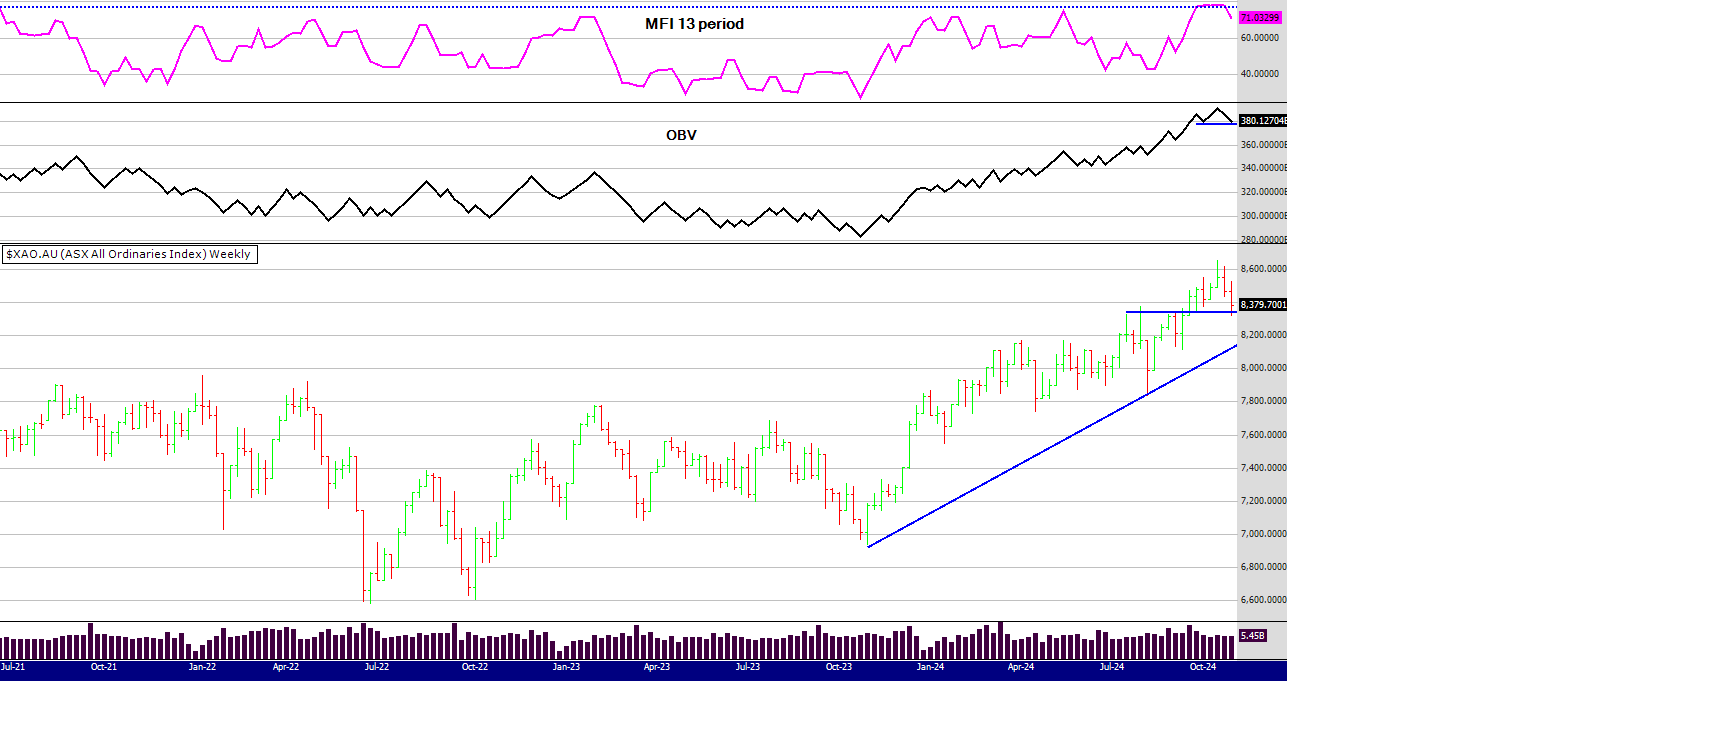
Last week I said this: " markets do not go up in a straight line and at some point in time this market will correct. At the moment you can see the MFI is now in overbought territory and the OBV is sitting on its trend line. When markets get toppy they get nervous and it won't take a lot for this market to correct - just some worrying news. Next weeks US election (Nov 5th) may well be the catalyst. First support sits around 8300 and then 8200 and then of course the round number of 8000"
Well we didn't really get any worrying news (maybe a little about company earnings faltering) but the concerns about the U.S. election is the big thing on peoples minds. A dip down next week to that support area around 8200 would not surprise me. I am going to digress a little and have some fun......
Sometimes it helps to put our "imagination hat" on. For example here are some scenarios about next week in circus land - remember, Americans love a show.
1/ Trump wins with a solid margin
2/ Harris wins with a solid margin
3/ The election is very close and uncertainty prevails for 2 weeks
4/ Trump loses and kicks up a fuss and markets fall (or rise because it was expected)
5/ Trump wins but markets fall on worry he is a loose cannon
6/ Trump wins and markets rise on thoughts he is good for the economy
7/ Harris wins and markets rise on a "same as before, steady as she goes" mentality
8/ Harris wins and markets fall on worries the democrats cant manage the economy and Trump will continue to cause problems
9/ Whatever happens markets rise from a relief rally that we know who is president and the election is over
points 10, 11, 12 and so on...........
So, how does anyone know what will happen? In my opinion it's a waste of time trying to predict, and where am I going with this little rave? Regular readers have guessed. Have a plan, your risk tolerance and methodology worked out so you know what to do in any scenario. I know people that are 100% in cash, 65%, 50% etc. I know people that are "all in" 100% invested. These are the times its so important to know your plan and stick to it. Don't have a plan?
I suggest you first read my eBook Mindful Trading and then follow up with The Zen Trader. Link to those books is below
https://www.easysharetradingsystems.com.au/products-and-services/e-books
So, let us see how the circus all unfolds next week and I look forward to writing about it next week!
Regards
Peter
COMMENTS AND ALERTS as of the Fridays close 25/10/2024
See charts below with an On Balance Volume indicator and the Money Flow Indicator using a 13 period
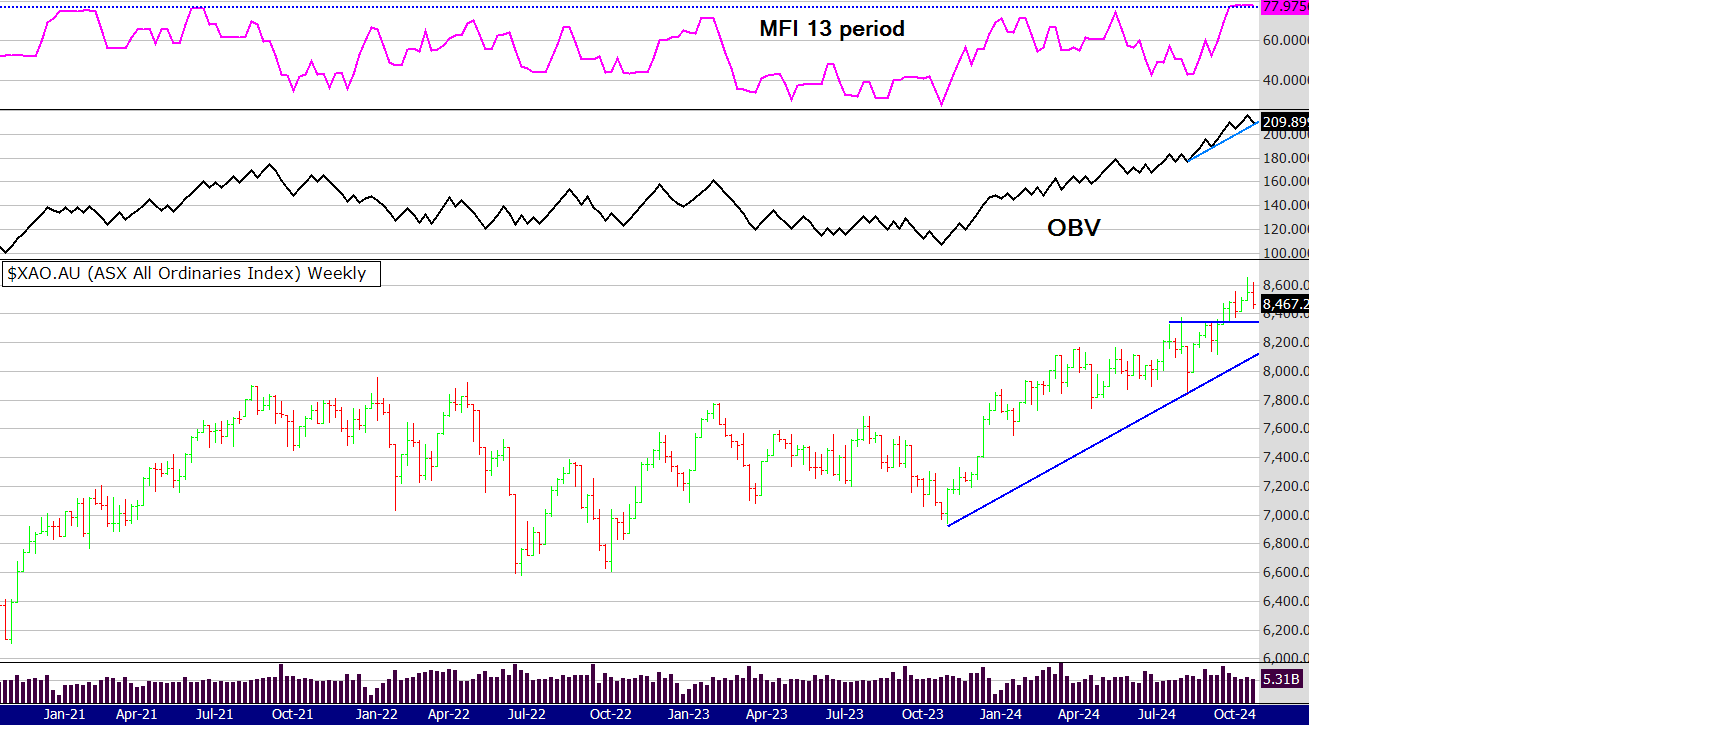
I have been saying for quite a few weeks now that we have a strong bull market. However, markets do not go up in a straight line and at some point in time this market will correct. At the moment you can see the MFI is now in overbought territory and the OBV is sitting on its trend line. When markets get toppy they get nervous and it won't take a lot for this market to correct - just some worrying news. Next weeks US election (Nov 5th) may well be the catalyst. First support sits around 8300 and then 8200 and then of course the round number of 8000.
As you can see this week was down but on low volume. One bar does not make a trend and next week we will certainly have more information from the price and volume. That will give an indication of how strong this market really is.
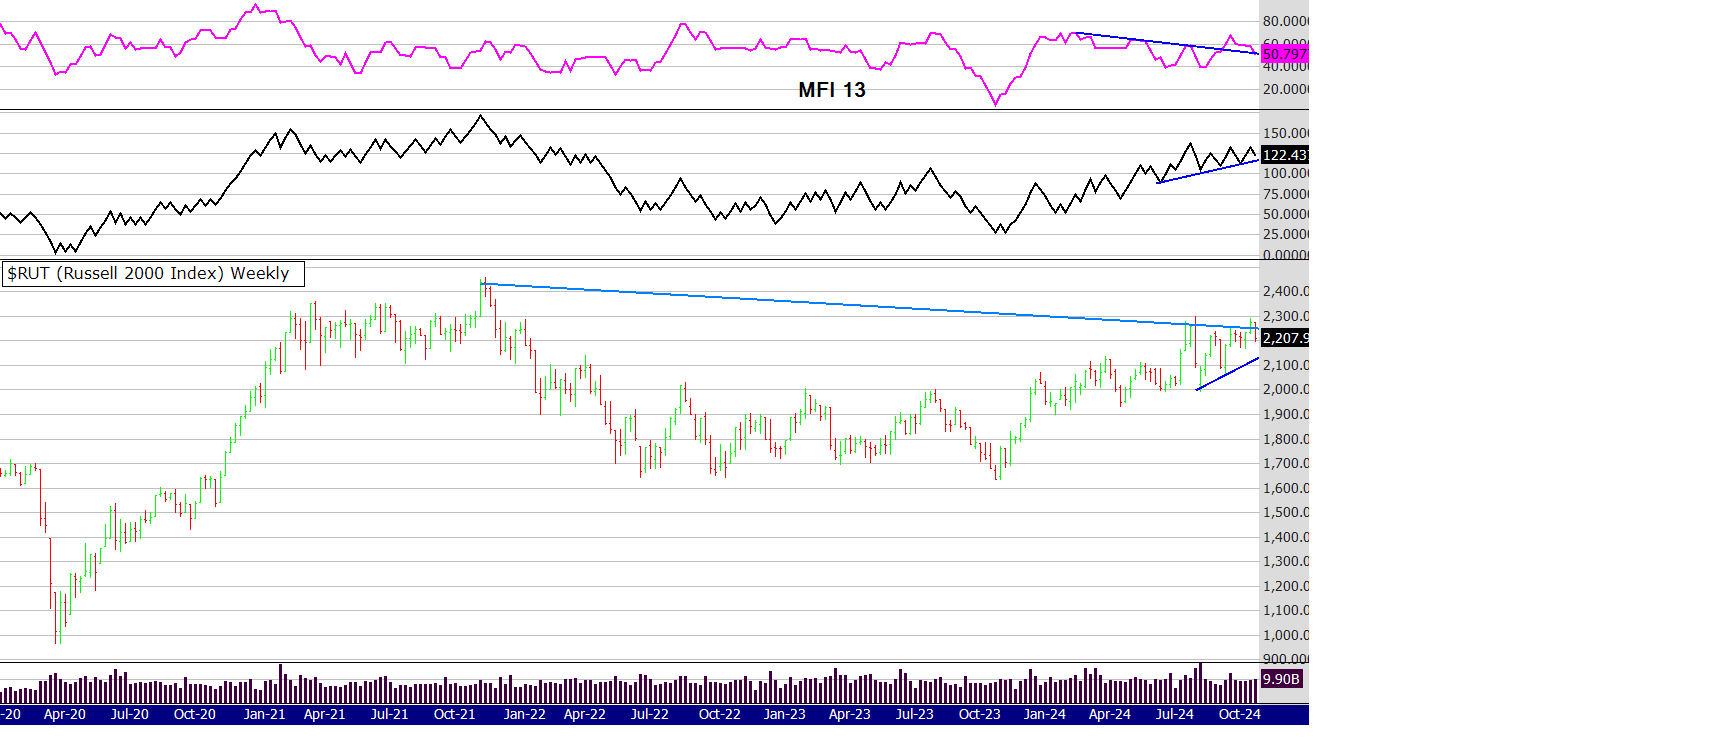
The Russell in the US paints a similar story. It's pulled back and it remains to be seen if this is just a consolidation period or something more sinister. Volume indicators are holding OK, but the index needs some good news to rise . Again the same story applies, the next two weeks in the US is pivotal to the fortunes of this index.
Until next week
Peter
COMMENTS AND ALERTS as of the Fridays close 18/10/2024
See charts below with an On Balance Volume indicator and the Money Flow Indicator using a 13 period
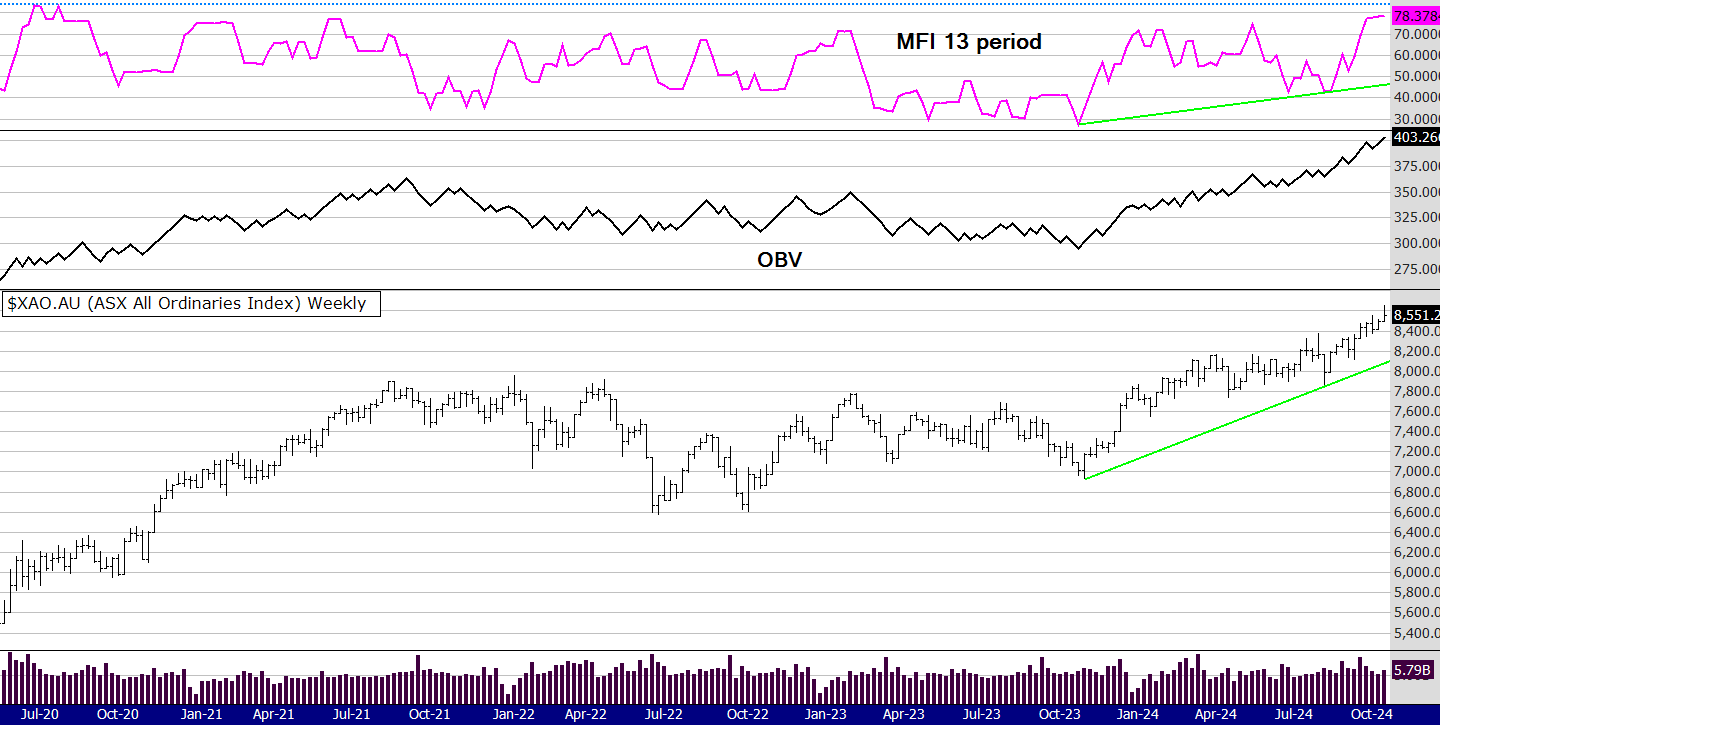
It's a bull market. Price is up, both volume indicators are up and are showing no divergence. I will be Zen about this index and say nothing more - as there is not anything more to say :)
However, I will discuss the Russell, as I have often mentioned the correlation it has with the XAO and the importance of this index to show if the rally in stocks is broad based or not.
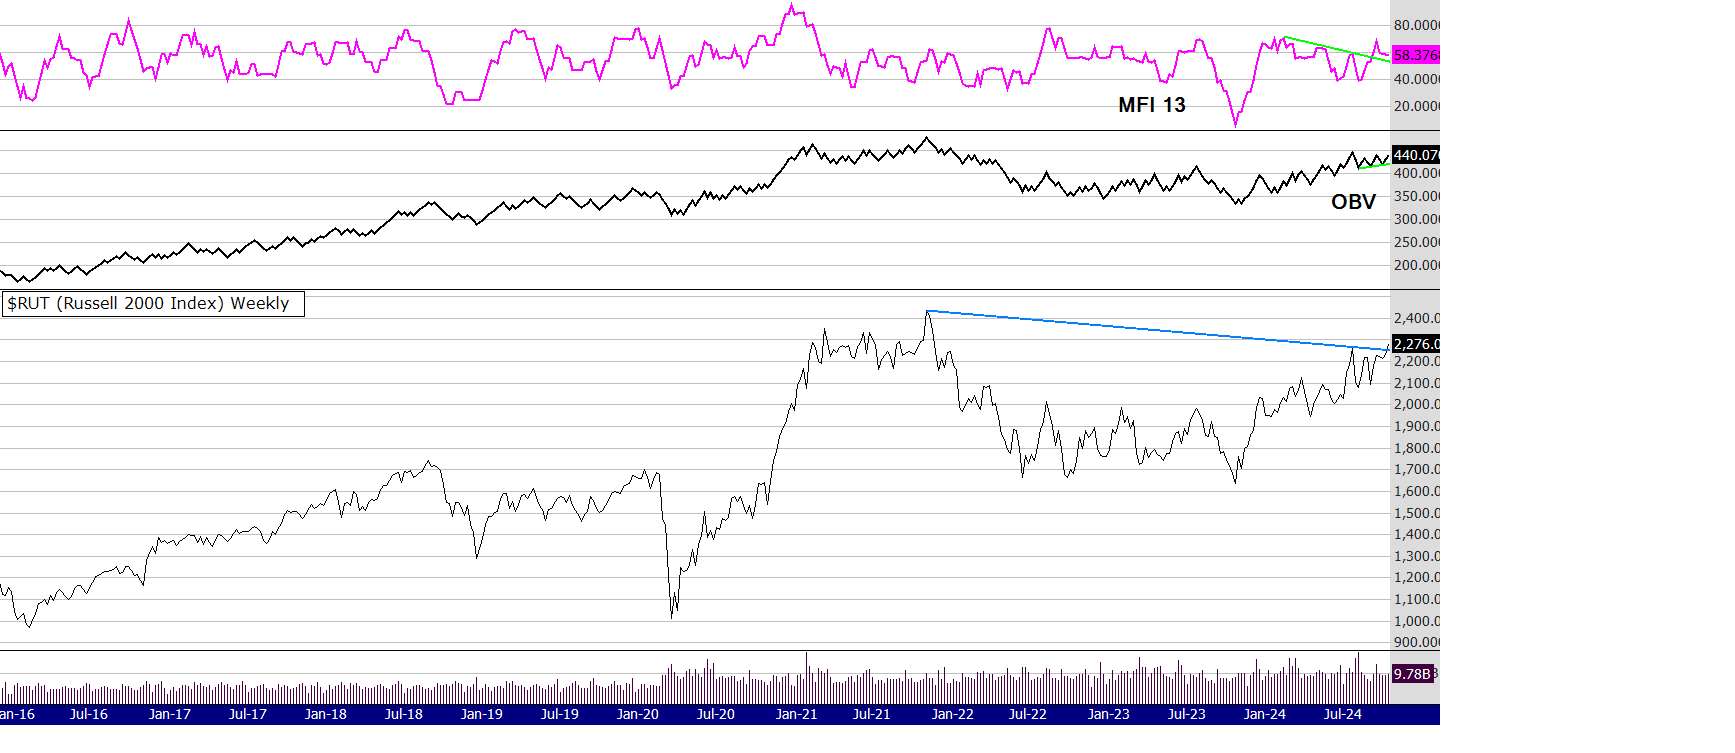
For simplicity I have chosen to show a line chart. Line charts are calculated from the closes, being a weekly chart it shows the closing price of each week. This analysis is considered by some as more telling, rather than confusing the mind with Bar, Candle or Heiken Ashi charts (to name just a few of the more popular). So, back to the chart - although volume appears to have a little work to do, price has broken a 2.5 year down trend. Obviously there is strong resistance at 2400. "If" this index gets the volume (buying) that it needs to continue its uptrend, the measured move once it takes out the high of 2400 - is..... wait for it ..... 3200.
Will this happen? How do I know! :)
What I do know is, rates are falling, so is inflation, the $US is falling which can be good for US stocks, oil is cheap which is good for many businesses, the US election is an unknown - but it would not surprise me to see markets settle and then rally once it's over. Employment is steady too. So, on the other side of the bears are the bulls, maybe even the "Goldilocks economy bulls". A saying once quipped by Alan Greenspan (ex Fed chairman) before the 2007/8 crash and GFC.
Of course we have risks, the Middle East, Taiwan, US debt, unemployment could rise. The list is long and the market climbs a wall of worry. How do we manage all this diversity of thinking and feelings?
Trade within your means, manage risk, have a plan - particularly an exit plan. Stay healthy, exercise, eat well, hang out in nature to remind ourselves there is something bigger than just us and the markets "out there".
PS: if you scroll down and look at last weeks chart comparing the XGD with the Gold price and my comments about them tracking each other - the XGD is now (this week) outperforming the Gold price. With last nights rally in precious metals in the US, this trend will continue until buyers are exhausted. I will discuss the gold and gold stocks next week, as I want to wait and see how gold and the gold stock sector performs this coming week. I expect gold stock juniors to go bannanas but I have also learnt to expect nothing.
Until next week
Peter
COMMENTS AND ALERTS as of the Fridays close 11/10/2024
See charts below with an On Balance Volume indicator and the Money Flow Indicator using a 13 period
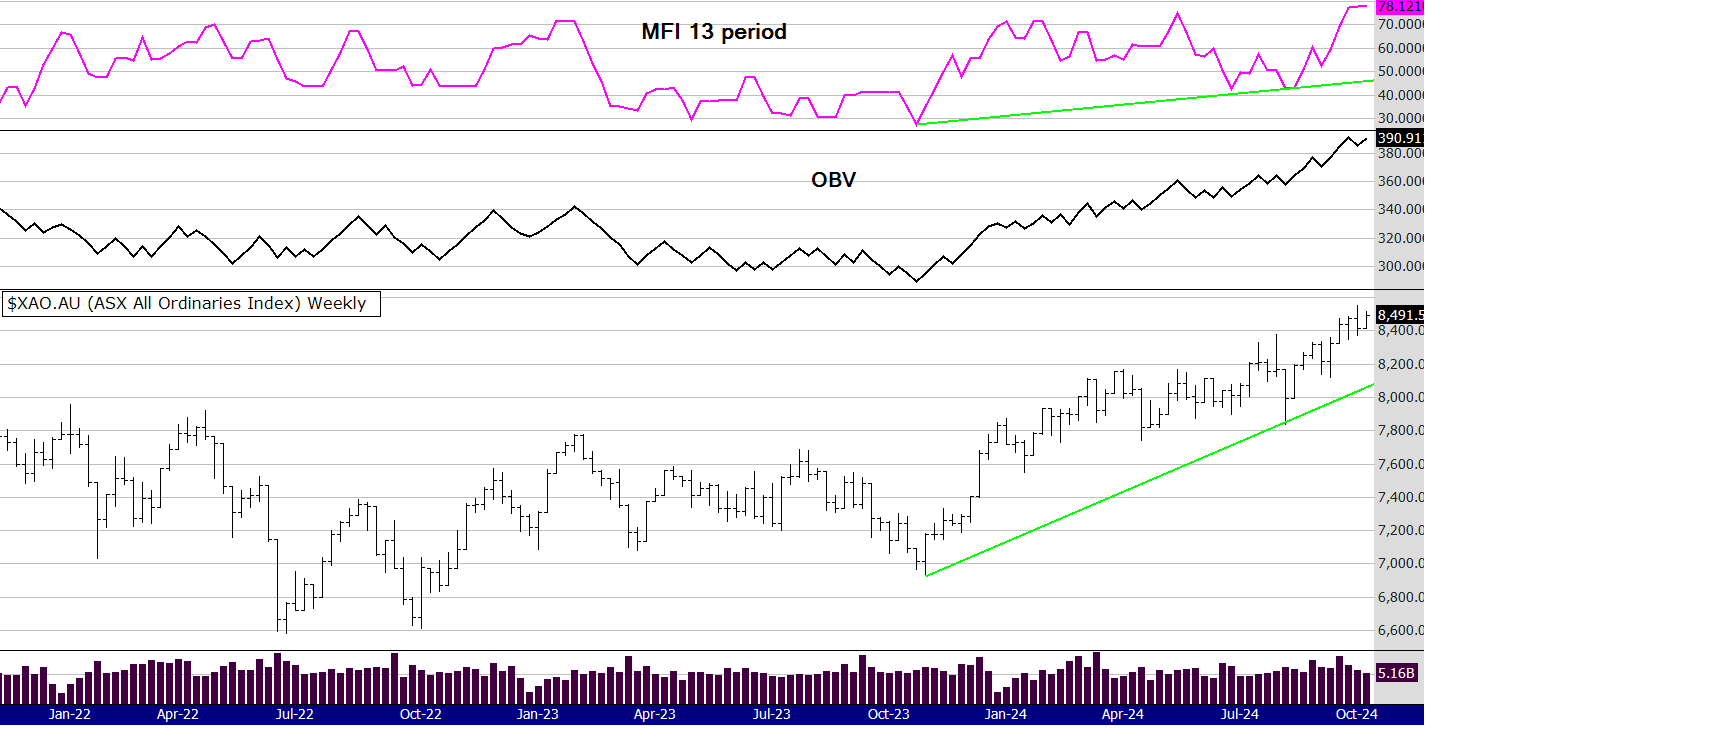
The XAO is still trending up. A little less volume the last few weeks which is understandable. The market climbs a wall of worry and the current worry is the US election in early November. Many economists are concerned about a Trump win, why? Too much unknown. Markets prefer certainty and therefore prefer a Harris win. That would mean "steady as she goes" ( no pun intended) and not so much change. I think markets may rally after a Harris win but I am not one to predict, just a gut feel. I want to discuss the Russell 2000 again this week, as it is the most correlated US index with the XAO.
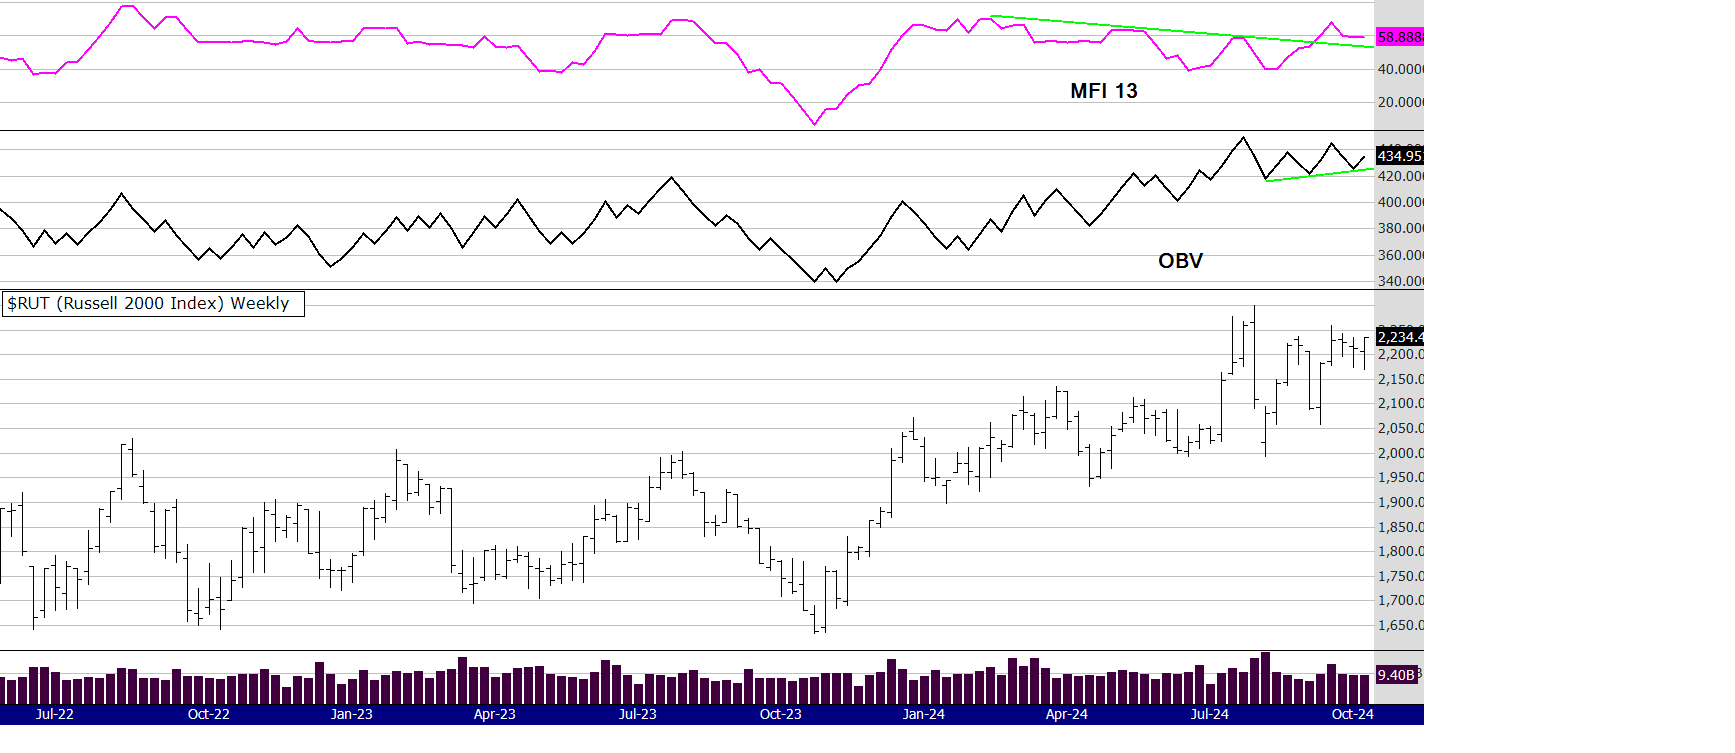
As you can see its looking quite strong. Despite the doom and gloom from some analysts, this index which reflects more the health of Main street not just Wall street, appears quite healthy. It is showing that the rally in stocks is becoming more broad based and that it is no longer just the magnificent 7 driving the market. One more chart - comparing gold with the Australian gold share index.
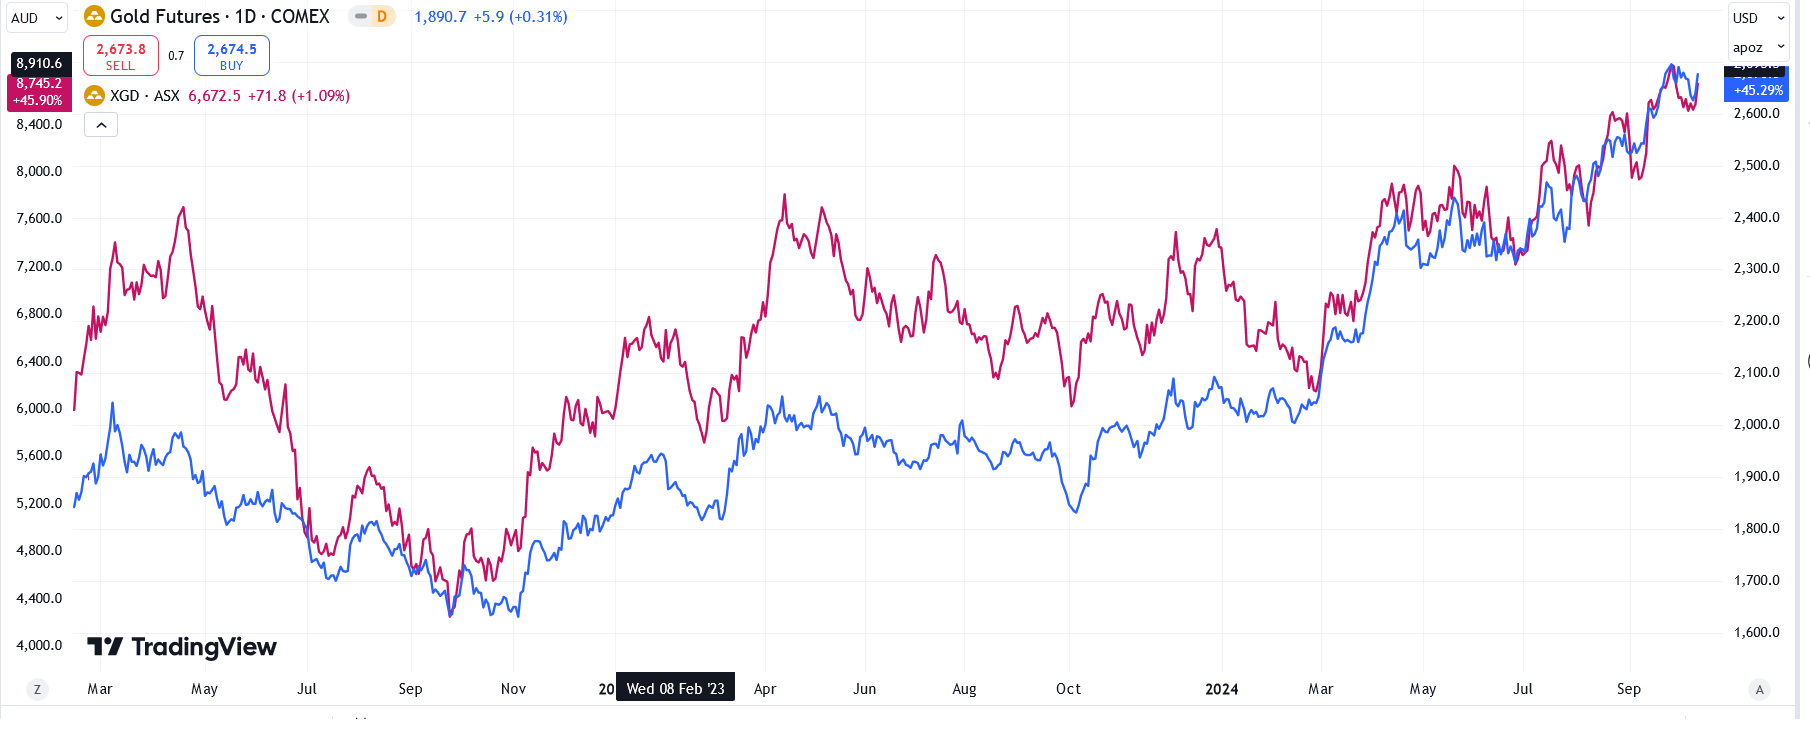
A frequent comment I hear is that gold stocks are not keeping pace with the gold price - or that the stocks are not outperforming the gold price as they "should". Well, there are no "shoulds" in trading, just what's happening. As you can see stocks ARE tracking the gold price and very closely since March. In the past (which is not the present) there have been times when gold stocks HAVE outperformed the gold price. Will they start to outperform again?
How do I know ! :)
What I do know is that it could happen, and if it does happen, the place to be is in the mid and small cap gold miners that are yet to perform.
That's it for me this week. Apologies for missing last weeks post.
All the best,
Peter
Alerts for this week are below,
ALERTS FOR THIS WEEK POSTED BELOW
52 week closing highs as of the Fridays close 11/10/2024
Below are the alerts from a scan of the ASX 300 and the 300 to 500
300: MAF TPW
300 - 500: BLX BVS RPL
The signals provided are WITHOUT A BULL FILTER.
See charts below with an On Balance Volume indicator and the Money Flow Indicator using a 13 period
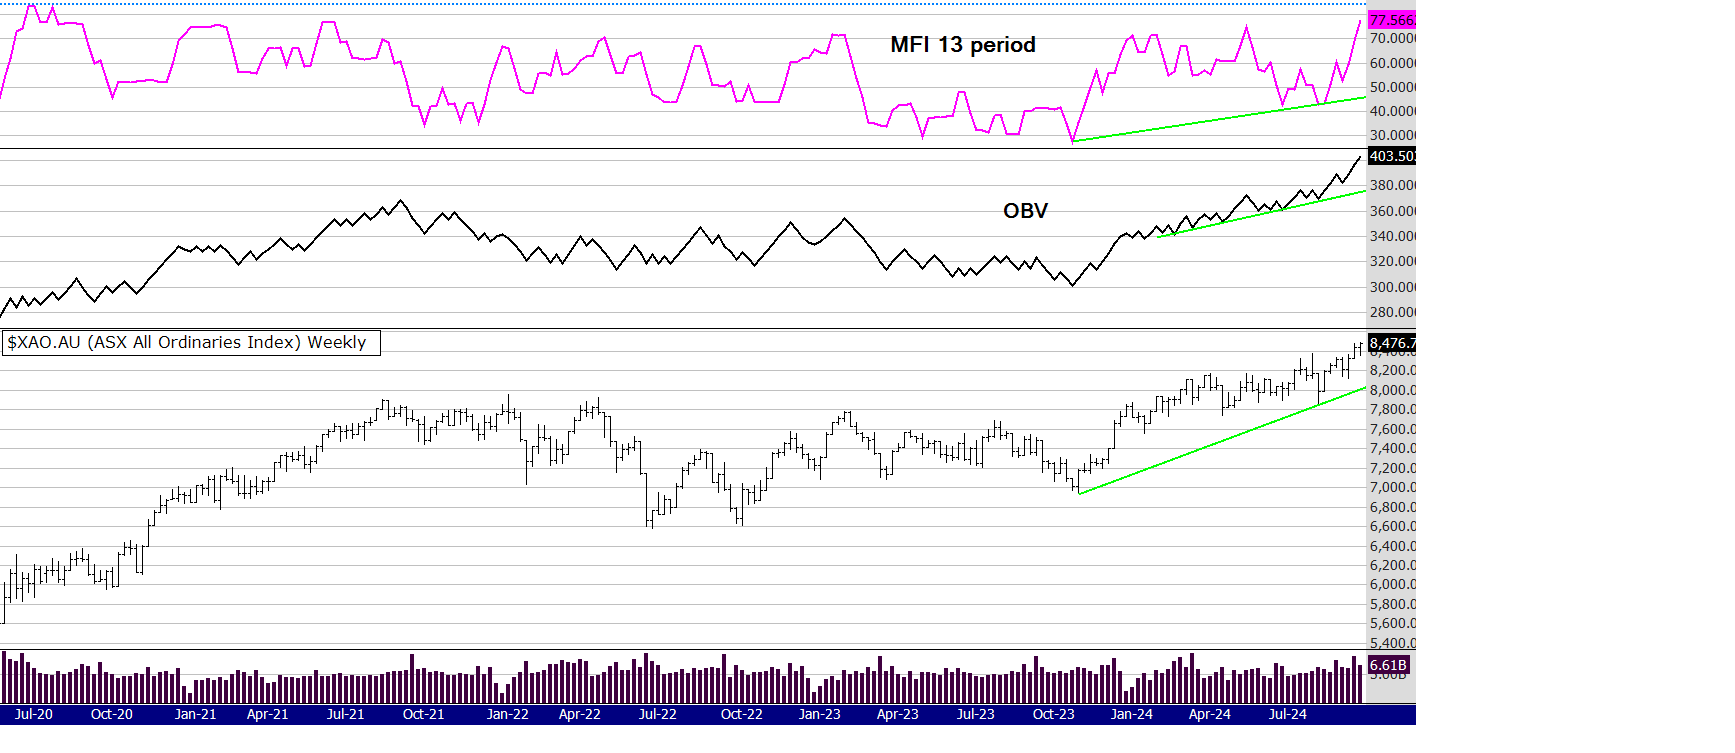
I am writing this Monday 30th September - a bit late this week as I was away for the weekend facilitating a Zen workshop. Unfortunately with some of the recent bugs on the site I have managed to accidentally delete some previous weeks comments, so I will repeat some comments here.
What appears outstanding with this recent rally is the OBV - it's strong, very strong. Its outpacing the price, what normally happens here is one of two things.
1/ the price plays catch up.
2/ the price slows or even falls a bit to revert back to the "normal" correlation between price and volume.
Looking at the 13 period MFI you can see it's made a 52 week high, its much higher than it was in Sept 2023 and is now approaching the over bought (OB) area which was way back in July 2020. However! Interestingly you can see the price continued on from that high in July 2020 to rally another 2000 points or around 35%, from 6000 to 8000. That is a great example of how indicators - be they technical or fundamental, do not predict the price. Indicators provide some essence of probability but -
price is the ultimate indicator.
Here is another chart to discuss, that I think has very big ramifications for the Australian stock market in the near future (weeks to months perhaps years).
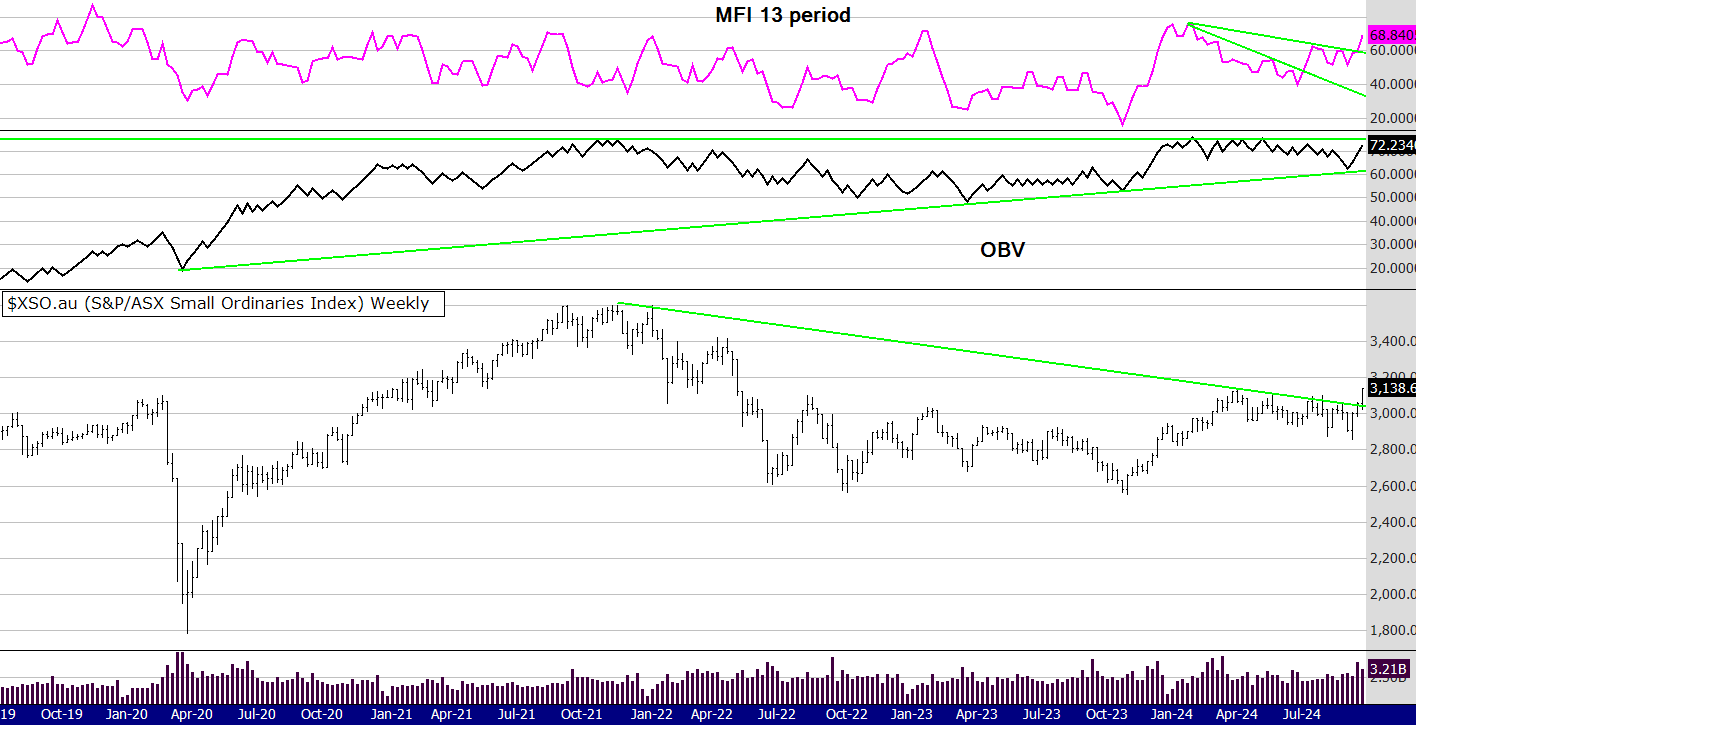
For quite a few years now the discussion amongst many analysts has been that the market, both here and in the US, has not been broad based. It's been dominated by the Gorilla stocks such as the Magnificent 7 in the US and the big stocks here in Australia. Eg: CBA, WES, WOW, RIO etc., which are all in the top 20. The narrative was, that what the market (and the economy) needs is to see the mid cap and smaller companies start to perform. What was holding back these companies? You probably guessed - interest rate cuts.
So, the chart above is clearly breaking to the upside. The XSO represents the stocks in the ASX 300 that sit between 100 to 300, It cuts out the top 20 of course as well as the remaining top 80, excluding completely the top 100, focusing on the mid caps and smaller companies.
The price has broken a 2.5 year down trend, the last 2 weeks of volume have been very bullish and the volume indicators are responding. Every alert this week from the ASX 300 (ten of them) is from the 100 to 300, that should tell you something, it's obvious, that is where the strength in the market is.
Now, even though the MFI is approaching the OB area, as we have seen before, price can continue. IMO there is now something of great importance to watch closely, the OBV. If, (trading has lost of if's) the OBV makes an all time high - which is not far away, this will be another huge bullish sign for this sector, the stock market, the economy, politics, macro economics, the works. Of course there is much discussion about how long this rally will last, all based around the many indicators be they technical or fundamental, but markets are strange beasts and they will do what they want. Once human emotion takes over and FOMO kicks in prices can go to very high levels. Those of us that traded during the dot.com years of 1995 - 2000 know this well. So, one more chart and you are going to think I am crazy.
The chart below is the SPX from the US. It's a quarterly scale to take out the noise. In 1996 when this index made a new all time high, it doubled in 2 years from 500 to 1000, it tripled in 4 years (1996 to 2000) from 500 to 1500.
A doubling from the recent all time high of 4,800 will take the market to 9,600, a tripling in 4 years will take it to almost 15,000. Can't happen?
It has before! And, the chart below (for effect) is NOT in log scale, do yourself a favour and look at it in that format allowing for % gain, it looks more probable.
Food for thought,
have a great week,
Peter.

Alerts for this week are below,
ALERTS FOR THIS WEEK POSTED BELOW
52 week closing highs as of the Fridays close 27/9/2024
Below are the alerts from a scan of the ASX 300 and the 300 to 500
300: A4N DEG IDX INR LYC PXA RUL SDR SFR TUA
300 - 500: FWD
Please note: in the eBook I wrote in 2016 (available for purchase on this website on the link below) I have made some changes to the system. If you have bought the eBook I am happy to email you a PDF explaining the changes I made, which from testing and trading does improve the system.
Here is the link to the eBook Mindful Trading using Winning Probability written in 2016 -
and the internationally published The Zen Trader (2022) - now in three languages, English, Spanish, German and in 2025 Traditional Chinese.
IMPORTANT POINTS TO CONSIDER
A new 52 week high for this system is classified when the stock price is at its highest close (or equal to the highest close) counting back 52 weeks.
If a stock continues to make new highs, for example in the 53rd and 54th week, they are now regarded as ROLLING highs, not NEW 52 week highs.To clarify again, the buy signal for THIS system discussed is a NEW 52nd week or 1 year closing high, not a rolling high as is often given elsewhere.
See charts below with an On Balance Volume indicator and the Money Flow Indicator using a 13 period

This week I will keep it brief. The XAO had a reasonable week considering the big falls on Monday. Volumes are holding OK. It's a wait and see game now as to how next week trades and if buyers return to support the market.
A lot of that will depend on how the US markets perform on Friday their time.
I will update this page on the weekend.
So I wrote the above on Friday night before US trading - and how did it go and how did the indexes close for the week? Below is a chart of the globally dominant SPX.
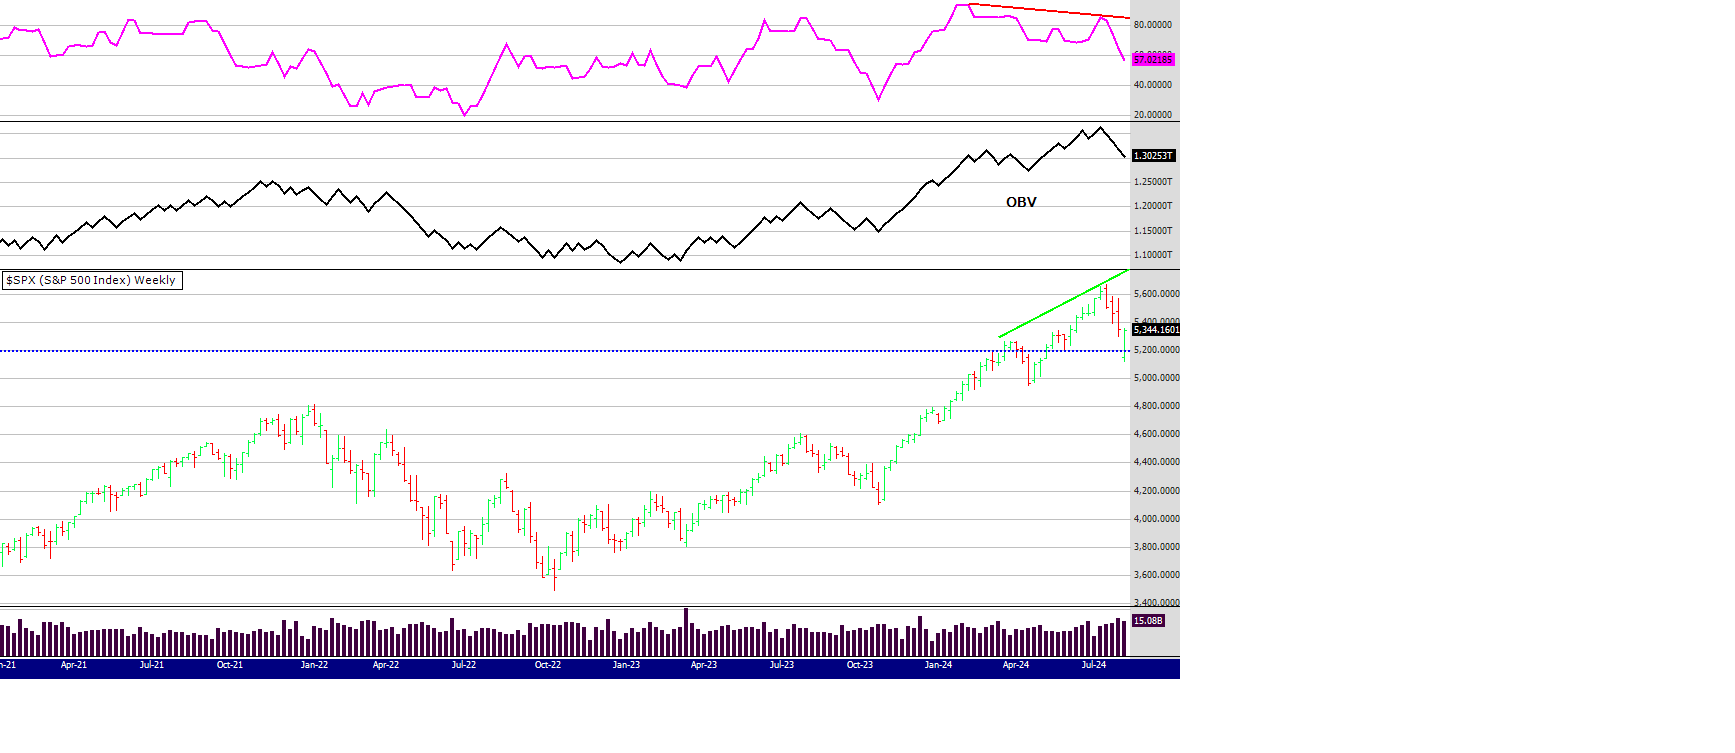
The MFI 13 period was showing a negative divergence, markets were nervous and all it was going to take for a fall was an event. Well we got one, the Japanese raising rates. However that is the past, what about the present? In my opinion until this index breaks below the low in April of 4953 it is still in a weekly uptrend. Others may disagree but that is the level I think is critical.
The MFI on the SPX is still pointing down but if you change it to a shorter time frame (6 weeks) it is in over sold territory. Also, I like to remind people that "one bar does not make a trend". Although this weeks bar is very positive, the index has more work to do to convince the bears and those nervous about the "what ifs".
Let's now turn our attention to the Russell.

Before this recent correction the focus of many was on the rotation from big caps to small and medium cap stocks. How quickly people forget the current narrative and move to the next! Looking at the chart above it appears that the rotation is still healthy and alive. Which will be good for the ASX as the Aus market is closely correlated with the Russell - as discussed many times here in these comments. (scroll below through previous weeks to find that)
Volume support on the Russell appears stronger that the SPX. This makes sense as the SPX contains the Gorilla stocks (Tesla, Nividia, Apple - the magnificent 7 etc) that were being sold off and funds rotated into the Russell. For example, compare the volume bars of this week between the SPX and the Russell. For every seller there is a buyer and there is obviously many buyers active in the Russell.
I notice too last night in the US that the futures for XJO (top 200) outperformed the US SPX -a sign of things to come? One bar does not make a trend :)
Gold: no chart today but the trend continues up. The GDX in the US was up another 1% last night and one would expect (be careful using that word) that the Aus gold stocks will rise again on Monday.
As you can see there were no 52 WH alerts this week - not surprising. Stepping aside when the market is not giving signals is a feature of that system.
Thats it! Have a great weekend and I am off to help organise a 21st birthday party.
Cheers!
Peter
See charts below with an On Balance Volume indicator and the Money Flow Indicator using a 13 period

Lets talk about the chart of the XAO. One bar does not make a trend IMO. Sure, its got a bearish look to it - this weeks bar, but I repeat, one bar does not make a trend so we need more information to make a bearish or bullish call. Probably the most difficult thing about being a market participant is uncertainty. All we really have is the present because no one knows what the future holds, there is probability and you can manage your portfolio around that, but no one knows whats going to happen. If you want to read a little about my thoughts of "what if" and "don't know" click on the link for a newsletter I wrote back in 2015.
https://www.easysharetradingsystems.com.au/products-and-services/archive/listid-1/mailid-79-what-if
So whats happening in the now? Coming back to the chart we can see its still trending up, volumes are holding and despite this weeks volatility, this weeks low and this weeks close, are still higher than the week before. Also there are 6 stocks making 52 week closing highs this week in the ASX 500, so some stocks are performing well.
Last week I said " Its also a very difficult market to trade because moves up, and down, are fast and unsettling.
And
"So! Have a plan in mind how you will manage your trades ............."
Speaking of plans here is the performance of the eBook system on the ASX 500 the last 12 months. 16% without dividends included.

I acknowledge its not knocking it out of the park, but its not losing either. I checked my recent 3 month portfolio performance last night, up 2 % since late May. It was up 7% , but this week it got knocked around. Its been a tough time and I admit to feeling exasperated as I am sure many are.
Lets look at arguably the most important index. Nasdaq 100.

You can see by looking at the negative divergence of the MFI that the index was overbought - nothing new, analysts have been discussing that for some time and charts don't lie. The price is on support and the OBV is yet to break into a downtrend, if that happens the chart will look weaker. However, in the present, IMO, we have a correction, not a crash. Price could fall to the next level of support and to the previous low on the OBV. Technically speaking the downtrend won't be in play until the low in April 24 is taken out, because that's the last pivot low when analysing a weekly chart. A little disclaimer here.........I am not the best T.A. analyst in the land, others may see it differently, but that's what I see.
One more chart and I am done for today..........

There has been more talk (by myself too) about rotation of stocks out of big caps to smaller caps. Looking at the chart above you can see the more dynamic MFI volume indicator was warning perhaps that theory had got ahead of itself, it was flashing a big divergence. However the OBV is in a solid uptrend and so is the price action. Yes, the chart has past price resistance to work against and it's going to take more belief from investors that the rotation philosophy has legs, that its not a "fly by night" event. The price has pulled back to a 2 year support level so it remains to be seen if it can hold.
Summary: if you don't have a solid system that you are committed to, its probably a good time to sit out for a while and see what happens over the next few weeks. Regroup and re-plan.
I said i was done but I will mention gold stocks.
Similar to the other indexes the GDX in Aus may have got a little ahead of itself, its flashing volume divergence - but the trend is up, the divergence is not that bearish and as I said a few weeks ago I hold core positions in gold stocks and I wouldn't be shorting them!
That's a long read, if you got this far congrats!
Until next week
Peter
See charts below with an On Balance Volume indicator and the Money Flow Indicator using a 13 period


Keeping with the theme of the last few weeks - which has been
1/ its a bull market.
2/ the top does not appear to be here.
3/ trading is about probability not prediction.
4/ historically there is a strong correlation between the Russell 2000 and the XAO.
5/ US stocks appear to be rotating from large caps into the Russell 2000 suggesting that stock market breadth in the US is widening - which is bullish.
6/ The XAO is lagging the Russell, as seen in the chart above, either the Russell will fall or the XAO will catch up - I think the latter is more probable.
Overall this appears to be a very strong market - a big rally or even a blow off top may be coming, who knows. If a blow off top eventuates we will deal with it at the time.
My experience and intuition tell me this market is similar to the late 1990's. A period when the market produced gains beyond peoples wildest dreams. Its also a very difficult market to trade because moves up, and down, are fast and unsettling. Dips are to be bought (which takes nerve) and big gains after fast rises are to be sold. A strategy I have used over the years is to sell 50% of my holdings after a stock has risen 70% - by tightening the stop, after that I let the rest ride until my primary stop has been hit. I do not re-enter the trade, gnash my teeth over "what may have been" " I should have " "I could have" etc. Rather than re-enter I move on to the next trade. Like a pro tennis or golf player we play one shot at a time. One trade at a time. Let the bad trades and shots go.
Otherwise they are all negative, soul destroying thoughts, often produced by the simple fact the trader had no strategy in mind to deal with the many possibilities the market may throw at us.
So! Have a plan in mind how you will manage your trades if the market rallies hard and even produces a blow off top from here * Also keep an eye on that correlation between the Russell and the XAO, it's an important one IMO. If the XAO plays follow the leader, there are going to be many opportunities in the Aus market, maybe starting as soon as Monday.
Until next time
Peter
* ATR trailing stops, active at all times in the market are an effective tool. At times they will whip you out - but save you if the market plummets suddenly.
See charts below with an On Balance Volume indicator and the Money Flow Indicator using a 13 period

Comments from last week: Trading is based around probability IMO. I think it's probable the XAO will consolidate here for a while, do some "backing and filling" as many readjust their portfolios for the rotational change that has just occurred. That change being a rotation from some bigger overbought stocks into the smaller and midcap stocks that have not been a part of this rally - yet.
The market rallied up fast but then fell to exactly where it opened as consolidation and readjusting of portfolios and the new paradigm took hold. What new paradigm? Probably mostly Trumpanomics, as traders and investors moved money to stocks and sectors that may benefit from a Trump win.
However, looking at the chart it now looks even more bullish than last week. Volumes have increased and the OBV has made an all time new high suggesting price will catch up to volume - that means higher prices.
Back on the 14th June I talked about the correlation between the Russell 2000 in the US and the XAO in Australia. You can scroll down on this page to see the chart and my comments on that date.
Looking at the present price action you can see the XAO is correlating nicely to the Russell as it has often done - except for the extreme times during Covid, but the XAO still went up, just not as much. I know there is a lot of fear and uncertainty at the moment, the main fear being that this bull market can't last much longer and the sell off (reallocation of funds) from the Nasdaq will create a bear market. Well, that's not what I think when I look at longer term price and volume charts of the Russell, but that's another discussion and perhaps next week I will post some charts showing what I mean.

Have a great week
Peter
See charts below with an On Balance Volume indicator and the Money Flow Indicator using a 13 period

Last week I said this
"However the Russell 2000 still drags the chain making me wonder what will it take for that index to come to life? Definite, not just rumoured rate cuts perhaps......... the chart above does seem to be improving - and perhaps building for another leg up"
Well what a week! The Russell surged around 6%, the continual expectations of rate cuts in the US encouraged traders and investors to buy the index. I have spoken many times of the correlation between the Russell and the XAO, and this time the correlation again proved itself.
Looking at the chart above you can see clearly the 13 period money flow Index has broken its down trend line, however the less dynamic OBV has some work to do. Trading is based around probability IMO. I think it's probable the XAO will consolidate here for a while, do some "backing and filling" as many readjust their portfolios for the rotational change that has just occurred. That change being a rotation from some bigger overbought stocks into the smaller and midcap stocks that have not been a part of this rally - yet.
Gold exploded again, however some of the gold stocks look a little overbought, but I wouldn't be shorting them. I did lighten up a little on gold stocks this week taking some money off the table - I may have that wrong and they could keep surging but I still hold core positions.
Alerts below and have a good week.
Regards,
Peter
See charts below with an On Balance Volume indicator and the Money Flow Indicator using a 13 period
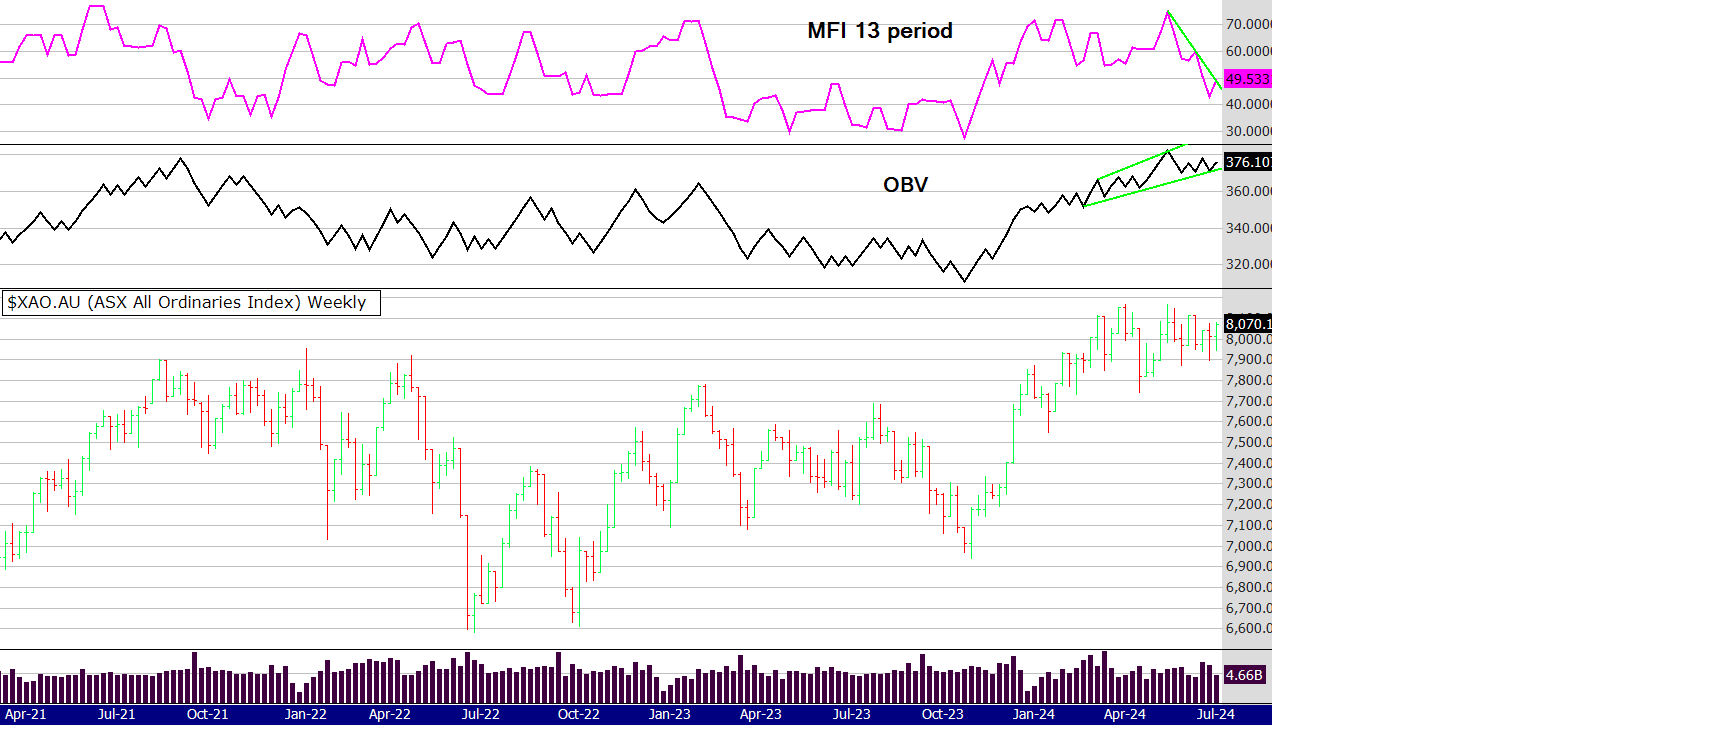
Well wasn't that an interesting week! On the 1st July money poured into the resources, energy and commodities sectors and made me wonder what do others know that I don't? I found out in a few days as hopes and expectations of a rate cut in the US fueled a rally in the oversold commodities sectors. Gold went along for the ride and had another strong day on Friday in the US. However the Russell 2000 still drags the chain making me wonder what will it take for that index to come to life? Definite, not just rumoured rate cuts perhaps.
The financial sector also had a strong week and what will that sector do if we don't get a rate rise? We will have to wait until the 17th July when the June quarter CPI figures are released and maybe the Aus market will plod sideways until then. Who knows, I am just writing my thoughts about what may happen but we need to stay open minded to possible "good" news as well as "bad" news.
I am a regular listener to the Fear and Greed podcast. Recently they were discussing that banks now made up 31% of the market cap in the All Ords and resource stocks 23%. So 54% of the Aus market is banks and finance. If those two sectors rally, the index rises.
So, looking at the chart above it does seem to be improving - and perhaps building for another leg up. The price action is a little ahead of the OBV, but the MFI is in oversold territory and starting to move up. The 52 WH system is still producing regular buy alerts (five this week) indicating that the market has some strength. A sector that continues to surprise here in Aus and the US is the Consumer Discretionary sector. It seems it takes a lot to stop people spending and the RBA must be wondering what to do next.
Many have there theories about inflation. In 2022 the Australia Institute released a research paper claiming 70% of inflation in Australia was caused by excess corporate profit. It was initially slammed. In 2023 the OECD released a similar finding about Europe! Now this year in 2024 we have the following, claiming US company profits are responsible for over 50% of inflation. See the link below.
Raising rates wont fix the problem if the authors of the three papers are correct. We need fiscal policy not the blunt tool of rate rises in my opinion.
https://www.theguardian.com/business/2024/jan/19/us-inflation-caused-by-corporate-profits
Thanks for reading and until next week
Peter
See charts below with an On Balance Volume indicator and the Money Flow Indicator using a 13 period

Not much to say this week. It's a game of wait and see. Obviously the thought of higher rates from the RBA in August did not help the sentiment this week. Price dropped down to the blue dotted support line and then bounced back up. There is a glimmer of hope from the U.S. as the Russell 2000 continues to show some support. I talked about that over the last few weeks - and this week the trend continues of the Nasdaq falling but the Russell rising. Anomally? Or rotation from big tech to the broader market?
If the XAO tracks the Russell as it historically does we may have a better week but sentiment is waning.
I remain positive until the charts show a clear breakdown. At the moment they are hanging in there.
Regards
Peter
See charts below with an On Balance Volume indicator and the Money Flow Indicator using a 13 period

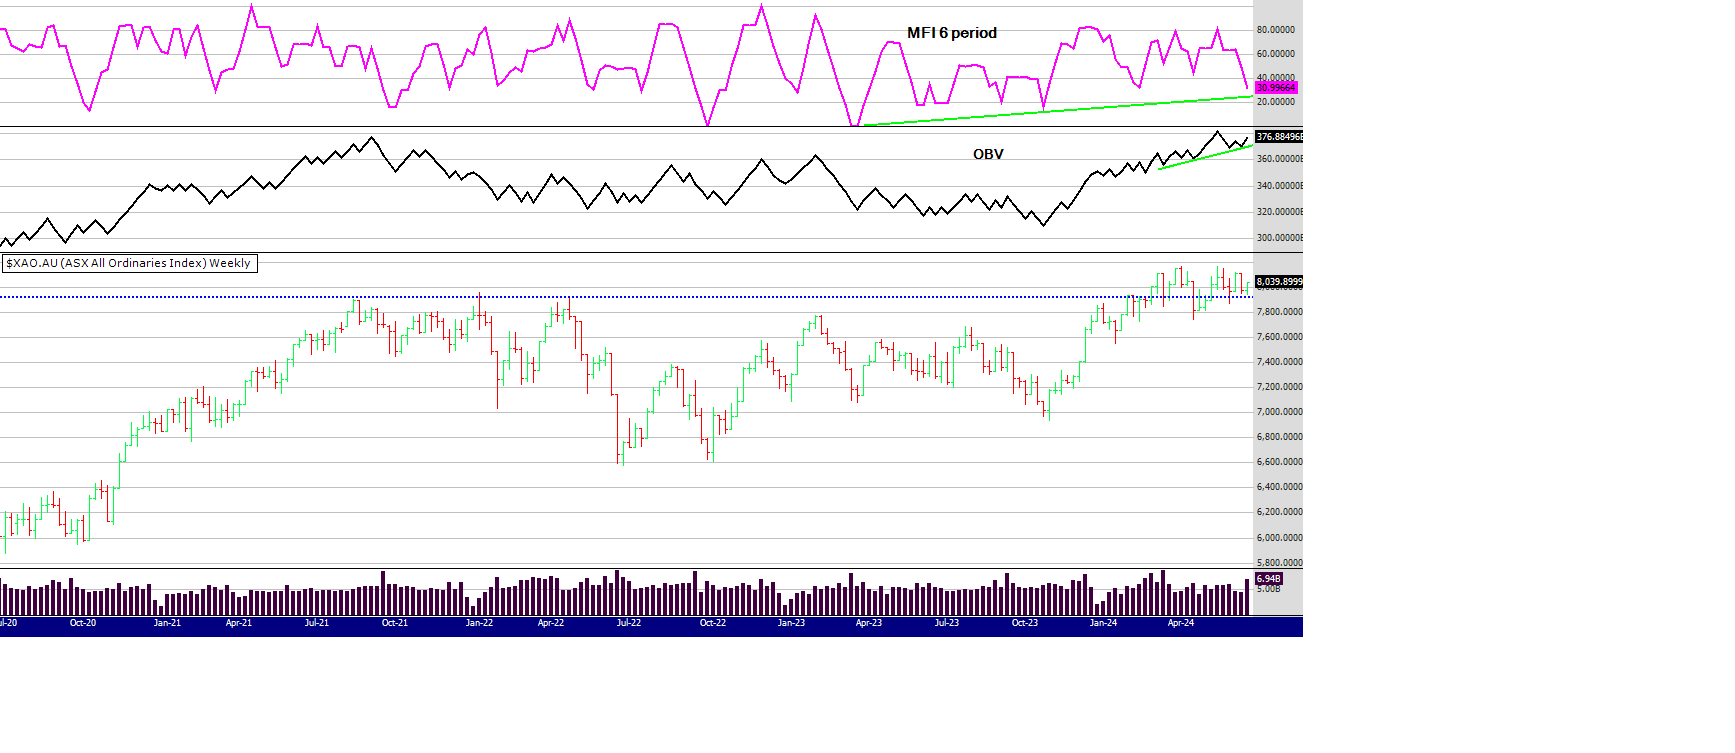
I am going to get a little technical this week so you are either going to love it or hate it :)
The MFI is a more dynamic indicator because of the way its calculated - see here https://www.investopedia.com/terms/m/mfi.asp
Sometimes the MFI can give strange signals - so sometimes (not often) it can help to change the time period of the indicator - to help analyse probability. In the top chart you can see that OBV is looking strong but MFI 13 week period is breaking down, what's that about? In my opinion its because of the big volume bar this week skewing the look of the indicator.
Moving down to the 2nd chart using the 6 period MFI you can see it's in oversold territory. I chose a six period (6 weeks) because that's the time frame (some say 7 weeks) markets or stocks often move up and down, before either taking a pause or reversing. Here is another link here for you to read up about that https://www.tradingview.com/script/kDC1dFjU-7-Week-Rule/
I think this market is still strong - despite the worry and bearishness expressed by some. This week there are 7 new 52WH signals and that is not the sign of a weak market. Of course prediction is not the aim here, but we are trying to glean from the stats and charts the probabilities of market direction.
As often mentioned I am keeping an eye on the Russell in the US. You can see on the chart below how closely corelated the XAO is with the US index. At the moment the XAO is outperforming and it's going to be interesting to see what happens if the Russell picks up the pace. Will the XAO continue to follow its bedmate - or is the XAO overbought? Is the Russell telling the XAO its got ahead of itself?
Or, is the XAO (Aus economy) now the stronger index?
I don't think we will have long to find the answer,
until next week
Peter
See charts below with an On Balance Volume indicator and the Money Flow Indicator using a 13 period


You either love trading and investing, find it interesting and challenging or it really frustrates you. This week I admit falling into the latter mindset as the market went through its "normal" ups and downs. Normal as in indecision, worry, fear and uncertainty. That mindset is reflected in the fact of only two 52 week highs this week for the Mindful system.
Taking a step back from all the emotion continually surrounding us - is the fact the chart above still shows a strong uptrend. Price has come back to horizontal support of around 8,000 and the volume indicators are hanging on also at supportive trend lines. You can see that the market has gone up and down now for 12 weeks, between 8150 and 7800.
Fears over the direction of interest rates continue and the commodity stocks took a hit as prices in most underlying commodities fell. On Friday night in the US some commodity prices and stocks recovered a little, so we may get a better start to the week on Monday.
Until the market gets some positive news the probability is it will drift sideways to lower. Unless of course the US indexes continue to rally and pulls our indexes along for the ride. Strength still appears to be in the Tech sector - as much as I want to see the Russell in the US perform, it wont happen until it does.
Until next week
All the best
Peter
See charts below with an On Balance Volume indicator and the Money Flow Indicator using a 13 period

Strong price action this week on low volume. This week the top 200 performed well and the Small Ords (100-300) was flat. Also this can be seen not just by looking at the charts, but the 52 week highs confirming. Just one alert in the 300-500 but six in the ASX 300. Three of those six alerts being in the ASX 100, ALL CAR CBA.
Last night the gold price was sold off heavily, perhaps my comments on the 24/5/24 were correct - scroll down to see the chart of the GDX that I posted a few weeks ago and here is a repeat of my concerns.
"Looking at the Monthly chart of the GDX below I would like to see more volume. May is nearly over, the volume is down a lot compared to April and next week in the US is only a 4 day trading week because of Memorial day on Monday. The OBV is hitting overhead resistance and the 3 period (3 months) MFI is at the top of its range. There is no doubt price is in an uptrend, but to make the price continue its uptrend it needs more love, and the language of love in the markets is money - volume."
So people lie and we all suffer from cognitive bias, but charts do not lie - no doubt some knew about the Chinese factor.
However that comment back in late May, did not stop me getting sucked into the short term rally we had before the Chinese announcement (they bought no gold in May) as I added to some gold stocks on Thursday, but thankfully only a little. We have a holiday here on Monday for Kings Bday so who knows what the market will do when it opens on Tuesday.
Uncertainty prevails around interest rates (not helping gold and commodities) and it seems the debate will continue for the rest of 2024 - until clear data emerges its appears most central banks will play the waiting game - interesting that the ECB bit the bullet and cut last week (which made gold bounce before China stomped on it)
One more chart and a focus on divergences, something I regard as a powerful technical signal. You can see clearly the divergence between price and volume on the gold chart below. The MFI is a faster moving signal than the OBV. It's pointing down quickly and more falls would not surprise me, price could come down a lot more - even as far as major support around 2000. Never forget anything is possible in the markets.
The longer term trend line of the OBV could still hold and price fall a lot more.

I read an article yesterday claiming the first 2 weeks in July is normally the strongest fortnight in the market - data dating back to 1928. Looking at the price action last week we need one hell of a rally for that record to be maintained.
Enjoy the long weekend and that's all till next week.
Regards
Peter
See charts below with an On Balance Volume indicator and the Money Flow Indicator using a 13 period

I will discuss the chart above before moving to the one below. The correction from over bought territory continues but volume support remains. Next week will be crucial to see if volumes break to the downside. I suggest you read the last 2 weeks comments about what I think is happening in the markets. Please scroll to the chart below.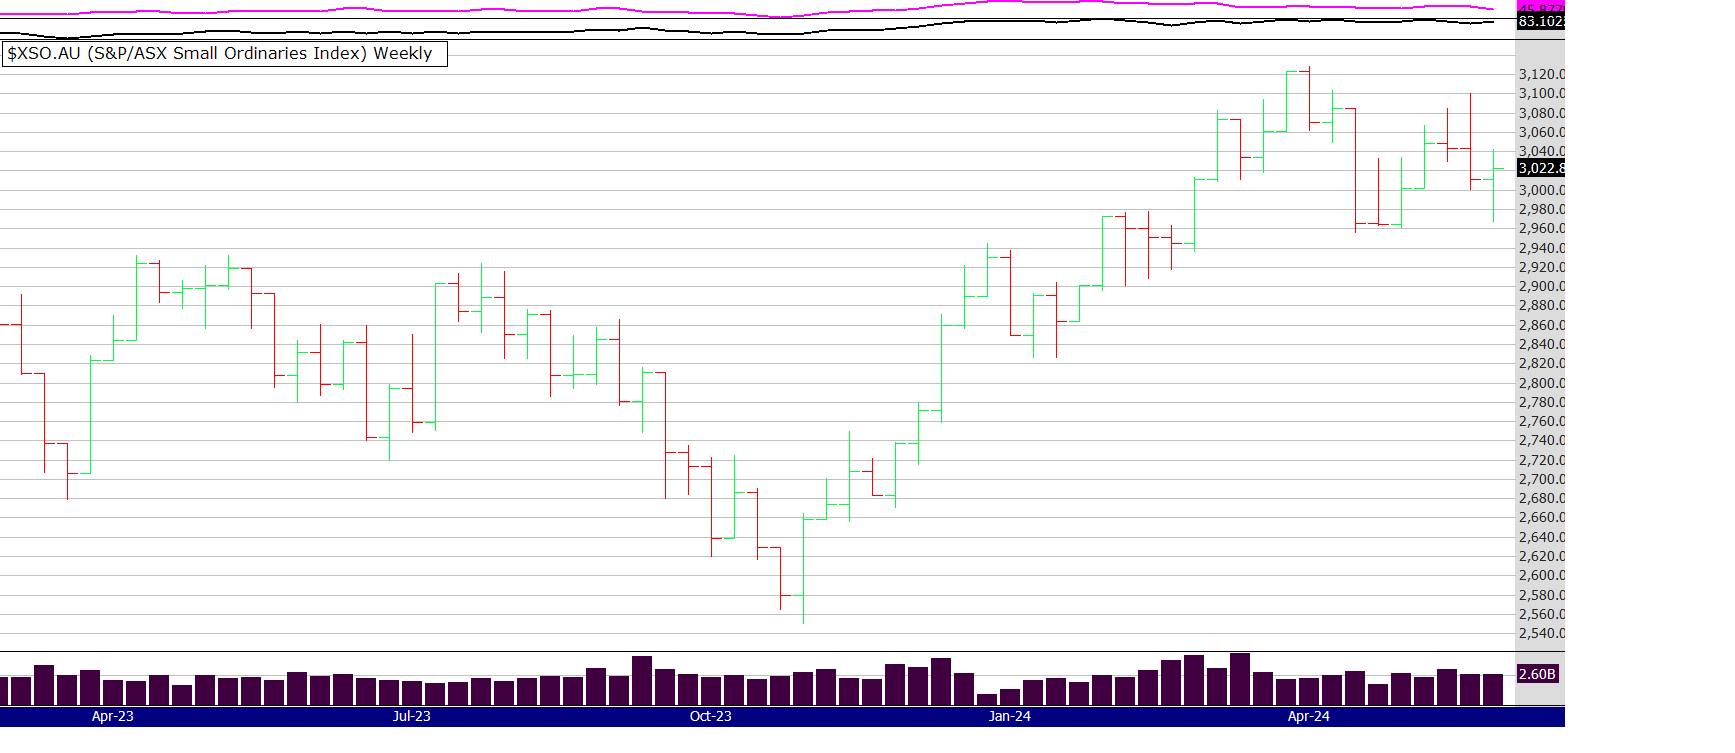
This is a chart of the Small Ords, the index represents stocks in the 100 to 300 range of the ASX. A similar grouping to the Russell 2000 in the US, that index represents stocks in the 1000 to 3000. Note the last bar, its green and the close is up, as opposed to the XAO (that contains the top 100) where the bar is red and the close is down.
This price action shows to me that interest in the smaller stocks is increasing, traders are rotating out of large caps looking for opportunity elsewhere. Also the market remains strong with eight 52 week closing highs. For more detail on my thinking re read the last 2 weeks comments, nothing has changed - yet.
Short and sweet this time
Have a great week
Peter
See charts below with an On Balance Volume indicator and the Money Flow Indicator using a 13 period

Looks like I jinxed the market saying last week it looked over bought with the 13 period MFI at the top range of the chart. The market is nervous at the moment, interests rates , inflation, sell in May cyclical theory, low growth, strained consumers etc. The market does climb a wall of worry so it's all nothing new. However the chart above still looks healthy IMO. It could correct down a bit more but until price and volume break down more - I see last weeks price action as a normal correction after 4 strong weeks.
I notice this week the 300-500 has generated four 52WH signals and the top 300 just two. Is this a sign that the market is rotating into the smaller caps? If so its a good sign and indicates market breadth.
Last week I said I had a flat week. This week my portfolio did well on the back of gold stocks, although the rally faded late in the week and it remains to be seen what happens this coming week. Actually, looking at long term charts of the US GDX and the Aussie XGD (the gold sectors for US and Aus) I have doubts as to the longevity of the gold stock rally (for the time being) The hype in the sector is often a warning sign that a correction is near. Lets hope I am not jinxing all those gold stock holders out there!
Looking at the Monthly chart of the GDX below I would like to see more volume. May is nearly over, the volume is down a lot compared to April and next week in the US is only a 4 day trading week because of Memorial day on Monday. The OBV is hitting overhead resistance and the 3 period (3 months) MFI is at the top of its range. There is no doubt price is in an uptrend, but to make the price continue its uptrend it needs more love, and the language of love in the markets is money - volume.
Perhaps fund managers will support the gold indexes with the end of month shenanigans that sometimes happens...........
Until next week
Peter

See charts below with an On Balance Volume indicator and the Money Flow Indicator using a 13 period

This week I have changed the chart for the candle stick devotee's. Looking at the chart above you can see the OBV has blasted to new all time highs, (blue dotted line). However the MFI is in overbought (OB) territory , again see the blue dotted line. I dont see a problem with that. As often mentioned the MFI is a more dynamic indicator and it can stay in OB territory for some time before correcting. EG: look at July 2021.
My week was interesting. I hold mostly small and mid cap stocks and my portfolio went sideways. It was a week for the Gorilla stocks, Gorilla stocks mainly in Resources and Materials. Other sectors seemed reluctant to join the rally so perhaps some disbelief about the market amongst investors still prevails. Even gold stocks, despite the recovery in the gold price, seemed reluctant to join in.
However!
I notice a big rally in gold stocks (lithium, copper and uranium too) last night in the US so Monday on the ASX will be interesting. Those stocks should take off like an Elon Musk rocket - but we all know sometimes those rockets fail :) Some more comments on Gold below.

I have reposted above, an updated version of the gold chart that I posted last week. Also here are my comments from last week...
"Looking at the chart above I have included the Fibonacci - taken from the breakout at long term resistance at 2050. I am not particularly a fan of any dead Italian mathematician, but it does show something important.
The amount of pull back the trend has. Also, it's a line chart, so much easier to read are they not?
As you can see the price has hardly retraced and this is important - for it shows how keen the buyers are, not wanting to wait (FOMO) for more falls before getting in.
Why?
They are AFRAID the price will rally without them so they do not let the price dip much at all. So, I intend to add to my gold stock positions next week, wish me luck!"
So, FOMO did not really kick in for many of the gold stocks last week, lets see if it does this week. The reason I am focusing on the gold price is that when gold rallies, often does the resource sector in general - as seems to be happening now. Also, many gold stocks also mine copper and I would be surprised if you have not heard the constant talk about copper demand.
So much happening at the moment I could write a lot more but soccer duty calls (as I write on a Sat morning),
have a good week and see you back here next week!
PS: The book Zen Trader has been offered a Taiwanese publishing contract to be printed in Traditional Chinese. This means the book will now circulate through all Chinese speaking countries except the mainland (which may still happen as a result of this offer). Of course it's still a huge market without the mainland and I am pleased to announce this is now the 3rd other language (the others being Spanish and German) apart from English that the book is now produced.
Thanks again to all who have purchased the book to make this possible.
Regards
Peter
See charts below with an On Balance Volume indicator and the Money Flow Indicator using a 13 period

I often say trading is about probability not prediction, however I did stick my head on the chopping block last week and say I thought the correction was over - why? There was so much volume coming into the market and perhaps more importantly, the volume was not dropping off with the price, creating a bullish divergence. So we got a rally this week, now what?
If you have ever read the book about Jesse Livermore there is a character in the book called "old Mr. Partridge". He used to hang around the brokers office never seeming to do a lot. When asked by younger traders what he was doing, he would reply "well its a bull market!"
What he was attempting to teach the younger traders was this: in a bull market try not to panic, buy the dips, stick to the trend and your method. Let others lose their heads but you keep your cool.
Easier said than done I know.
It does appear this market will continue up. The ASX is primarily a commodities based index (BHP alone represents around 12% of the top 200) and commodities are on a tear. Speaking of being on a tear, the gold price is on one. Looking at the chart below I have included the Fibonacci - taken from the breakout at long term resistance at 2050. I am not particularly a fan of any dead Italian mathematician, but it does show something important.
The amount of pull back the trend has. Also, it's a line chart, so much easier to read are they not?
As you can see the price has hardly retraced and this is important - for it shows how keen the buyers are, not wanting to wait (FOMO) for more falls before getting in.
Why?
They are AFRAID the price will rally without them so they do not let the price dip much at all. So, I intend to add to my gold stock positions next week, wish me luck!
Until next week,
Peter

See charts below with an On Balance Volume indicator and the Money Flow Indicator using a 13 period

In my opinion the correction is over. When I wrote that statement I thought "hang on Pete, you don't make predictions". However based on the probability of the price action in the chart above, it appears that price has found support at the long term blue dotted line and volumes are clearly breaking up. Price should now follow. Particularly now that the US markets had a strong close to the trading week.
Over the last 2 weeks the signals for the 52 week highs have slowed, that's understandable considering the recent market price action. The alerts for this week and last week are below. I was busy with school holiday commitments the previous week and I plain forgot about the updates!
The graph below shows the performance of the 52 week high system on the ASX 300 for the last 12 months. Before the recent correction it peaked at 25% return but now its around 16%. In the last year its done 56 trades (around one a week) and has a 42% win rate. Those results do not include dividends but also do not take into account brokerage costs - so it would pretty much even out. The biggest winner was AD8 (chart below) and it was only just stopped out last week. The win rate and return percent p.a., can be improved if trading a stock list with strong fundamentals.
For example, the same 52 week high method used on a list of stocks with high ROE and EPS growth has returned 28% (peaked at 37% before the recent pullback) and has a 60% win rate. It also did less trades with 45 compared to 56.
No rocket science, trade trending stocks with good fundamentals and the bull market does the heavy lifting. You just need to get out of the way.


Have a good week, it should be a good one - unless we get another economic curve ball,
All the best
Peter.
See charts below with an On Balance Volume indicator and the Money Flow Indicator using a 13 period

Despite the falls in price, the OBV and MFI are showing support. The price has come back to the longer term support line (blue dotted line). A very interesting development in the US is the sell off on the Nasdaq (driven by AI stocks) yet price support in the Russell 2000.
There are many reasons for the market volatility and uncertainty, I am sure you know them all. The most important things to watch in my opinion is price and volume on the charts. At the moment the chart above still looks quite strong, sure, its had a sell off buts its been on a tear for some time and markets do not go up in a straight line.
The commodities are rallying and Australia is a commodity based economy. Its going to be interesting to see how it responds to the rotation of funds (Tech to other industries) affects the Aussie market and economy.
Have a good week
Peter
PS: I used candles in the chart for a change, I am aware many people use candles now rather than bars, let me know what you think at This email address is being protected from spambots. You need JavaScript enabled to view it.
See charts below with an On Balance Volume indicator and the Money Flow Indicator using a 13 period

The first full 5 day trading week after Easter and volumes understandably increased. This weeks trading produced an "inside bar" which indicates uncertainty. Will the market continue up or fall down? An inside bar suggests that is the question on traders and investors minds.
The OBV continues going up but the MFI is hitting its overhead resistance line, you can see I have drawn that overhead down trend line on the chart. This MFI has been suggesting for a few weeks now that uncertainty prevails, well tell us something we don't know! :)
On Friday in the US the market fell across all indexes, including gold and crypto. Gold appears to have indicated a blow off top and the probability is - it will fall to support. How much that fall is and what support it respects (near or far) will be a big indicator as to the real strength of the gold rally. Below is a chart of the Gold miners ETF in the US (which the Aus market follows closely). You can see the big reversal bar and massive volume indicating a change of mind from traders. If it can hold support around 32.00 that will be a good indicator of strength. The less the fall before going back up, the stronger the market IMO. One to watch with interest but not prediction.

Anyway, that's it for this week. 52 week high alerts are below
Have a great week
Peter
See charts below with an On Balance Volume indicator and the Money Flow Indicator using a 13 period

A down bar, but one bar does not make a trend. The rally in commodities, particularly gold continued. Bear in mind it was another 4 day trading week being post the Easter break. Not much to say except let's see what next week and a full 5 days trading can show. This week was one of uncertainty and positioning as money continues to rotate around the sectors looking for the best opportunities (which appears to be commodities).
In the US on Friday, the markets recovered a little of their losses from earlier in the week. The markets are still trending strongly and it wouldn't surprise me to see more upside from here, even though the markets look over bought. One would expect fireworks in some of the junior gold and resource stocks next week as they play catch up to a rampaging gold and copper price. The gold price also looks over bought, but if FOMO kicks in - and I have a feeling it may - then it's probably the sector to look at for continuation set ups. Be careful though as many gold stocks have already rallied 30% or so and when they reverse they do so very quickly. Control risk and perhaps set wider stops, as gold stocks swing around more than others. You need to preserve capital and sanity.
ps: its probably worthwhile reading last weeks comments regarding the resources rally
Until next week
Peter
MARKET COMMENTS: As of the close on Friday 28/3/24: (Easter Thursday 28th was the last trading day of the week)See charts below with an On Balance Volume indicator and the Money Flow Indicator using a 13 period

Inflection point that I discussed for the last 2 weeks was clearly resolved this week. The price of the index went up. There was low volume, no doubt some of the reason was the 4 day trading week, and people shooting through early from work on Thursday for the holiday break. However it could also be a lack of conviction? A concern the market is overbought?
The true and steady (although at times lagging) OBV is clearly up, however the more dynamic (yet not always accurate) MFI is still pointing down and showing a negative divergence compared to the price. Is that a worry? It's too early to tell, also as I mention often, this index at times is not a true reflection of whats happening amongst sectors within the market. Money appears to be rotating back into resources, you can see that with the rally in the big mining stocks like BHP, RIO, FMG etc. Some sectors such as I.T. , Health and Consumer Discretionary are either taking a break or slowing as money rotates back into Materials, Resources, Utilities, Oil, Copper and Gold. Since the Covid rally stalled in late 2022 Consumer staples has performed poorly as people return to "normal" and risk on takes over risk off.
So it's a very interesting time, if the markets globally are overbought and there are concerns about growth - then why the rotation into stocks that supply the basics of growth? One of the biggest bull markets we had on the ASX was when miners rallied hard between 2003 and 2008 (before the famous GFC crash) . See chart below of the benchmark miner - BHP

After rallying from $10 in 2003 to $25 and then falling to $20 in 2007, many thought it was all over for the big Australian, but then it rallied to nearly $40 before the GFC. Many believe we are in the final stage of a bull market - Stage 3. The final and most aggressive move up. So over the final stage can BHP almost double again from around 40 to 80? Also what will that do to the small and mid cap miners? If you were trading around the early 2000's you will remember the explosive returns that some of those stocks achieved.
As mentioned last week keep an eye on the Russell 2000 in the US, also the GDX - the gold miners index, if these continue to rally and FOMO kicks in we could be having a repeat (to some degree) of 2003 to 2006, or more likely 2006 to 2008. A two year rally will take us to 2026, the year that many believe will be the end of the long term 18 year cycle that started in 2008. See link below for more info about that.
https://propertysharemarketeconomics.com/18-point-6-property-share-market-economics/
Food for thought (and research)
Happy Easter
Until next week
Peter
See charts below with an On Balance Volume indicator and the Money Flow Indicator using a 13 period

This recent weeks price action on the XAO (All Ords) resulted in what is called an "Inside Bar" - when the current bar or candlestick is neither higher or lower than the bar before. You can google if you like but it means indecision or consolidation in the minds of market participants. Makes sense when you think that traders and investors are not sure if to push the market higher or lower, a bit like a Mexican standoff where no one is prepared to shoot first!
Last week I said.... "Inflection point! I have been saying for a few weeks now (reread previous comments) the MFI 13 period was not behaving in a bullish manner, it was pointing down whilst price and OBV were pointing up"
That situation remains, this week the price did bounce up from the longer term dotted blue support line. I am still bullish on this chart, the All Ords is still producing regular 52 week closing highs ( see below) and it appears to be a broad based rally with many stocks performing well, not just the big gorillas that often dominate the Aussie market index ( big banks, big resources, big health etc).
Another bullish sign coming from the US, is the support for the Russell 2000. A concern from some, has been the fact that the bull market is driven by the gorillas in the US too - being a handful of stocks in the Nasdaq. Very interesting is the look of this chart below when comparing to the XAO. The price and OBV are clearly trending up but the MFI shows some uncertainty for the time being. In my opinion the chart below could be the most important one of all. If this index - representing a much broader reflection of the US economy (which affects the world) continues to strengthen, this bodes well for the All Ords here in Australia.

Until next week
Peter
See charts below with an On Balance Volume indicator and the Money Flow Indicator using a 13 period

Inflection point! I have been saying for a few weeks now (reread previous comments) the MFI 13 period was not behaving in a bullish manner, it was pointing down whilst price and OBV were pointing up. Now we have the small correction many were talking about. The price has pulled back to the support of the the previous highs - going back nearly 3 years. There was a huge red volume bar last week, but for every seller is a buyer and some will see this as a buy opportunity, betting that this is a small pullback in a larger move up.
A bullish fact is the OBV sitting on its trend line. As often mentioned here the OBV is a slower indicator, but often more reliable than its faster moving cousin the MFI. I dont predict but I do attempt to gauge the probability of the next move. Price is on long term support and the OBV is on short term support. The MFI has not taken out its previous low. This bodes well for a pause in the price falling more, while the market waits for more news and data. A big one being interest rates and the other the fortunes of China. The Shanghai index has bounced up around 15% in the last 5 weeks. It is still in a solid down trend but early signs of recovery are evident. One would think this will imbue the western markets with more confidence. An interesting space to watch IMO.
Until next week,
Peter
52 week closing highs as of the Fridays close 15/3/2024
Below are the alerts from a scan of the ASX 300 and the 300 to 500
300: COE RDX RED VCX
300-500: EML LGI MAH NXL
Please note: in the eBook I wrote in 2016 (available for purchase on this website on the link below) I have made some changes to the system. If you have bought the eBook I am happy to email you a PDF explaining the changes I made, which from testing and trading does improve the system.
Here is the link to the eBook Mindful Trading using Winning Probability written in 2016 -
and the internationally published The Zen Trader (2022) - now in three languages.
IMPORTANT POINTS TO CONSIDER
A new 52 week high for this system is classified when the stock price is at its highest close (or equal to the highest close) counting back 52 weeks.
If a stock continues to make new highs, for example in the 53rd and 54th week, they are now regarded as ROLLING highs, not NEW 52 week highs.To clarify again, the buy signal for THIS system discussed is a NEW 52nd week or 1 year closing high, not a rolling high as is often given elsewhere.
The signals provided are WITHOUT A BULL FILTER.
The exit used FOR THIS METHOD is the 5/12 EMA crossover. Therefore, some stocks will be re signalling a new high buy signal if they have been recently exited by using the 5/12 exit within the last 12 months. This is important and you need to understand this.
Of course the 5 EMA needs to be above the 12 EMA to make the 52 week high valid, (otherwise we would be selling straight away) nearly always this is the case, but rarely if a stock spikes it is not.
So to repeat, the rules are: USING WEEKLY PARAMETERS!
Entry:
Share price to make a 52 closing (or equal to) week high (when selecting a buy, favour the cheapest stock)
The 5 ema to be above the 12ema
Exit:
if the 5 ema crosses below the 12 ema
The above system contains no position sizing, bull or bear filters or fundamental stock selection, these are discussed and taught to private clients or at my courses.
See charts below with an On Balance Volume indicator and the Money Flow Indicator using a 13 period

Price and OBV look good, the only concern is that bearish divergence on the 13 period MFI. As I said last week strong bull markets are a mixture of extreme optimism, FOMO and fear. Pullbacks can be sharp but they are often quick, then the market takes off again. Everyone (well not all but many) are trying to pick the top. That's bloody impossible.
The best thing is to manage risk by either taking some profit off the table but leaving a bit on to run. You can tighten stops too, if you are really getting nervous. The best thing of course (here we go again Pete you think) is to have a system and stick to it.
Until next week, I hope you enjoyed the news letter about divergences, here it is
https://www.easysharetradingsystems.com.au/products-and-services/archive
Peter
See charts below with an On Balance Volume indicator and the Money Flow Indicator using a 13 period

Because the US market is flying so is ours. One of the challenges we have of analysing the chart above is that at times it may not be the best indicator of how the Aus market is really performing. The Index above is dominated by a few sectors, mainly resources and banking so if those two sector rise so does this index. For example, the last 9 weeks BHP (and many other resource stocks) have been in a short term down trend. That price action in one of the biggest sectors - affects the look of the Index above.
If you consider that over the last few weeks (probably months) the Mindful system has been giving many buy signals across other sectors apart from the two big ones mentioned above. This indicates a broad based rally not being shown in the XAO Index.
Last week I mentioned I could see a rotation perhaps occurring. Last night in the US and UK there was a big rally in commodity stocks. Gold, Uranium, Lithium, Oil, Copper and others - all rose, one of the few laggards was Iron ore. One would "expect" a rally in those stocks on Monday, bearing in mind we should not expect anything, as anything can happen in the market. Your focus needs to be on probability and risk control not expectations and predictions.
So, the chart above. Well I often say price is the ultimate indicator - and in this case its leading the volumes. I suspect the indicators on the chart above will look a lot stronger after Mondays close.
Alerts below - lots of em.
Cheers
Peter
See charts below with an On Balance Volume indicator and the Money Flow Indicator using a 13 period

I have been mentioning the volume indicators for a few weeks now - they still look indecisive. Traders and investors are still deciding what to do, buy, sell or hold. There could be a rotation on in my opinion, as money looks for the best place to be. There is weakness in the Materials and Energy sectors which are some of the biggest sectors, its dragging down the XAO. Even Health had a fall this week but that was probably largely impacted by PME. But there is huge strength in other sectors like Tech, Discretionary, Industrials and Finance. This "rotational" strength is reflected in the number of 52 week closing highs this week.
PME: well I mentioned it last week and it bounced well rising over 12% this week. In my opinion it shows the value of learning to read oversold bullish divergences like PME was showing last week. I think I should write a paper on it for those interested - let me know if that's a good idea by writing to me here....
This email address is being protected from spambots. You need JavaScript enabled to view it.
Apologies: to those who logged in last week to Go Markets seminar to hear me present. A combination of technical and family occurrences made it impossible for me to attend. Mike Smith from Go Markets has kindly organised a special "catch up" conference this coming Wednesday night at 8pm. Below is the seminar link for Wednesday night
https://register.gotowebinar.com/register/8843010719428854103
Until next week, 52 week closing high alerts below - lots of them.
Peter
See charts below with an On Balance Volume indicator and the Money Flow Indicator using a 13 period
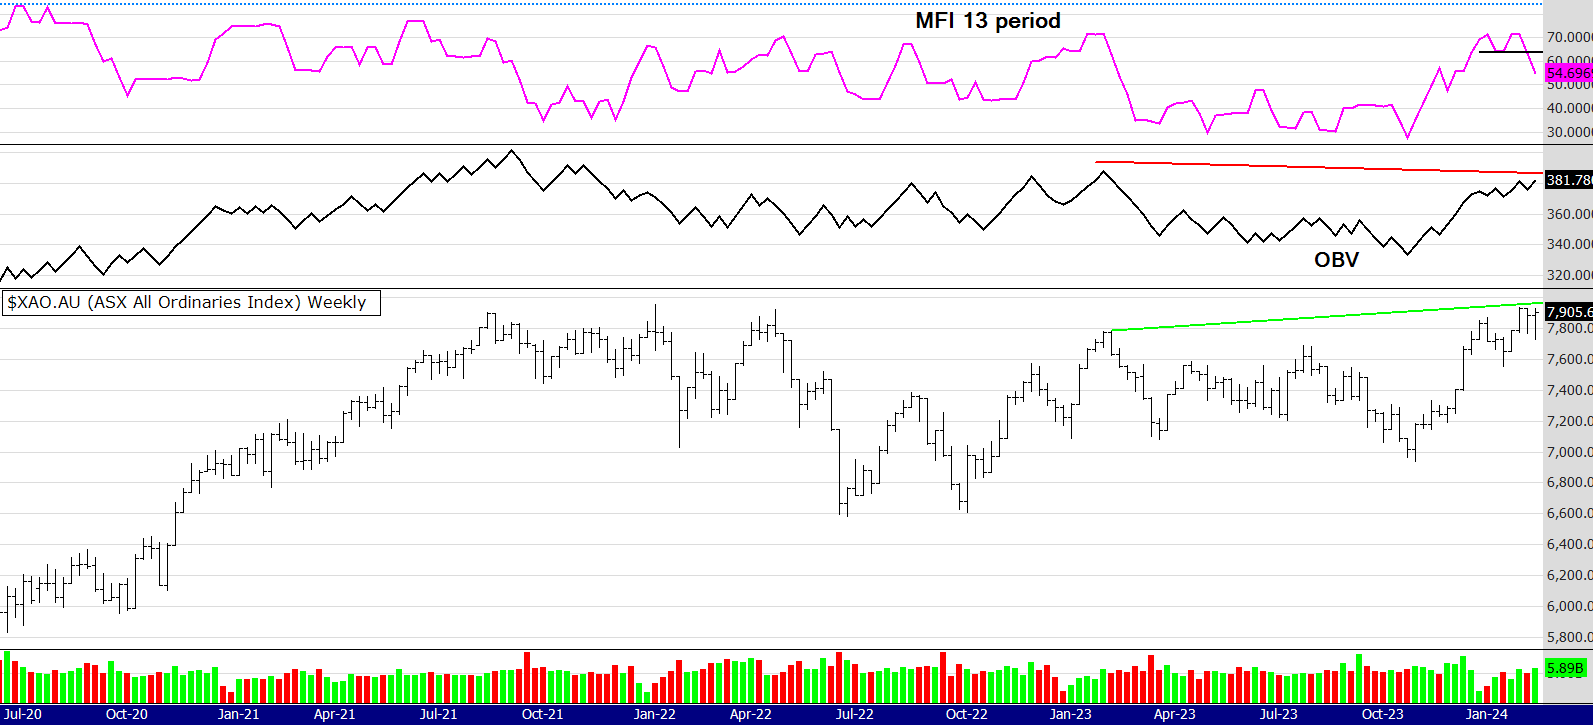
This week we have a conflicting signal on the volume indicators. You can see the MFI is coming down, but the OBV still looks strong. Also the ultimate indicator, which is the price, has finished the week strongly. So "two out of three ain't bad".
This week the Russell 2000 in the US was strong, although it looks a little overbought the rally is one to notice. Last night the US indexes slowed a little but commodities had a strong night, even lithium and gold rallied a bit, giving some hope to the suffering traders holding some of those stocks.
It's been another strong week for 52 week closing highs, they are listed below.
The chart below is PME, it's one of the feature charts in my presentation tomorrow. It took quite a hit, breaking decisively through the first line of support being the horizontal green line. It's very difficult emotionally when this happens, particularly if you have been disciplined and riding the trend since the entry. As you can see the moving average exit from the Mindful Trading book has not signaled a sell. You can see an older trade where it did around May 2023. Technically the MFI looks bearish but the more robust OBV looks ok, in fact it is showing a bullish divergence. The black EMA on the chart is the 24 (or 120 daily), price can often bounce off this level so for shorter term traders this is a stock to watch, in my opinion. This is not financial advice.

A reminder about my presentation, here is the link - I am on at 1pm
https://www.gomarkets.com/au/trading-mastery-2024/
Until next week!
Peter.
See charts below with an On Balance Volume indicator and the Money Flow Indicator using a 13 period

Not a lot of change from last week. The rally has slowed a bit while the market (traders and investors) take a breath. Money flow and OBV has pulled back as stops are tightened and some selling has happened, traders becoming more cautious. The indicators last week did suggest there could be a reversal or either some consolidation. It can be a tough time when markets are strong but fear kicks in, many sell too early to lock in profits, to then see the market rally again. That experience then results in frustration and FOMO, traders jump back in and then get caught with buying the top.
The answer? Have a method and stick to it, know your exit and your risk (trade sizing) should have been pre-planned BEFORE you bought. It will be interesting to see what happens this week, if the market kicks up again, consolidates (like this week) or falls. Speaking of dealing with emotion etc, please read the note below and check out the link.
Until next week!
Peter
PLEASE NOTE: I have been invited to be a presenter, with four other traders for a free webinar on the 17th Feb. The conference is sponsored by Go Markets and runs between 11am to 4pm and I will be speaking at 1pm. Registrations can be made on the link below and my talk is "Trading with a Zen Mind" a talk I gave at the ATAA National Conference last year and also in Shanghai (online) last weekend.
See charts below with an On Balance Volume indicator and the Money Flow Indicator using a 13 period

Hi all, I am back. Well what a month its been. The talk was bullish, then bearish, now uncertain. Crikey! If ever there was a good example to ignore the news and follow your process its been the last month!
I said in my comments a month ago that the MFI could rally all the way up to the 80 reading, it still looks strong at the moment. However the OBV is showing a bearish divergence and price is hovering around old resistance, so it's a probability that there will be a pullback or some consolidation soon. Despite those things, the market is certainly still bullish and it is good to see the markets going up. There are 15 buy alerts this week for the eBook system Mindful Trading using Winning Probability. Wow, that is a lot, so the market certainly is raging.
PLEASE NOTE: I have been invited to be a presenter, with four other traders for a free webinar on the 17th Feb. The conference is sponsored by Go Markets and runs between 11am to 4pm and I will be speaking at 1pm. Registrations are not yet open but when they do I will post the link here. I will also send an email soon with more details. Hope to see you online.
Until next week, all the best
Peter
See charts below with an On Balance Volume indicator and the Money Flow Indicator using a 13 period

When we look at longer term charts (which very few people do) and take a moment to reflect, one could be entitled to ask the question "what was all the fuss about?
During Covid the OBV remained in an uptrend, it did so again 2 months ago when the market hovered around 7,000. At that time the MFI was deeply oversold and now it is approaching an over bought level. However, it could easily stretch up to the 80 level. Then the price could continue more and the MFI might then show a negative divergence as it has in the past (April 2019 and July 2020) . Of course that is all conjecture, although its worth remembering that nothing goes up in a straight line and at some point buyers will take a breather as they start to believe the market is too extended in the short term.
Only 2 months ago the talk was doom and gloom and recession - now its bull market into 2024 and beyond! I agree at the moment the chart looks strong, price and volumes are up and there appears to be no weakness. Volume last week was low as it was only a 3 day trading week and the same will happen for this coming 1st week in January. The low volume hasn't stopped a strong performance from the 52 week high system, registering another twelve this week. They are listed below.
Only one chart this week, hey its holiday time! Speaking of holidays I am overseas for most of January and Cynthia has told me I am not allowed to trade or be on the computer :)
I will do my best to post the weekly charts but if I don't, you know why!
Happy New Year
Peter
52 week closing highs as of the Fridays close 29/12/2023
Below are the alerts from a scan of the ASX 300 and the 300 to 500
300: ADT BHP BKW CBA CIA NXT PMV QUB SFR
300-500: BLY GQG QOR
Please note: in the eBook I wrote in 2016 (available for purchase on this website on the link below) I have made some changes to the system. If you have bought the eBook I am happy to email you a PDF explaining the changes I made, which from testing and trading does improve the system.
Here is the link to the eBook Mindful Trading using Winning Probability written in 2016 -
and the internationally published The Zen Trader (2022) - now in three languages.
IMPORTANT POINTS TO CONSIDER
A new 52 week high for this system is classified when the stock price is at its highest close (or equal to the highest close) counting back 52 weeks.
If a stock continues to make new highs, for example in the 53rd and 54th week, they are now regarded as ROLLING highs, not NEW 52 week highs.To clarify again, the buy signal for THIS system discussed is a NEW 52nd week or 1 year closing high, not a rolling high as is often given elsewhere.
The signals provided are WITHOUT A BULL FILTER.
The exit used FOR THIS METHOD is the 5/12 EMA crossover. Therefore, some stocks will be re signalling a new high buy signal if they have been recently exited by using the 5/12 exit within the last 12 months. This is important and you need to understand this.
Of course the 5 EMA needs to be above the 12 EMA to make the 52 week high valid, (otherwise we would be selling straight away) nearly always this is the case, but rarely if a stock spikes it is not.
So to repeat, the rules are: USING WEEKLY PARAMETERS!
Entry:
Share price to make a 52 closing (or equal to) week high (when selecting a buy, favour the cheapest stock)
The 5 ema to be above the 12ema
Exit:
if the 5 ema crosses below the 12 ema
The above system contains no position sizing, bull or bear filters or fundamental stock selection, these are discussed and taught to private clients or at my courses.
MARKET COMMENTS: As of the close on the 22/12/23: See charts below with an On Balance Volume indicator and the Money Flow Indicator using a 13 period

Well the rally continues! A pause was not what we got but a continuation. Another example of how difficult it can be to pick tops or bottoms and "going with the flow" is the most profitable but also the most difficult psychologically.
The price price blew through that overhead dotted trend line (producing twelve new 52 week closing highs) and dragged the volume indicators along for the ride. With no divergences to speak of the next resistance seems higher up the chart, perhaps around 6900. Next, let's look at the Small Ords index.
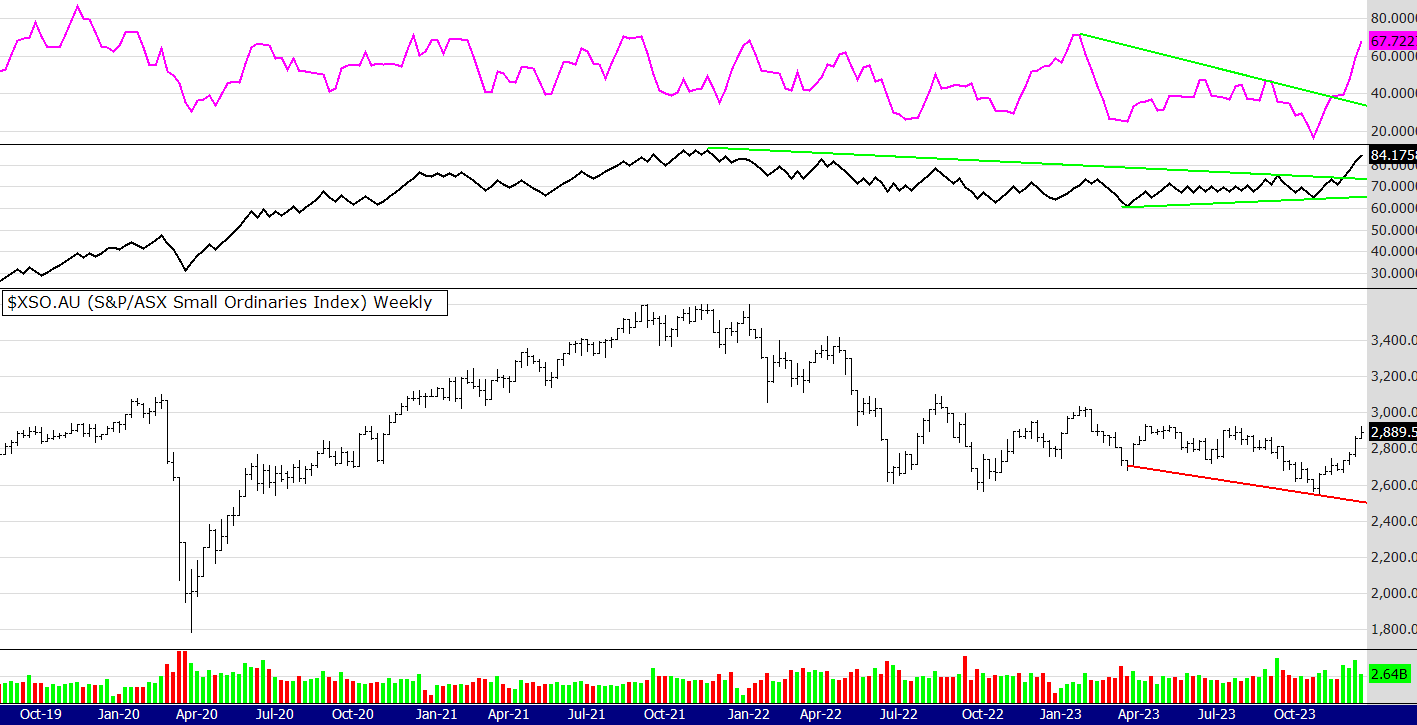
My trading friends will know I watch this index closely. That is because I tend to trade this sector more than the large caps as I think that is where more opportunities are - but I have been wrong so don't take my word for it! This sector was showing a strong bullish divergence around 9 weeks ago and its been straight up since then. It is a good sign to see this sector rally as it indicates a broad based rally in the market, something that has taken a while to happen. Next, the Russell 2000 in the US.

The Russell has finally broken above the 18 month resistance indicated by that dotted trend line, however it does appear over stretched to me with some negative divergence showing on the volume indicators - but I said that last week and the price just blew up past the neg divergence. However the SP500 (chart not shown) in the US looks like it could be double topping so we still need to be mindful that this rally has been strong and nothing is permanent. One more chart!
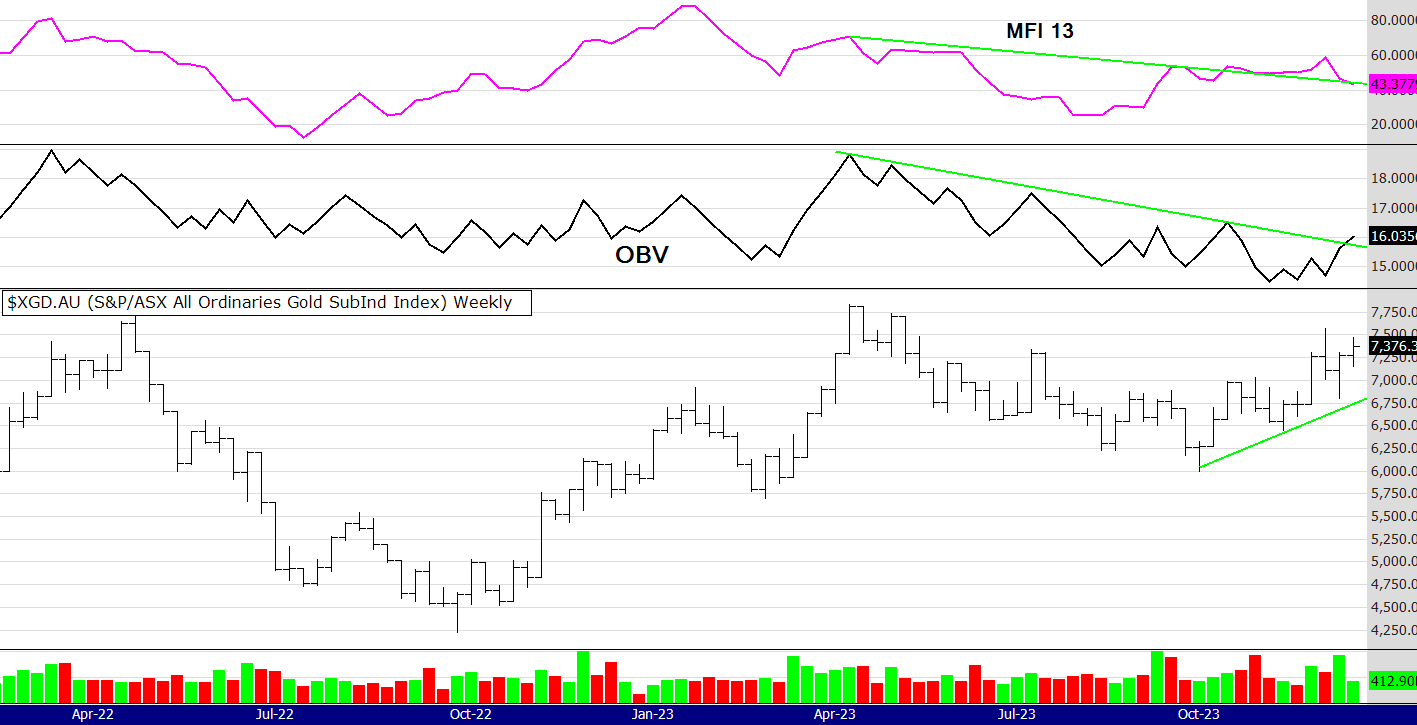
I did say last week I wanted to see more volume in this index of the gold stocks in Australia. The OBV has obliged and broken its down trend line but it's not the most convincing price and volume action. However during the Xmas trading season volumes in the spot gold market are thin because many traders are on holidays. This can result in some big moves in the gold price and also this sector, so I will be watching closely.
Merry Christmas,
Until next week
Peter
See charts below with an On Balance Volume indicator and the Money Flow indicator

Last week was quite a rally. I wont go into details as to why as I am sure many of you have read or heard the reasons. Focusing on the now it appears the index is approaching some resistance. The OBV is trending up well but it has not reached the high it made it January. Last week I mentioned a slight divergence between the price and the MFI. That divergence still exists and considering the rally the question needs to be asked "will we get a pause?" If market prediction is about probability I would think the answer is yes. Gold stocks.........

I often get questions about the gold stocks and I too find this an interesting sector. The price recovered strongly this week from an earlier pull back. The MFI is back testing the trend line, but - I would really like to see that OBV get stronger. Until that gets a clear break to the upside I think gold stocks will remain in a sideways pattern. Gold stocks do not always respond to a rising gold price, it depends on other factors such as general market strength, interest rates, the US dollar, inflation and others. It remains to be seen if the stars align for a Xmas gold stock rally.
Until next week
Peter
See charts below with an On Balance Volume indicator and the Money Flow indicator
I often say trading is not about being right, but sizing risk, exits and sticking to a method. However it is nice to get a call correct now and again. Last week I said...
"With the recent rally in the Russell the XSO is playing follow its leader. I suggest you keep a close eye on the Russell for it may well tell us if the spec end of the Aus market will finally rally. Or has it started with the 14 buy signals?"
This week I have posted 2 charts, the XAO and the XSO. I will start with the XAO - you can clearly the volume coming into the index which is a bullish sign, stocks can't go up without buyers. There is a slight bearish divergence between the MFI and the price, however it is slight and to be expected after a big rally.
Moving on to the spec end of the market and the XSO, well it did follow the Russell up but the price is still in a technical down trend, however the volumes look very bullish particularly the OBV which has been trending up for a while and has now broken the down trend line I have drawn. Volumes in this index look even stonger than the XAO.
This week was another strong performance in the 52 week closing high system with 11 alerts.
Have a great week
Peter
See charts below with an On Balance Volume indicator and the Money Flow indicator

Well, I like to say "keep a mind of interest" not judgement. It certainly was an interesting week. The XAO above looks strong and it appears that the bull market is becoming more broad based. I say that because below you can see fourteen, yes 14, new 52 week closing highs. Last week I mentioned gold and so let's look at the Aussie gold index the XGD.

The reason I use the money flow index is that it is a more dynamic (faster) indicator than the slow old OBV. You could see a break up about 6 weeks ago signalling perhaps (no indicator is completely right or wrong) something was afoot. What I see now is a lack of follow through comparing the MFI to the price. Also a bearish divergence on the OBV when comparing that indicator with the price. You can see I have drawn those lines on the chart. Therefore some consolidation or even a pullback in the XGD would not surprise me.
One more opinion this week and its about the Russel 2000 in the US compared to the Aus Small Ords (XSO).
There has been much gnashing of teeth as to why the mid caps and small end of the Aussie market have not responded to the recent rally, so here is my reasoning. The Russell in the US has not joined in the rally and its been lagging the SPX, Nasdaq and the DOW. But! the correlation between the Russell and the XSO is obvious. Below is the chart of the Russell and the XSO
With the recent rally in the Russell the XSO is playing follow its leader. I suggest you keep a close eye on the Russell for it may well tell us if the spec end of the Aus market will finally rally. Or has it started with the 14 buy signals?
Until next week, Peter
PS: the Russel versus the XSO chart

See charts below with an On Balance Volume indicator and the Money Flow indicator

What stood out to me about this chart was the OBV. After breaking up over its down trend line it has now retraced back to it. The Money Flow Index indicator looks very similar to last week. There were six 52 week closing highs this week in the ASX 500 - see below. Considering the index had a flat week, six alerts is promising showing there are stocks moving up even though the broad based index may not be reflecting that. Bear in mind, and I repeat, the index is driven by resource stocks and banks, if they have a flat week then so does the index. I does not mean to say there are not opportunities in other areas.
As I said in my video (link below if you have not seen it) the broad based rally appears elusive. I checked the Small Ords chart this morning (not shown here) and it is still struggling to show any conviction. However there has been some good price action in some small resource stocks, perhaps because the XMJ is showing strength. I also mentioned in the video that the XMJ was looking very interesting and could help support and even rally the All Ords. Looking at the chart below you can see that is the case.
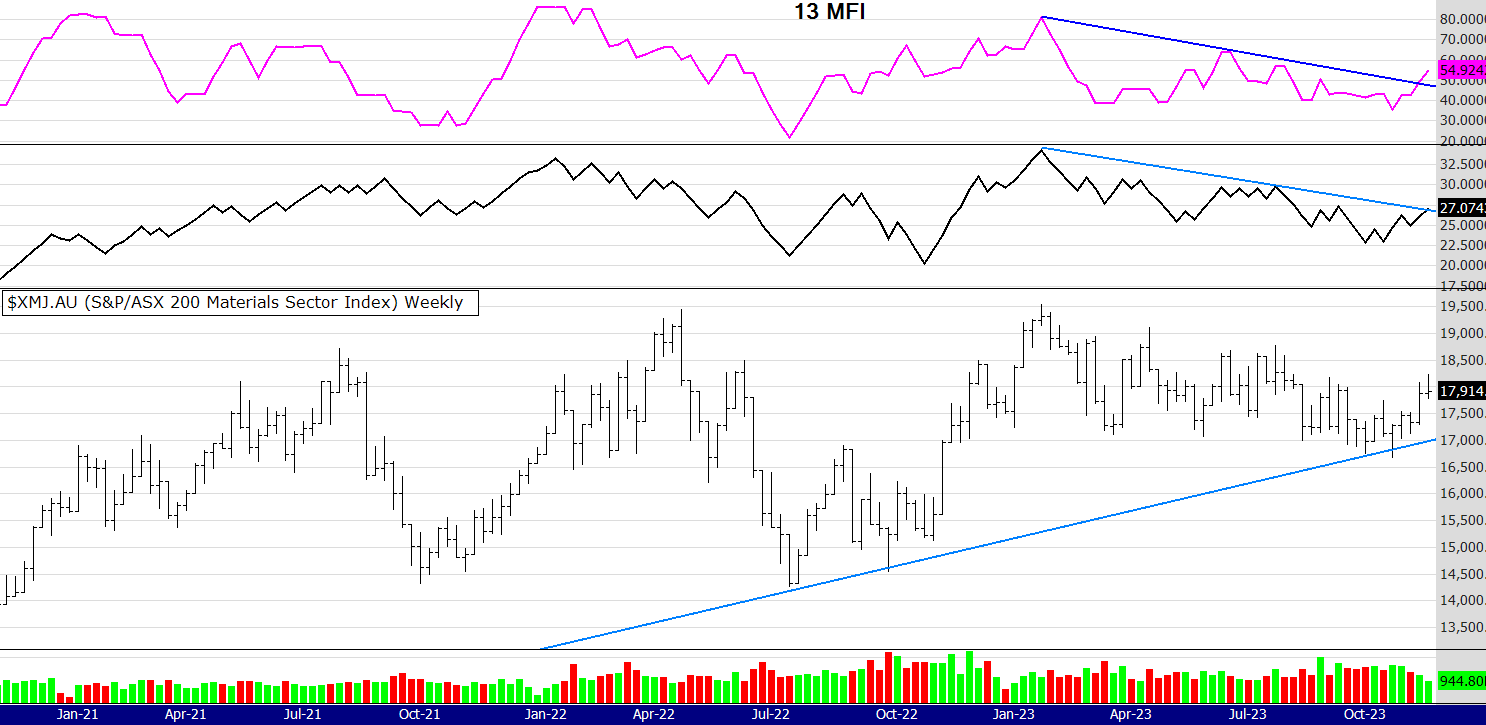
What will it take for gold shares to rally? Some had a strong week but others not. Last night in the US gold rose above 2000 yet the gold share indexes went "ho hum". Look at the chart below. It shows the correlation in price between the gold price and the XGD, which is the gold share index in Australia. As you can see it normally correlates closely but recently it has not. now, whats happening? Well either the gold price is overbought or Aussie gold shares are oversold. If the sector decides to play catch up I think there is a quick 10% profit opportunity in the majors and perhaps a lot more in the juniors - so I am watching this space closely.
The other sector also dragging the chain versus its commodity price is uranium. Some of the Aussie uranium miners are not following the commodity price and it is possible that they also play the catch up game.

So that's all a bit to digest and if you find it overwhelming remember the Zen advice of observing and looking with a mind of interest, rather than trying to work it all out. By having a "mind of interest" and not trying to get it all right all the time takes the pressure off. This is a game of probability not right or wrong and your trading plan needs to reflect that philosophy.
I mentioned the video discussing the markets in more detail, its about 2 weeks old now but they are long term charts discussed and still relevant.
Have a great week
Peter
See charts below with an On Balance Volume indicator and the Money Flow indicator

Well it was an interesting week for sure! Price continues to rise and the volumes look strong, in fact both the volume indicators are leading price - as you can see from the fact they are both breaking their down trend lines to the upside. Also there are 5 new 52 week closing highs this week, see below.
I notice some strength too in the lower end of the market, namely the Small Ords. Mind you it is still in a downtrend but volumes are increasing and it looks promising. Will we finally get a broad based rally? Too early to say but the bears have certainly been pushed back into their caves for the time being.
I have recorded a video discussing the markets in more detail, if you want a look click here.
Have a great week
Peter
See charts below with an On Balance Volume indicator and the Money Flow indicator
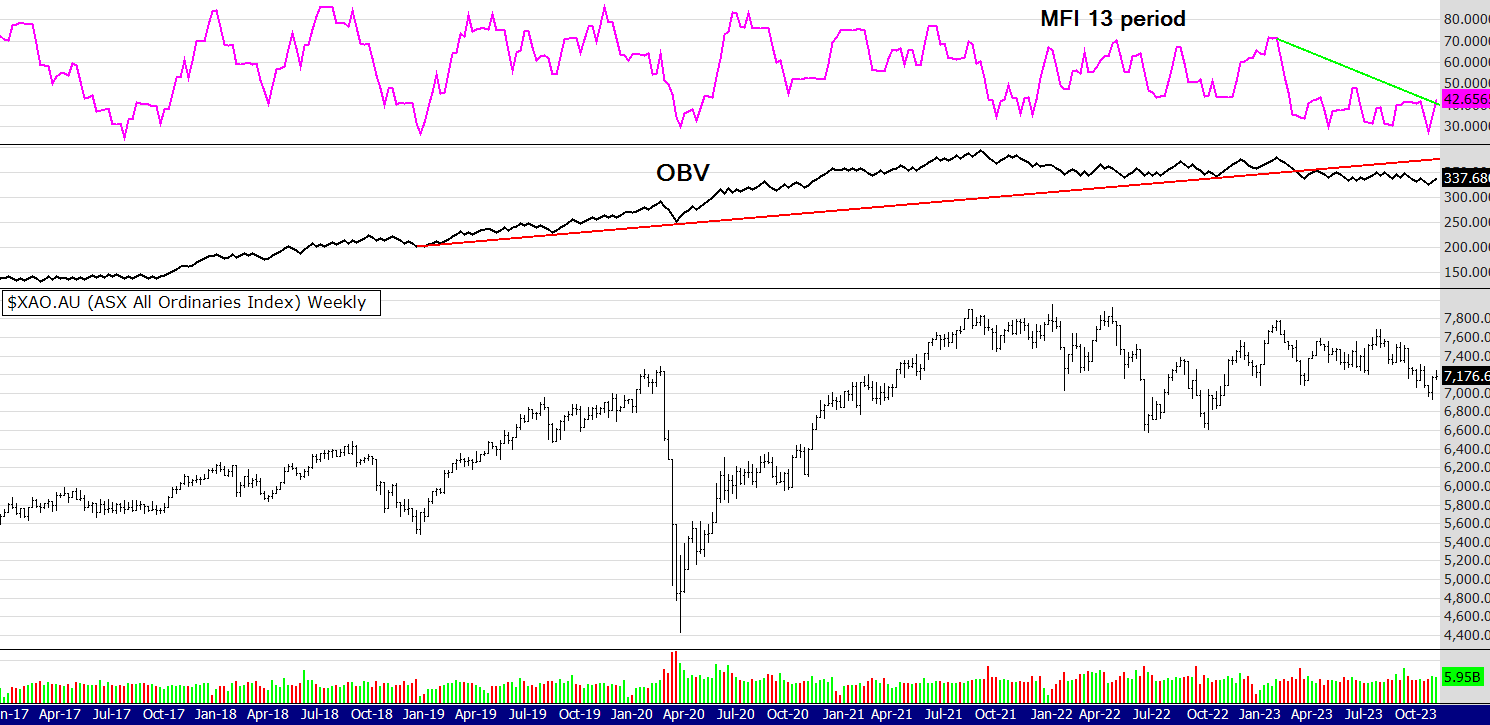
Its been an interesting two weeks on the XAO. First of all we had the "perfect storm" of the US Fed not raising rates and higher commodity prices - the Aus market loved that combination. Then we had the RBA raise rates and commodity prices fell - the Aus market hated that combination and stock prices fell.
Last night in the US the Nasdaq again rose and dragged up the other indexes. The rally in the US is not yet broad based, for example the Nasdaq rose over 2% yet the Russell 2000 could only manage a little over 1%.
Here in Aus the trend is sideways to down - yet the MFI is showing some promise. I think we need a rally in commodity prices and other sectors to to push this index up. Gold and gold shares remain uncertain, as does copper and oil. Its going to be an interesting week.
Until next week stay well.
Peter
See charts below with an On Balance Volume indicator and the Money Flow indicator
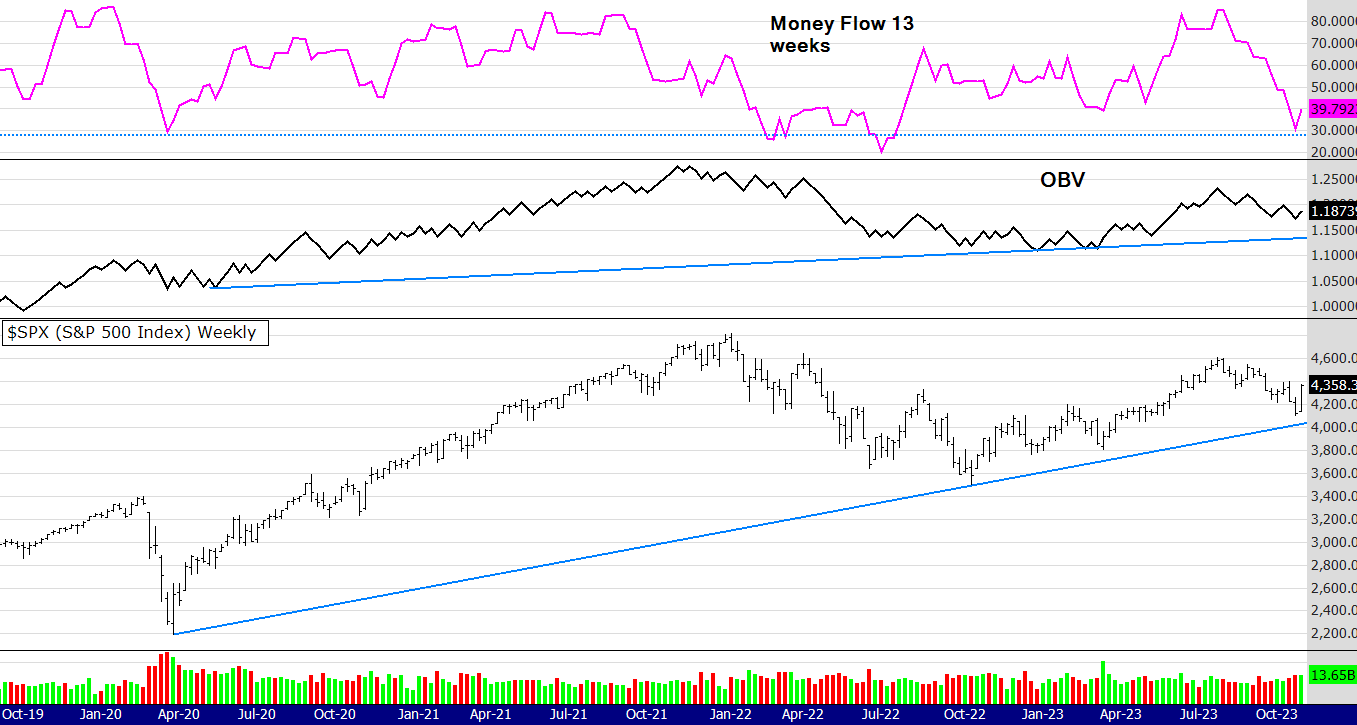
This week I have again decided to focus on the SP500 in the U.S.
I also think its worth repeating last weeks comments.
"You may get bored of me repeating the same thing - we live, trade and invest in the present, not the Armageddon of the future that many believe is inevitable. Keeping that philosophy in mind you can see that there is a strong trend line supporting the price. The OBV also has a trend line and if you look closely you can see a slight (but small) bullish divergence between price and OBV volume at the right edge of the chart.The more dynamic money flow is still trending down but is in over sold territory - the same it was during the Covid crash. It remains to be seen what happens to the above index, 4,000 points seems like a magnet and its not far away. In my opinion if it reaches that level the probability would be for a bounce, I notice some fundamental analysts are starting to call sectors of the market good value.These market corrections can be very difficult psychologically, something I wrote extensively about in my book The Zen Trader (link below). Have a good week and try and keep a mind of interest and observation, not one of panic and despair"
Well what a difference a week can make. After the Fed meeting in the US many now think interest rate rises have peaked there, also they have a strong labour market and inflation is falling. Sounds like Goldilocks economy stuff and the market responded accordingly.
Here in the land of OZ it got pretty good too. Of course we correlate with the US index but with commodity prices rising, banks following the US lead and the $A rising the XAO rallied hard. One could ask, what was all the worry about?
Of course there are still concerns Michelle Bullock and Australian Reserve Bank board will raise interest rates on Tuesday - however it's impossible to predict (as was proven last week) so let's carry on and do our best. Doing our best is having some methodology and doing the best we can at sticking to it.
In saying that there are five 52 week closing highs in the All Ords this week and they are listed below.
All the best,
Peter
See charts below with an On Balance Volume indicator and the Money Flow indicator

This week I decided to focus on the SP500 in the U.S.
You may get bored of me repeating the same thing - we live, trade and invest in the present, not the Armageddon of the future that many believe is inevitable. Keeping that philosophy in mind you can see that there is a strong trend line supporting the price. The OBV also has a trend line and if you look closely you can see a slight (but small) bullish divergence between price and OBV volume at the right edge of the chart.
The more dynamic money flow is still trending down but is in over sold territory - the same it was during the Covid crash. It remains to be seen what happens to the above index, 4,000 points seems like a magnet and its not far away. In my opinion if it reaches that level the probability would be for a bounce, I notice some fundamental analysts are starting to call sectors of the market good value.
These market corrections can be very difficult psychologically, something I wrote extensively about in my book The Zen Trader (link below). Have a good week and try and keep a mind of interest and observation, not one of panic and despair.
All the best, Peter.
https://www.easysharetradingsystems.com.au/products-and-services/e-books
See charts below with an On Balance Volume indicator and the Money Flow indicator
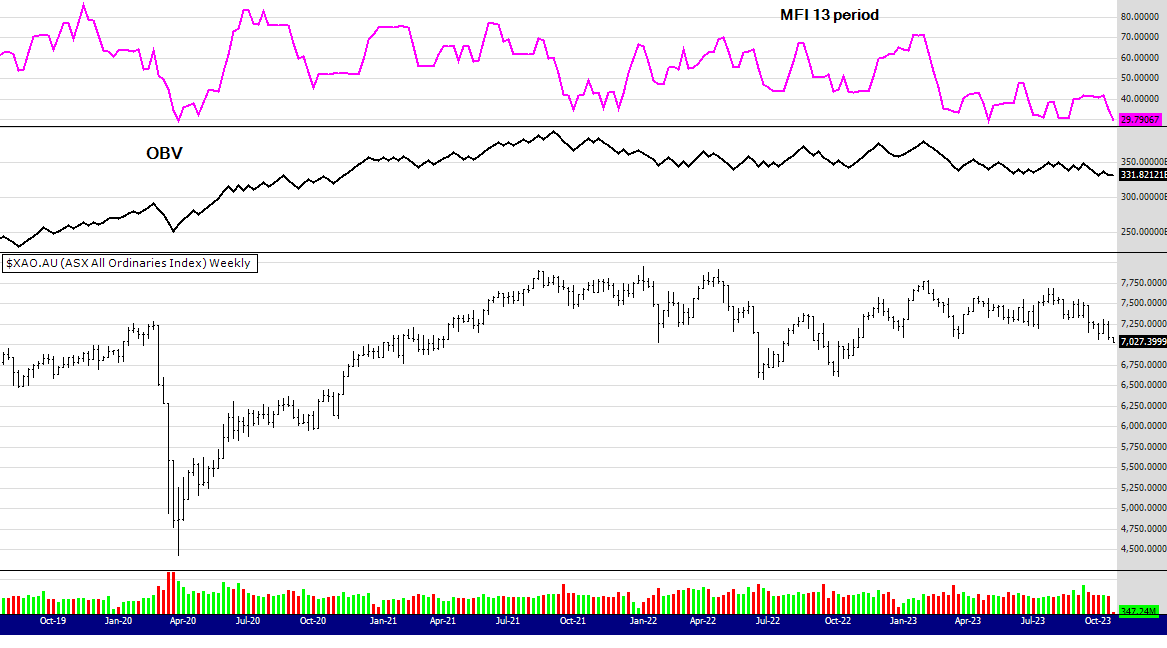
I dont use many indicators on my chart except price and volume. As you can see price and volume are trending down so it looks quite bearish. The SP500 in the US does appear to have some short term support so it may help this index get a bounce. Despite the bearish mood here, there were two 52 week closing highs in the XAO and I have listed them below.
I need to mention too this chart was posted midday Monday 23rd, so the last bar on the chart shows Monday mornings price action - as I have live data.
Please note the dates on the following comments, there is a big gap in the timeline as I took a break to complete and promote my book The Zen Trader.
MARKET COMMENTS: As of the close 20/1/23: See charts below with an On Balance Volume indicator, a bar chart and a 12 EMA.
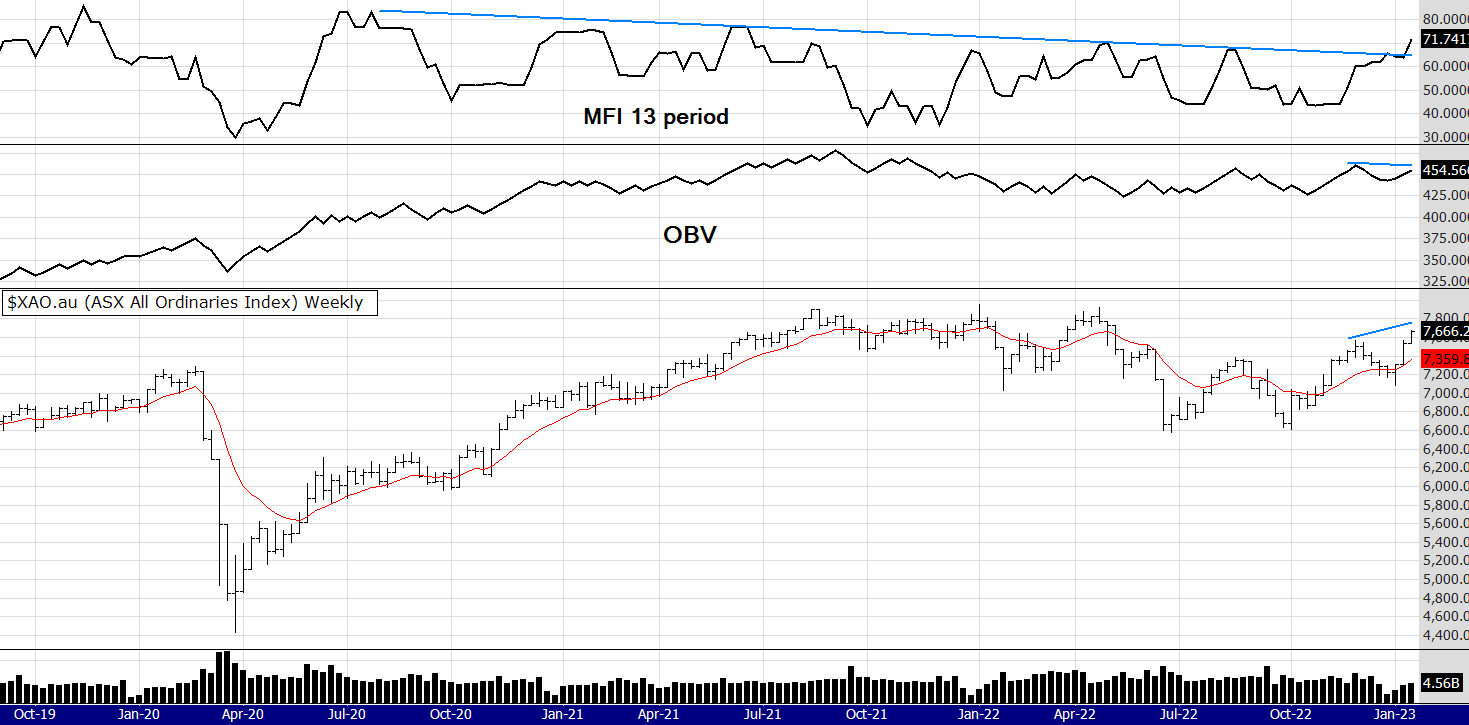
This is a very interesting chart. You can see I have included two volume indicators. The more dynamic Money Flow breaking a 2.5 year down trend line yet the more conservative OBV lagging a little (I think due to low holiday volumes).
Overall I think this is as positive as it gets, although some doubt remains about the global picture this chart is suggesting there are few problems in the Australian market. One would expect considering probability (do not expect anything) the above index to pause around the old highs of 7800 to 7900 or even reach 8000. At those levels the volume indicators will be at over bought areas, then depending on the global situation will push through or take a breather.
We just "don't know" at what levels the market will reach, pause or fall. What we do know is what is happening NOW. The index is up and there appears to be good breadth in this rally. If you want to learn more about market breadth I have posted a link below.
Until next week,
Regards
Peter