See charts below with an On Balance Volume indicator and the Money Flow Indicator using a 13 period


I am going to get a little technical this week so you are either going to love it or hate it :)
The MFI is a more dynamic indicator because of the way its calculated - see here https://www.investopedia.com/terms/m/mfi.asp
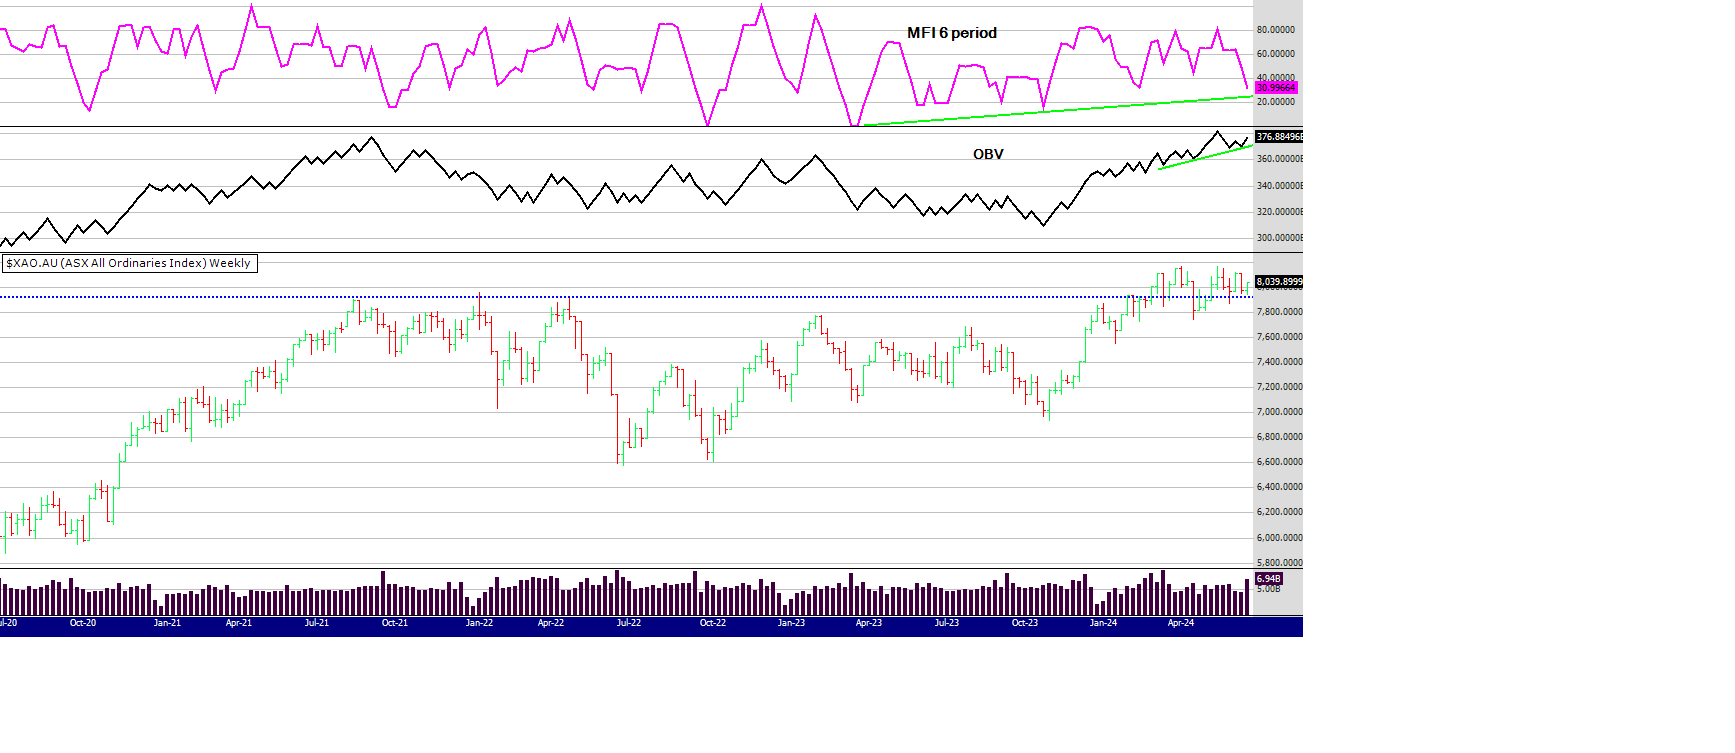
Sometimes the MFI can give strange signals - so sometimes (not often) it can help to change the time period of the indicator - to help analyse probability. In the top chart you can see that OBV is looking strong but MFI 13 week period is breaking down, what's that about? In my opinion its because of the big volume bar this week skewing the look of the indicator.
Moving down to the 2nd chart using the 6 period MFI you can see it's in oversold territory. I chose a six period (6 weeks) because that's the time frame (some say 7 weeks) markets or stocks often move up and down, before either taking a pause or reversing. Here is another link here for you to read up about that https://www.tradingview.com/script/kDC1dFjU-7-Week-Rule/
I think this market is still strong - despite the worry and bearishness expressed by some. This week there are 7 new 52WH signals and that is not the sign of a weak market. Of course prediction is not the aim here, but we are trying to glean from the stats and charts the probabilities of market direction.
As often mentioned I am keeping an eye on the Russell in the US. You can see on the chart below how closely corelated the XAO is with the US index. At the moment the XAO is outperforming and it's going to be interesting to see what happens if the Russell picks up the pace. Will the XAO continue to follow its bedmate - or is the XAO overbought? Is the Russell telling the XAO its got ahead of itself?
Or, is the XAO (Aus economy) now the stronger index?
I don't think we will have long to find the answer,
until next week
Peter
