See charts below with an On Balance Volume indicator and the Money Flow Indicator using a 13 period

I will discuss the chart above before moving to the one below. The correction from over bought territory continues but volume support remains. Next week will be crucial to see if volumes break to the downside. I suggest you read the last 2 weeks comments about what I think is happening in the markets. Please scroll to the chart below.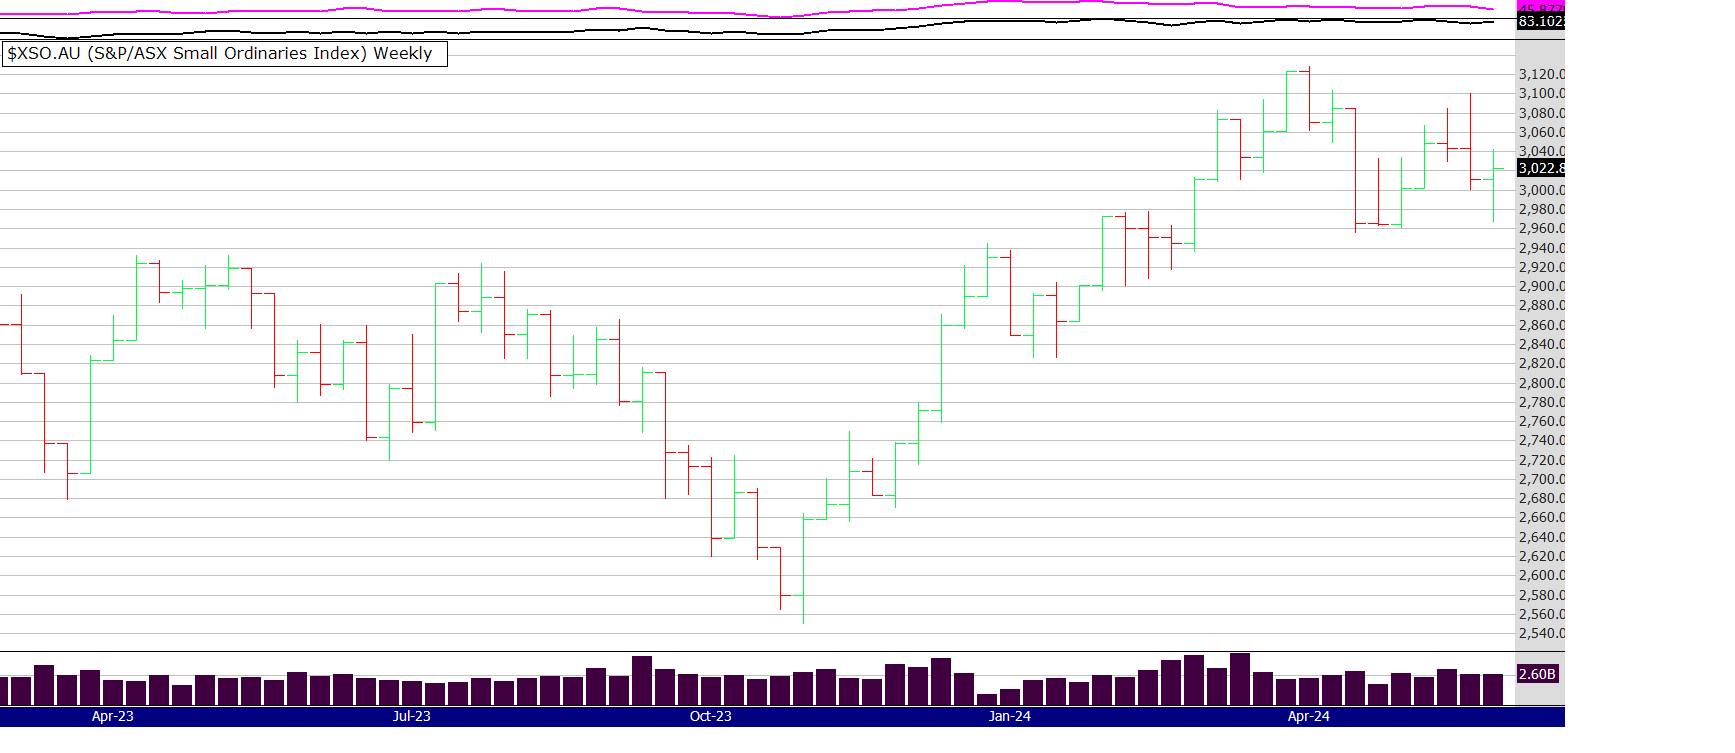
This is a chart of the Small Ords, the index represents stocks in the 100 to 300 range of the ASX. A similar grouping to the Russell 2000 in the US, that index represents stocks in the 1000 to 3000. Note the last bar, its green and the close is up, as opposed to the XAO (that contains the top 100) where the bar is red and the close is down.
This price action shows to me that interest in the smaller stocks is increasing, traders are rotating out of large caps looking for opportunity elsewhere. Also the market remains strong with eight 52 week closing highs. For more detail on my thinking re read the last 2 weeks comments, nothing has changed - yet.
Short and sweet this time
Have a great week
Peter