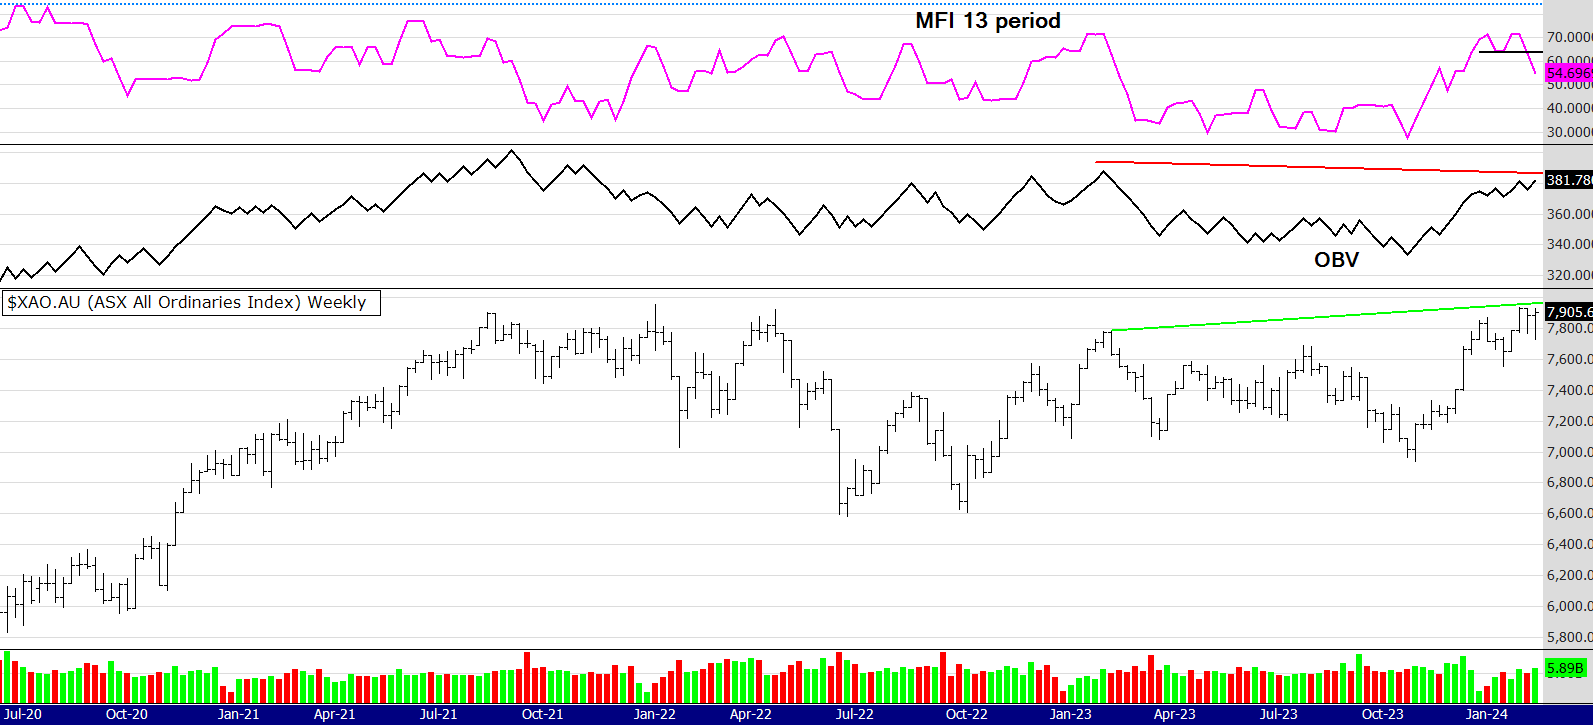
See charts below with an On Balance Volume indicator and the Money Flow Indicator using a 13 period

This week we have a conflicting signal on the volume indicators. You can see the MFI is coming down, but the OBV still looks strong. Also the ultimate indicator, which is the price, has finished the week strongly. So "two out of three ain't bad".
This week the Russell 2000 in the US was strong, although it looks a little overbought the rally is one to notice. Last night the US indexes slowed a little but commodities had a strong night, even lithium and gold rallied a bit, giving some hope to the suffering traders holding some of those stocks.
It's been another strong week for 52 week closing highs, they are listed below.
The chart below is PME, it's one of the feature charts in my presentation tomorrow. It took quite a hit, breaking decisively through the first line of support being the horizontal green line. It's very difficult emotionally when this happens, particularly if you have been disciplined and riding the trend since the entry. As you can see the moving average exit from the Mindful Trading book has not signaled a sell. You can see an older trade where it did around May 2023. Technically the MFI looks bearish but the more robust OBV looks ok, in fact it is showing a bullish divergence. The black EMA on the chart is the 24 (or 120 daily), price can often bounce off this level so for shorter term traders this is a stock to watch, in my opinion. This is not financial advice.

A reminder about my presentation, here is the link - I am on at 1pm
https://www.gomarkets.com/au/trading-mastery-2024/
Until next week!
Peter.
