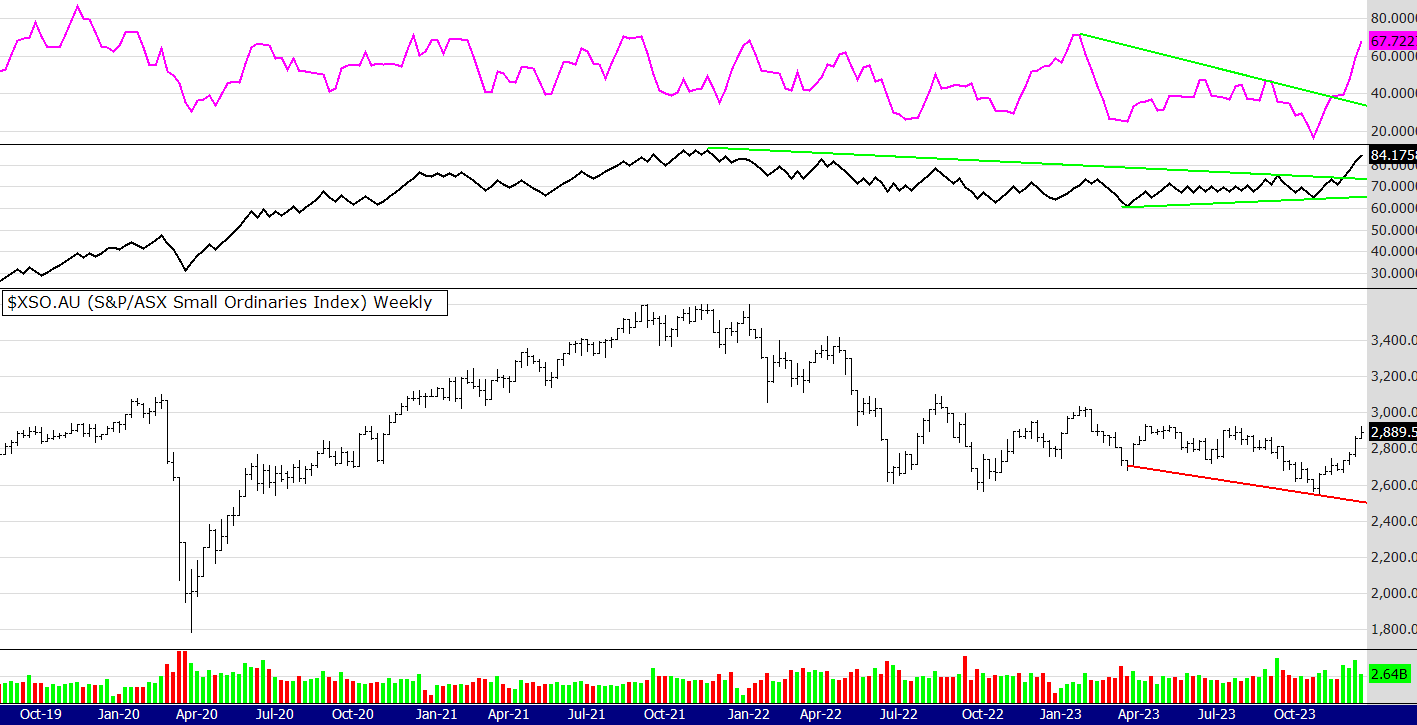
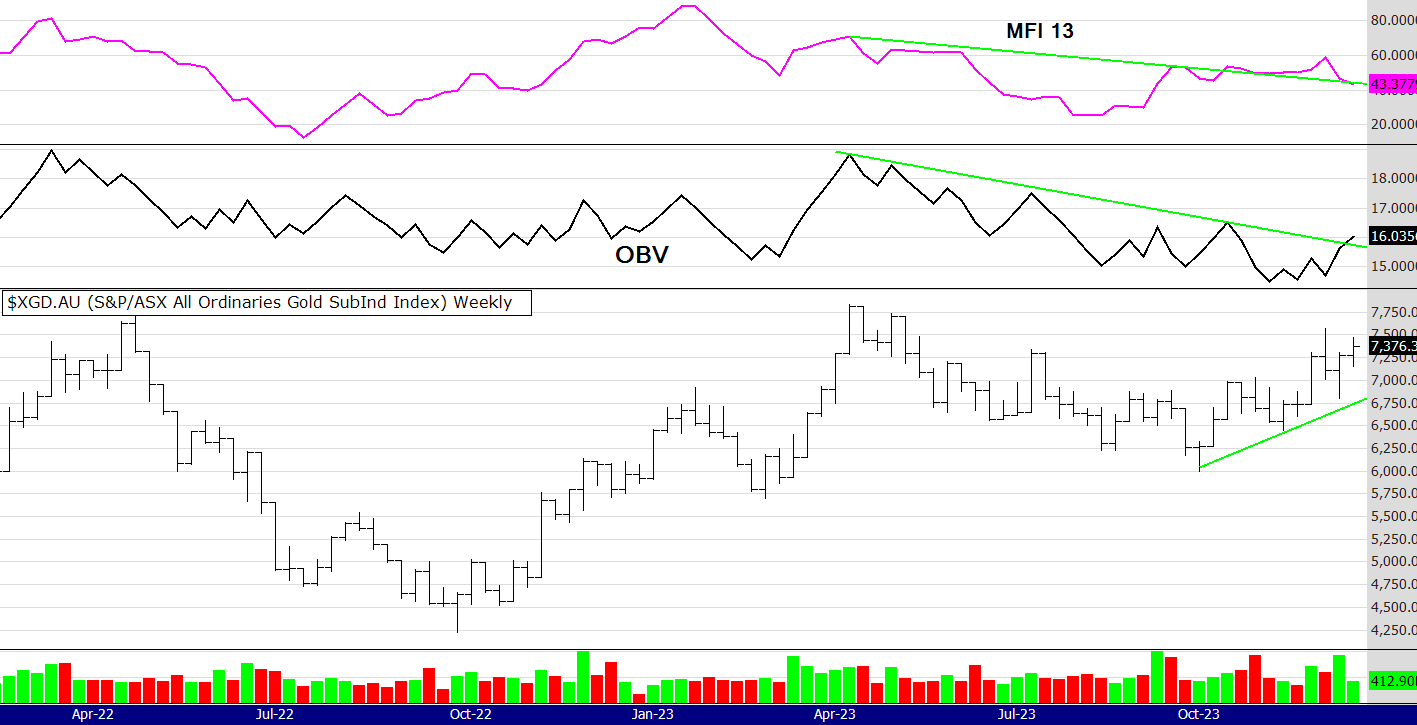
See charts below with an On Balance Volume indicator and the Money Flow Indicator using a 13 period

When we look at longer term charts (which very few people do) and take a moment to reflect, one could be entitled to ask the question "what was all the fuss about?
During Covid the OBV remained in an uptrend, it did so again 2 months ago when the market hovered around 7,000. At that time the MFI was deeply oversold and now it is approaching an over bought level. However, it could easily stretch up to the 80 level. Then the price could continue more and the MFI might then show a negative divergence as it has in the past (April 2019 and July 2020) . Of course that is all conjecture, although its worth remembering that nothing goes up in a straight line and at some point buyers will take a breather as they start to believe the market is too extended in the short term.
Only 2 months ago the talk was doom and gloom and recession - now its bull market into 2024 and beyond! I agree at the moment the chart looks strong, price and volumes are up and there appears to be no weakness. Volume last week was low as it was only a 3 day trading week and the same will happen for this coming 1st week in January. The low volume hasn't stopped a strong performance from the 52 week high system, registering another twelve this week. They are listed below.
Only one chart this week, hey its holiday time! Speaking of holidays I am overseas for most of January and Cynthia has told me I am not allowed to trade or be on the computer :)
I will do my best to post the weekly charts but if I don't, you know why!
Happy New Year
Peter
52 week closing highs as of the Fridays close 29/12/2023
Below are the alerts from a scan of the ASX 300 and the 300 to 500
300: ADT BHP BKW CBA CIA NXT PMV QUB SFR
300-500: BLY GQG QOR
Please note: in the eBook I wrote in 2016 (available for purchase on this website on the link below) I have made some changes to the system. If you have bought the eBook I am happy to email you a PDF explaining the changes I made, which from testing and trading does improve the system.
Here is the link to the eBook Mindful Trading using Winning Probability written in 2016 -
and the internationally published The Zen Trader (2022) - now in three languages.
IMPORTANT POINTS TO CONSIDER
A new 52 week high for this system is classified when the stock price is at its highest close (or equal to the highest close) counting back 52 weeks.
If a stock continues to make new highs, for example in the 53rd and 54th week, they are now regarded as ROLLING highs, not NEW 52 week highs.To clarify again, the buy signal for THIS system discussed is a NEW 52nd week or 1 year closing high, not a rolling high as is often given elsewhere.
The signals provided are WITHOUT A BULL FILTER.
The exit used FOR THIS METHOD is the 5/12 EMA crossover. Therefore, some stocks will be re signalling a new high buy signal if they have been recently exited by using the 5/12 exit within the last 12 months. This is important and you need to understand this.
Of course the 5 EMA needs to be above the 12 EMA to make the 52 week high valid, (otherwise we would be selling straight away) nearly always this is the case, but rarely if a stock spikes it is not.
So to repeat, the rules are: USING WEEKLY PARAMETERS!
Entry:
Share price to make a 52 closing (or equal to) week high (when selecting a buy, favour the cheapest stock)
The 5 ema to be above the 12ema
Exit:
if the 5 ema crosses below the 12 ema
The above system contains no position sizing, bull or bear filters or fundamental stock selection, these are discussed and taught to private clients or at my courses.
MARKET COMMENTS: As of the close on the 22/12/23: See charts below with an On Balance Volume indicator and the Money Flow Indicator using a 13 period

Well the rally continues! A pause was not what we got but a continuation. Another example of how difficult it can be to pick tops or bottoms and "going with the flow" is the most profitable but also the most difficult psychologically.
The price price blew through that overhead dotted trend line (producing twelve new 52 week closing highs) and dragged the volume indicators along for the ride. With no divergences to speak of the next resistance seems higher up the chart, perhaps around 6900. Next, let's look at the Small Ords index.

My trading friends will know I watch this index closely. That is because I tend to trade this sector more than the large caps as I think that is where more opportunities are - but I have been wrong so don't take my word for it! This sector was showing a strong bullish divergence around 9 weeks ago and its been straight up since then. It is a good sign to see this sector rally as it indicates a broad based rally in the market, something that has taken a while to happen. Next, the Russell 2000 in the US.

The Russell has finally broken above the 18 month resistance indicated by that dotted trend line, however it does appear over stretched to me with some negative divergence showing on the volume indicators - but I said that last week and the price just blew up past the neg divergence. However the SP500 (chart not shown) in the US looks like it could be double topping so we still need to be mindful that this rally has been strong and nothing is permanent. One more chart!

I did say last week I wanted to see more volume in this index of the gold stocks in Australia. The OBV has obliged and broken its down trend line but it's not the most convincing price and volume action. However during the Xmas trading season volumes in the spot gold market are thin because many traders are on holidays. This can result in some big moves in the gold price and also this sector, so I will be watching closely.
Merry Christmas,
Until next week
Peter
