See charts below with an On Balance Volume indicator and the Money Flow indicator
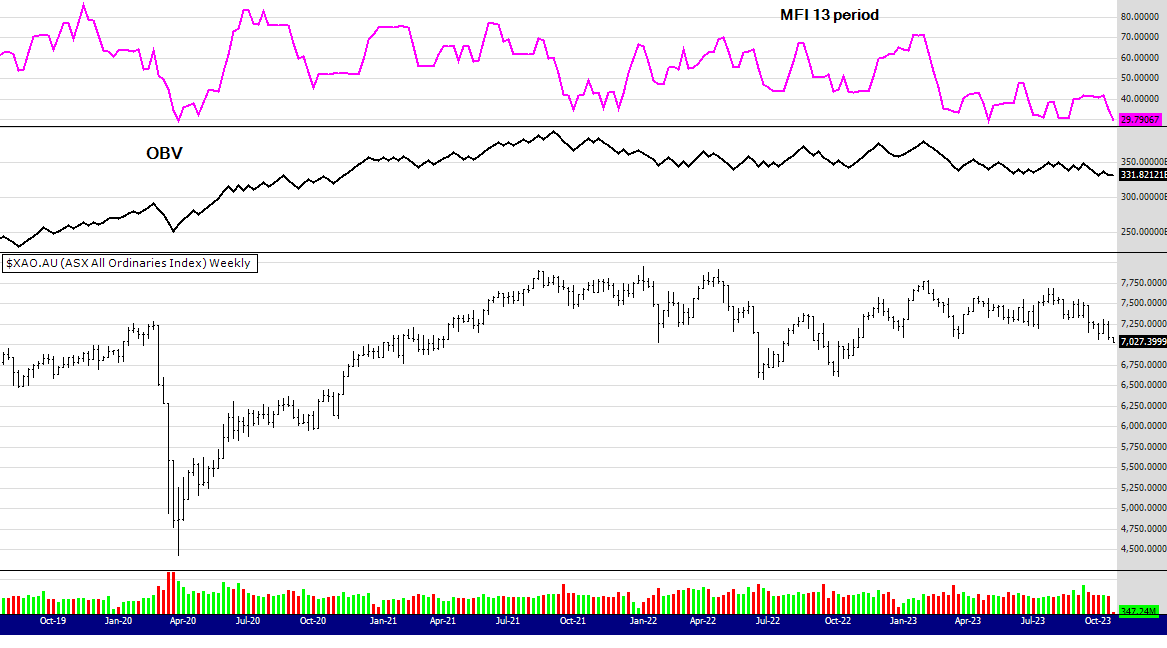
I dont use many indicators on my chart except price and volume. As you can see price and volume are trending down so it looks quite bearish. The SP500 in the US does appear to have some short term support so it may help this index get a bounce. Despite the bearish mood here, there were two 52 week closing highs in the XAO and I have listed them below.
I need to mention too this chart was posted midday Monday 23rd, so the last bar on the chart shows Monday mornings price action - as I have live data.
Please note the dates on the following comments, there is a big gap in the timeline as I took a break to complete and promote my book The Zen Trader.
MARKET COMMENTS: As of the close 20/1/23: See charts below with an On Balance Volume indicator, a bar chart and a 12 EMA.
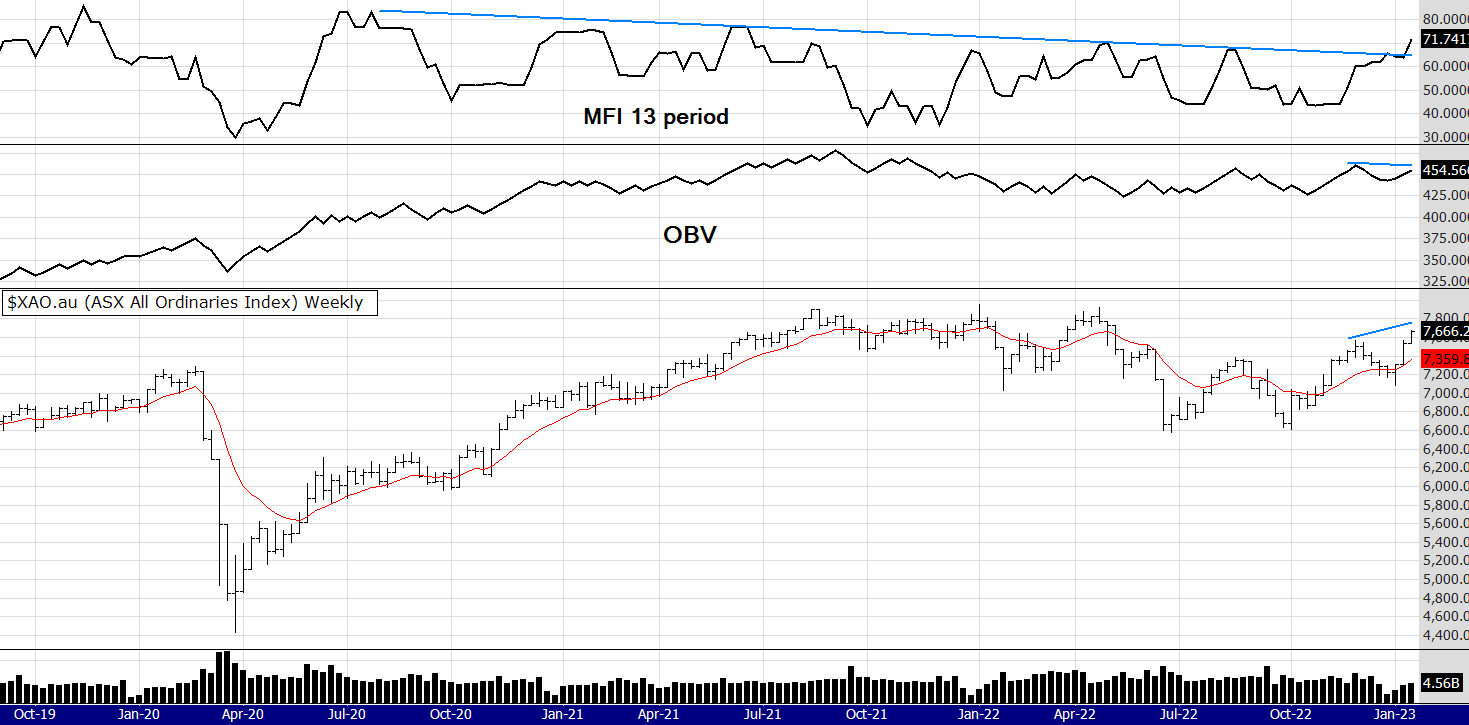
This is a very interesting chart. You can see I have included two volume indicators. The more dynamic Money Flow breaking a 2.5 year down trend line yet the more conservative OBV lagging a little (I think due to low holiday volumes).
Overall I think this is as positive as it gets, although some doubt remains about the global picture this chart is suggesting there are few problems in the Australian market. One would expect considering probability (do not expect anything) the above index to pause around the old highs of 7800 to 7900 or even reach 8000. At those levels the volume indicators will be at over bought areas, then depending on the global situation will push through or take a breather.
We just "don't know" at what levels the market will reach, pause or fall. What we do know is what is happening NOW. The index is up and there appears to be good breadth in this rally. If you want to learn more about market breadth I have posted a link below.
Until next week,
Regards
Peter